
ABSTRACT
With the ever-increasing focus on user needs and experiences, librarians are compelled to reposition themselves as providers of services and support. With an increasingly service-oriented approach to the profession, librarians must view their work and services through lenses of critical inquiry, assessment, and thoughtful design. Above all libraries are increasingly expected to plan, deliver, and assess their services based on evidence and data, an approach to librarianship which demands greater attention in professional literature and best practices. This paper presents a literature review of reference data collection strategies and discussion of evidence-based practices in librarianship. A case study is then presented for one academic library’s process of developing and implementing a new system to collect, classify, and analyse reference statistics. Named the TARP Model, this system allowed librarians at NYU Shanghai to understand user behaviours, train reference staff, assessing reference services and trends, and manage the logistics of providing reference services.
Introduction
Modern academic libraries are repositioning themselves as hubs for creation, instruction and research, and are increasingly focused on the needs and experiences of users. Librarians are compelled to leverage their expertise in research, instruction, and technology to support users’ research needs. As service providers, librarians must view their work through lenses of critical inquiry, assessment, and thoughtful design. Above all, they are expected to plan, deliver, and assess their services based on evidence and data.
Evidence-based assessment strategies inherently support the service-oriented nature of librarianship. Qualitative and quantitative data allow librarians to evaluate the benefits of services provided within the context of user needs, behaviours, and expectations (Bowron & Weber, Citation2017), and librarians have used statistics to count or classify reference transactions for decades.
In her literature review on classification systems for reference statistics, Debra Warner wrote that libraries were interested in assessing the success of reference transactions and correlating reference and instructional work; but when the Association of Research Libraries (ARL) first embarked on its reference statistics project, 23% could not supply such statistics (Warner, Citation2001).
The goal of this paper is to review existing literature on evaluating reference services, with particular focus on the qualitative and quantitative statistical evaluation and coding of reference services and interactions. This theoretical framework is the context for the subsequent case study of one academic library’s trial using qualitative statistics to understand patron needs and behaviours in order to effectively staff reference service points and tailor library services to meet patrons’ demonstrated expectations.
Literature Review
There is considerable research in library literature on strategies for the collection of qualitative and quantitative reference transaction data, and a librarian’s choice to use or adapt any of these models is determined by the questions that a library team seeks to answer. Statistics might be used to explore a range of issues such as:
understanding common challenges or sources of frustration, or ‘pain points', for patrons navigating library facilities and web services;
measuring the frequency with which library services and resources are used;
determining popular service points;
identifying peak times and days for patron traffic;
describing the language used or expected by patrons in different reference environments;
gauging the complexity or difficulty of questions, including the expertise required or time spent answering them;
identifying a collection’s strengths or weaknesses;
classifying types of questions received; or
measuring patron satisfaction, perceptions, or demographics.
There are many methods of collecting this information, including surveys, focus groups, ethnographic studies, transcript analysis, and manual coding systems (Luo, Citation2008).
Historical Approaches to Collecting Reference Statistics
Writing on the history of the measurement of library services including reference work, Lawrence Thompson lamented the crudity of evaluation methods employed by libraries (Thompson, Citation1951). He observed that early statistics and reports kept since the nineteenth century overwhelmingly dealt with the content of library holdings. One such example is an early report by Edward Edwards which tabulated the population served by major European and North American public libraries and the growth of their collections over 10 years (Edwards, Citation1848). As library collections evolved to include digital materials and library services were adapted in response, the focus of library statistics also changed.
In 1998, Carol Tenopir wrote in Library Journal that ‘traditional statistics that count number of interactions with patrons may not reflect…increased activity’ and that they failed to explain ‘what resources are most helpful or what formats require increased time with users’ (Tenopir, Citation1998). To understand the value of these resources and to improve library services, especially while some institutions were grappling with budget restrictions and reduced staffing, librarians turned to more descriptive data (Rawson, Davis, Harding, & Miller, Citation2013; Sullivan, Schoppmann, & Redman, Citation1994). Reference data can also help librarians communicate more effectively with users and staff service points appropriately (Bishop & Bartlett, Citation2013; Hughes, Citation2014; Scales, Turner-Rahman, & Hao, Citation2015) or address needs for new or enhanced support with library services (Arnason & Reimer, Citation2012). Bishop and Bartlett’s research allowed them to use reference staff more efficiently by deploying subject librarians to service points that received the majority of research-intensive questions.
Analysing and coding reference transactions can also empower librarians to evaluate the value and use of library services. Maximek et al. analysed their transactions to understand who was using their reference services, and why, to determine if their virtual reference work was adequate and matching standards for in-person reference (Maximiek, Rushton, & Brown, Citation2010). Librarians at Michigan State University Libraries used transaction analysis and web analytics to investigate user behaviour and evaluate the effectiveness of their service points for distance library users in order to reflect the value of their services (Tobias & Blair, Citation2015). Web analytics gave librarians insight into how users were interacting with the library website. This was supplemented by a transaction analysis project, whereby librarians analysed virtual reference chat logs to code questions in order to understand user’s pain points and expressions of frustration. Librarians at the University of Tennessee Health Sciences Library conducted a similar content analysis project as part of their website redesign initiative (Fan & Welch, Citation2016). Analysing contents of emails, text messages, and live chats, librarians categorised questions to improve the structure of the library website and to understand the language patrons used so that the content of the website was logical and understandable to them.
Lorna Rourke and Pascal Lupien also conducted a content analysis project by collecting data on the language patterns and behaviours of patrons on two virtual reference service points (Rourke & Lupien, Citation2010). They found that users approached these platforms differently: patrons posed more research-intensive questions and used formal language on one platform; by contract, they brought more directional and policy-based questions to online chat services and used more informal language with librarians in that environment.
Categorisation Schemes for Qualitative Reference Statistics
The categorisation of reference questions is a common strategy for library statistics. Neville and Henry pointed out that ‘reference statistics have been troublesome to collect because of the qualitative nature of questions and the difficulties in assigning a wide variety of these questions into a minimal number of strict categories. The classification of questions must be distinguishable and consistent’ (Neville & Henry, Citation2009, p. 372). Much research has been dedicated to the development of these categories (Baker, Citation1991; Calabretta & Ross, Citation1984; Matthews, Citation2018; Rothstein, Citation1990; Witucke & Schumaker, Citation1991), but systems developed by three scholars are especially notable: those by William Katz, Debra Warner, and Bella Karr Gerlich and G. Lynn Berard.
Katz presented his four categories for reference questions in Introduction to Reference Work, first published in 1969: directional, ready reference, specific search questions, and research questions (Katz, Citation2002). Subsequent researchers noted that these categories do not capture the complexities of reference questions and that they were inadequately defined. Warner presented a new classification system in 2001 to account this ambiguity (Warner, Citation2001). Warner’s four categories focused on how resources and skills were used during a reference transaction: non-resource-based, skill-based (also referred to as ‘how-to’ questions), strategy-based, and consultation. Neville and Henry (Citation2009) compared the Warner model to traditional classification systems, it was found to be more consistent and easier to use with less confusion about the definition of categories themselves. They also referenced a third model, the more recently developed Reference Effort Assessment Data (READ) Scale which other libraries were beginning to test in their reference systems.
Development and Applications of the READ Scale
The READ Scale was introduced in 2007 as a six-point measure for classifying reference transactions based on the effort and time required to answer a given question. The authors observed that library literature indicated a decline in transaction numbers and sought to resolve the discrepancy between the number of reference questions handled and the level of expertise needed to answer them. They remarked ‘this method is especially appealing in a profession where the industry standard for recording statistical data is a hash mark that records and rewards quantity as opposed to quality’ (Gerlich & Berard, Citation2007). Each level of the READ Scale is numerically represented along a scale of 1–6, with 1 representing reference questions requiring the least amount of time and effort, and demanding no specialised expertise. Level 6 questions require the most effort and time and include inquiries that cannot be answered on the spot. Introducing the READ Scale, Gerlich and Berard described the process of testing its ease of use and clarity among librarians at Carnegie Mellon University. The authors acknowledged that librarians were generally in agreement when rating questions at levels 1, 2, and 6, but were more likely to differ when ranking levels 3, 4, and 5.
The READ Scale’s recognition of library workers’ time, effort, and expertise has great appeal, and has been used or adapted by many library systems. Gerlich and Whatley have continued to research the READ Scale and reflected on early use of the READ Scale and its value in determining staffing schedules (Gerlich & Whatley, Citation2009). Librarians at Austin Peay State University Library successfully incorporated the READ Scale into their assessment methods (Bowron & Weber, Citation2017), and librarians at the McConnell Library at Radford University used a modification of the READ Scale to train student workers with the goal of encouraging responsible referral practices (Vassady, Archer, & Ackermann, Citation2015). The challenge of training library workers in proper referral practices is familiar to many librarians. Warner quotes Elizabeth Malia as saying that their ‘biggest problem lies in the area of making referrals to the librarians’ (Warner, Citation2001).
The READ Scale is available for any institution to use at no cost, and its creators will support interested librarians as they adopt or adapt the READ Scale. As a flexible model, the READ Scale can be integrated with a library’s existing system for tracking statistics. The Library at Colorado State University-Pueblo combined their use of the READ Scale with their own web-based program for maintaining statistics, called DART (Hudock & Sullivan, Citation2011). DART reflected five Student Learning Outcomes (SLOs) (Key Services, Research Tools, Search Strategies, Evaluation, and Citation/Documentation), which were mapped to question categories. For example, the ‘Key Services’ SLO would break down to categories such as circulation, book renewal, interlibrary loan, and library hours. Within DART, librarians could augment the five SLOs and their question categories with the READ Scale, allowing librarians to cross-reference a learning outcome with a question category and READ Scale ranking.
Gerlich and Berard have continued to test and assess the viability of the READ Scale, and in one assessment it was found that the majority of library workers using the READ Scale would recommend its use (Gerlich & Berard, Citation2010).
Case Study
This culture of collecting qualitative and quantitative data has empowered libraries to provide user-centred services and develop evidence-based strategies for staffing, training, and assessment of services. Existing models, such as the READ Scale and those developed by Katz, Warner, and others have been used to great effect at many institutions. Others may find it useful to adapt these models or develop an entirely new model to address specific research and analytical questions about staffing, resource use, or patron behaviours. This paper focuses on the latter scenario, in which librarians at NYU Shanghai developed an in-house system for classifying and tracking reference transactions to facilitate training, staffing, and the appropriate provision of services.
NYU Shanghai is a unique institution, and librarians must rise to meet the needs and expectations of their user population. Located in the cosmopolitan heart of a major city in China, the library serves a diverse, multinational and multilingual community of over 1200 undergraduates, faculty, and staff. Instruction at is conducted in English, and the majority of the library’s collections are in English, with a significant number of Chinese-language resources included. As a joint Sino-Foreign university, the library follows policies and service strategies similar to those of North American institutions which may be new or unfamiliar to non-Western students. Reflecting the diversity of the university and its student body, library staff also represent a variety of nationalities, languages, and expertise. The majority of library workers in this institution are native speakers of Mandarin Chinese, speaking English as a second language.
Further complicating the nature of the library’s services, it is part of a globally networked university system with three degree-granting campuses across the globe and a network of 11 global academic centres on five continents. Library workers at each of the three main campuses provide in-person reference services and research support to their local users; these services are augmented by the provision of virtual reference through email (using Qualtrics and Questionpoint forms) and live chat services hosted by Libraryh3lp. Through this consolidated effort by librarians, virtual reference services are available almost 24/7 to affiliated students, faculty, and staff across the globe.
Since the founding of the university’s campus in China in 2012, the library has sought to provide high-quality and readily accessible reference services virtually and in-person. The university, including the library’s services and collections, was initially located in a space shared with another local university until it relocated to its own permanent facility in 2014. Throughout this period, and during the first four years of the library’s existence, the availability and visibility of these services have increased significantly.
The library has always provided both in-person and virtual reference support. Librarians staff in-person reference shifts with virtual reference shifts staffed by librarians as well as library assistants and qualified interns. In-person reference was initially provided at the circulation desk, but hours were not consistently scheduled and staffed. As a primary service point, the circulation desk was busy with student workers, librarians, and library assistants. Patrons often expressed confusion about whether librarians were there for research support or to provide circulation services. In response, a dedicated reference desk was added to the circulation desk in April 2016. At this same time, librarians began to implement strategies to increase the efficiency of their services and staffing and to better understand the needs and expectations of their users.
Early Approaches to Statistics
Librarians were motivated to develop a method for tracking statistics in order to answer specific questions about user behaviour and staffing needs. Later refinements to this project were similarly designed to collect data purposefully, rather than tracking statistics because they might be interesting or simply for the sake of doing so.
Changes in staffing through departures and new hires, a desire to increase the availability and efficiency of library services, and a request from the library’s leadership for the library staff in China to cover more virtual reference hours confronted librarians with a need for insightful reference statistics. A collaborative Google Spreadsheet was designed in April 2016 to capture this data. In addition to tracking the number of reference questions handled through Libraryh3lp and in person, this document allowed library workers to maintain a shared record of one-on-one research consultations held in-person and through email, and the number of students reached through pre-scheduled and requested workshops.
In the first iteration of this statistics project, library workers manually tracked reference statistics and circulation desk statistics separately, though both were quantitative measures of the number of questions received in each shift. When tracking interactions at the circulation desk, library workers would indicate both reference questions and circulation statistics manually with a check mark. Similarly, the reference statistics form only indicated the number of reference questions handed, with a column included for additional notes and observations. The purpose of this notes field was for library workers to describe particularly difficult or unusual questions; it quickly became apparent that there was no clear definition of what constituted a ‘difficult or unusual question’. For example, a question about locating toilets or understanding the library access policies from a user in one of the university’s other global centres would be very difficult for any library worker unfamiliar with that building. As a result, library staff often felt compelled to detail each question received regardless of its difficulty, making the statistics tracking form cumbersome to use and producing little valuable data. Another challenge that library workers encountered was training library assistants, interns, and student workers to know when and how to refer research questions to librarians. Librarians sought to cultivate an environment where referring questions was common practice and encouraged. In this way, library assistants and interns would be empowered to handle questions responsibly and with confidence.
Librarians also hoped to staff their reference shifts more efficiently based on statistical data. Bowron and Weber remark that ‘when outlining reference desk work schedules, it is useful to identify times of highest patron activity and needs for assistance’ (Bowron & Weber, Citation2017). However, like Bowron and Weber, library workers recognised that there is not necessarily a correlation between the number of questions received and the level of complexity or difficulty of those questions.
Beginning in the Fall 2016 semester, a librarian would simultaneously staff the reference desk and chat reference queues 8 h a week. Before this, a librarian would only staff the reference desk during their shift while another librarian or library assistant covered the chat reference queues. The decision to consolidate effort was based on quantitative transaction statistics and on personal observations that neither service point was exceedingly busy. Although those statistics do not indicate how many of those transactions were advanced research questions, anecdotal reports from library staff and users indicate that this heightened visibility has encouraged patrons to approach librarians with research questions. Additionally, it was felt that patrons were less likely to approach librarians with circulation questions. In addition to these 8 h of combined reference shifts, the library also provided 7–12 h of chat-only reference shifts per week.
Library workers covered these shifts based on individual availability. As a result, library assistants and interns would often receive challenging research questions that should have been referred to librarians, but the lack of clear referral guidelines and practices impeded this. Library leadership recognised that the reference statistics model could be redesigned to allow the reference coordinator to identify patterns in user traffic and staff reference shifts more efficiently based upon statistical evidence.
Encountering the READ Scale
In December 2016, librarians at NYU Shanghai were introduced to the READ Scale by guest speaker and were inspired to reconsider how they viewed and understood reference transactions handled virtually and in person. The system of categorising questions based on certain characteristics was appealing and librarians worked together to analyse the READ Scale for its potential applicability to their own institution. As librarians discussed the structure and focus of the READ Scale, some voiced concerns that the six levels seemed overly granular and specific for the nature of the small quantity of questions handled at their own institution. The distinction between the levels of the READ Scale, especially higher levels, also seemed highly subjective. This recalled the existing issue of library workers differing in opinion on the definition of a ‘difficult’ or ‘unusual’ question. The ambiguity inherent in defining complexity was further complicated by differences in language and culture within the library team. Furthermore, the focus of the READ Scale was the perceived effort, difficulty, and time required to answer a reference question; it was the experience of library workers at this institution that the difficulty of a question did not always directly correlate to the amount of time or level of expertise needed to explain or troubleshoot an issue. For its many benefits and qualities, the READ Scale was not an ideal fit for answering the questions librarians were asking, and its subjectivity was prone to conflicting interpretations of difficulty through the lenses of library workers’ cultural or linguistic frameworks. Instead, the librarians were inspired by the READ Scale to develop their own model for categorising and tracking reference transactions.
Developing the TARP Model
To develop a new reference statistics system, the librarians at NYU Shanghai began by reflecting upon user behaviour and patterns in the questions patrons brought to library staff. Ultimately, the staff decided to develop a system to help them better understand user behaviour and when the subject expertise of librarians was required to meet patron needs. In the short term, library staff sought to understand what days and times patrons were most likely to pose intensive research questions on via chat services, in order to staff those shifts appropriately.
Like the systems developed by Warner and Katz this model codes questions by their type, not by their perceived difficulty. Librarians named this model TARP, and presented the model under the headline: ‘TARP has you covered!’ TARP is an acronym that stands for the four types of questions tracked:
Technical (T) – helping a patron troubleshoot technical issues with tools & resources such as printers or Wi-Fi.
Access (A) – questions generally considered within the purview of the library’s Access Services team, including accessing spaces, accounts, and document delivery. This term was chosen because these access elements correlated to the specific duties of the access services team, and many library assistants primarily worked as part of the access team. This made it easier to clarify the difference between Access questions and Ready Reference questions.
Ready-Reference (R) – questions about locating or getting to known research and library resources that do not require the specialised expertise of a librarian: ‘I know what source I need, but not how to locate it.’
Peculiar (P) – questions about conducting research, citations, and discovering library resources that would usually be referred to a librarian: ‘I need to discover new sources, identify good databases, or refine my research topic.’
To further explain how TARP might be identified or used, librarians wrote example questions in each category that might be especially or common:
T: ‘Where are the printers?’ ‘Printers are out of ink.’
A: ‘What are the library hours?’ ‘How do I visit our special collections?’ ‘Where are the bathrooms?’ ‘Can you help me place a request through Interlibrary Loan?’
R: ‘I have a citation for an article that I want to read. Can you help me locate it?’ ‘Can you help me navigate call numbers?’
P: ‘I am working on a research project – what are good databases to use for my topic?’ ‘Can you help me develop a better keyword search?’
Library workers also adapted the statistical methods used at the circulation desk to include the TARP Model. Thus, librarians were able to view in a single document the types of questions received at all access points and could identify trends and peaks in the number and character of questions.
The TARP Model also proved useful for training new library workers, including professional librarians and library assistants to student workers and interns. A trainer could review past chat transcripts and work with the trainee to discuss how they both would classify a question, and justify that classification. In addition to helping the trainee better understand the logic behind the TARP Model, this allowed the trainer to recognise misleading or unclear parts of the model or otherwise improve it for usefulness and clarity. Librarians developed scripts for common T-type, A-type, and R-type questions for staff to use when answering questions.
Library staff liked the clarity of the TARP Model categories, especially since training materials included explicit examples of P-type questions and built in a system for student workers, paraprofessionals, and interns to know when and how to refer complicated research questions to librarians. Library workers reported feeling comfortable with this referral system and believed that they were handling these difficult questions appropriately. This characteristic of the TARP model distinguished it from Katz, Warner, and the READ Scale. Since transitioning from a quantitative statistics tracking approach to a qualitative one in the Spring 2017 semester, the data indicated that the majority of reference questions handled virtually and in person at the circulation and reference desks were T-type and A-type questions.
Analysis of Reference Data
The reference transaction data collected by librarians illustrate clear patterns in user behaviour. details the total number of questions received via chat queues from 1 January 2017 through 31 May 2018. It provides an hourly count of the types of questions answered using the TARP Model. The data on this table were analysed to illustrate patterns in question type, and not overall traffic over chat queues; therefore, it only accounts for shifts when patrons asked questions over the chat queue. Any shifts that passed without reference transaction are excluded from this table.
Table 1. Total number of questions received via chat queues per day from 1 January 2017 through 31 May 2018.
Librarians were able to analyse the data to further clarify patterns in user behaviour and traffic through a variety of service points. Library staff answered reference question by phone or in-person at the circulation and reference desks seven days a week, and by chat queues during weekdays in the early afternoon. The least number of questions were asked on Saturdays and Sundays, when classes are not held, and the library has shorter hours. During the week, however, traffic to in-person and virtual service points alike was highest on Mondays, gradually tapering off throughout the week ( and ).
Figure 1. Total number of questions received in-person per day from 1 January 2017 through 31 May 2018.
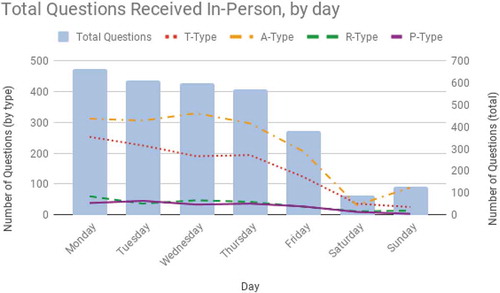
Figure 2. Total number of questions received via chat queues per day from 1 January 2017 through 31 May 2018.
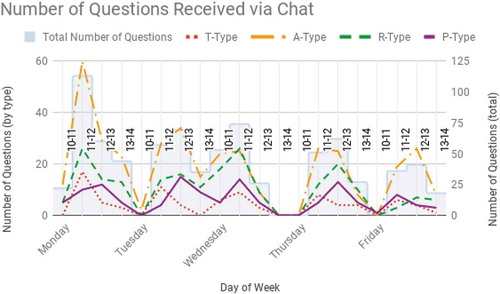
Virtual Reference questions, which were predominantly initiated by patrons at the university’s North American campus, peaked at 12 PM. In-person transactions began to increase steadily from 10 AM, peaking at 1 PM, and decreasingly slowly throughout the before dramatically dropping off at 5 PM and again at 6 PM ().
Figure 3. Total number of questions received in-person per hour from 1 January 2017 through 31 May 2018.
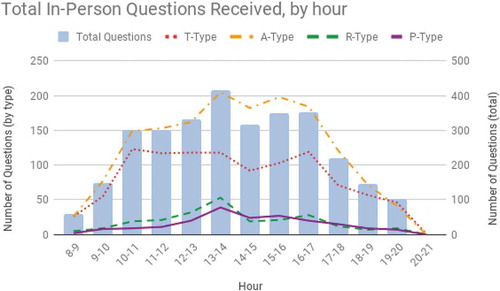
After a year of collecting reference statistics with the TARP Model, the reference coordinator was able to identify patterns in when P-type questions came to reference service points. It was found that in-person P-type questions were most common between 12 PM and 6 PM, peaking at 1 PM just after the lunch hour concluded. All this information allowed to recommendation of reference desk staffing schedules to the library director, and also to schedule library assistants and interns to virtual reference shifts that typically had fewer P-type questions. Additionally, understanding these trends in user behaviour will guide programming decisions and outreach strategies. Presently, the library team intends to continue using the TARP Model, and is planning to review email transcripts for reference and access-related questions to retroactively add to statistics tracking one-on-one communications, which also uses the TARP Model.
Conclusion
Throughout the process of developing the TARP Model, librarians considered how reference transaction data could provide insights into user behaviours, the types of questions patrons would ask, and patterns in demand for reference services. Based on these considerations, and accounting for potentially complicating factors such as language barriers and varying levels of expertise, the resulting TARP Model suits the library’s demands. Librarians found that developing the system to reflect the university’s culture made it easier to understand and implement. Useful strategies for developing and adapting models for tracking and categorizing reference statistics include:
conducting a transcript analysis of chat reference questions to identify common themes or patterns in user language and behaviour, or to identify patron pain points.
evaluating reference questions collectively to develop a common language for categorising questions;
defining categories for questions clearly, including example questions or sub-categories;
researching and adapting existing models, such as the READ Scale or the models proposed by Katz or Warner, to develop a qualitative rubric;
periodically reviewing the system designed in order to improve unclear elements or update the model to match changes in the library’s culture;
training and refreshing staff as a team is to ensure that staff are defining categories or categorizing questions in harmony.
Approaches to collecting and evaluating statistics and providing evidence-based services are as unique and the institutions that apply them – there may never be a system for collecting reference statistics for all libraries (Neville & Henry, Citation2009). It is entirely possible that over time an individual library will modify its strategies for collecting statistics or transition from one model to another based on its changing needs. The next step for library workers using the TARP Model is to review its definitions and categories, retrain staff, measure its effectiveness, and develop or refine user services based on the lessons learned from analysing the data collected.
Disclosure statement
No potential conflict of interest was reported by the author.
Additional information
Notes on contributors
Caitlin MacKenzie Mannion
Caitlin MacKenzie Mannion ([email protected]) has worked as a librarian at Shanghai New York University (NYU Shanghai) since 2015. In addition to her work there as a reference & subject librarian for the arts and humanities, Ms. Mannion is the Reference & Research Services Coordinator for the NYU Shanghai Library. In this role she oversees the development of library instruction workshops as well as the delivery and evaluation of in-person and virtual reference services. This work includes training new hires in reference work, leading a team of librarians and technologists in library instruction, overseeing the collection of statistics to measure use of library services, and analyzing those statistics to inform future programming and delivery of reference and instruction.
References
- Arnason, H., & Reimer, L. (2012). Analyzing public library service interactions to improve public library customer service and technology systems. Evidence Based Library and Information Practice, 7(1), 22–40.
- Baker, S. L. (1991). The measurement and evaluation of library services (2nd ed.). Arlington, Va.: Information Resources Press.
- Bishop, B. W., & Bartlett, J. A. (2013). Where do we go from here? Informing academic library staffing through reference transaction analysis. College & Research Libraries, 74(5), 489–500.
- Bowron, C. R., & Weber, J. E. (2017). Implementing the READ scale at the Austin Peay State university library. The Journal of Academic Librarianship, 43(6), 518–525.
- Calabretta, N., & Ross, R. (1984). Analysis of reference transactions using packaged computer programs. Medical Reference Services Quarterly, 3(3), 23–47.
- Edwards, E. (1848). A statistical view of the principal public libraries in Europe and the United States of North America. Journal of the Statistical Society of London, 11(3), 250–281.
- Fan, S. C., & Welch, J. M. (2016). Content analysis of virtual reference data: Reshaping library website design. Medical Reference Services Quarterly, 35(3), 294–304.
- Gerlich, B. K., & Berard, G. L. (2007). Introducing the READ scale: Qualitative statistics for academic reference services. Georgia Library Quarterly, 43(4), 7–13.
- Gerlich, B. K., & Berard, G. L. (2010). Testing the viability of the READ scale [Reference effort assessment data]©: Qualitative statistics for academic reference services. College & Research Libraries, 71(2), 116–137.
- Gerlich, B. K., & Whatley, E. (2009). Using the READ scale for staffing strategies: The Georgia college and state university experience. Library Leadership & Management, 23(1), 26–30.
- Hudock, S., & Sullivan, D. (2011). Hit the reference transaction mark: Incorporating READ into DART. Colorado Libraries, 36(1), 1–6.
- Hughes, A. M. (2014). Content analysis of reference transactions provides guidance regarding staffing of library service points. Evidence Based Library and Information Practice, 9(2), 31–33.
- Katz, W. A. (2002). Introduction to reference work (8th ed.). Boston: McGraw-Hill.
- Luo, L. (2008). Chat reference evaluation: A framework of perspectives and measures. Reference Services Review, 36(1), 71–85.
- Matthews, J. R. (2018). The evaluation and measurement of library services (Second ed.). Santa Barbara, CA: Libraries Unlimited.
- Maximiek, S., Rushton, E., & Brown, E. (2010). Coding into the great unknown: Analyzing instant messaging session transcripts to identify user behaviors and measure quality of service. College & Research Libraries, 71(4), 361–373.
- Neville, T. M., & Henry, D. B. (2009). Reference classification - is it time to make some changes? Reference & User Services Quarterly, 48(4), 372–383.
- Rawson, J., Davis, M. A., Harding, J., & Miller, C. (2013). Virtual reference at a global university: An analysis of patron and question type. Journal of Library & Information Services in Distance Learning, 7(1–2), 93–97.
- Rothstein, S. (1990). The measurement and evaluation of reference service. The Reference Librarian, 11(25–26), 173–190.
- Rourke, L., & Lupien, P. (2010). Learning from chatting: How our virtual reference questions are giving us answers. Evidence Based Library and Information Practice, 5(2), 63–74.
- Scales, B. J., Turner-Rahman, L., & Hao, F. (2015). A holistic look at reference statistics: Whither librarians? Evidence Based Library and Information Practice, 10(4), 173–185.
- Sullivan, W., Schoppmann, L. A., & Redman, P. M. (1994). Analysis of the use of reference services in an academic health sciences library. Medical Reference Services Quarterly, 13(1), 35–55.
- Tenopir, C. (1998). Reference use statistics. Library Journal, 123(8), 32–34.
- Thompson, L. S. (1951). History of the measurement of library service. The Library Quarterly: Information, Community, Policy, 21(2), 94–106.
- Tobias, C., & Blair, A. (2015). Listen to what you cannot hear, observe what you cannot see: An introduction to evidence-based methods for evaluating and enhancing the user experience in distance library services. Journal of Library & Information Services in Distance Learning, 9(1–2), 148–156.
- Vassady, L., Archer, A., & Ackermann, E. (2015). READ-ing our way to success: Using the READ scale to successfully train reference student assistants in the referral model. Journal of Library Administration, 55(7), 535–548.
- Warner, D. G. (2001). A new classification for reference statistics. Reference & User Services Quarterly, 41(1), 51–55.
- Witucke, V., & Schumaker, C. J. (1991). Analyzing reference activities: The affordable solution. RQ, 31(1), 58–69.