
Abstract
Speciation and the phylogenetic relationships of species in the Guentheri Group in Turkey, which have a diploid chromosome number of 54, were studied using mitochondrial mt-co1, mt-cyb and 12S rRNA gene markers. A Bayesian Markov chain Monte Carlo (MCMC) tree clearly separated the Thrace and western and southeastern Anatolia populations. Genetic distance values (d) appeared relatively high in the southeastern Anatolia population (Microtus guentheri) from other populations, but rather low distance values were found between Thrace and western Anatolia populations. Our findings support the earlier classification of M. guentheri as a different species that previously split from the basal population of western Anatolia. However, Kimura two-parameter (K2P) values greater than 10% are generally accepted for specification, and they were lower than this in all groups. So, the genetic distances of the Turkish Thrace and western Anatolia populations do not support the suggestion that the western Anatolia population is a separate species. But this value is sometimes very low in newly evolved and approximate species. Thus, the populations of Turkish Thrace and western Anatolia are tentatively referred to Microtus hartingi due to the geographical separation of the Dardanelle and Bosphorus Straits for fossorial and surface-dwelling species even in the glacial connections.
Introduction
The genus Microtus (Schrank, 1798) is distributed in the Holarctic Region and represented by approximately 15 subgenera and 62 species (Musser & Carleton Citation2005; Kryštufek & Vohralík Citation2009). Microtus is one of the most diversified rodent genera (Musser & Carleton 1993) and an ideal model group for studies of speciation, especially those focused on Quaternary glacial cycles (Jaarola et al. Citation2004).
Ellerman (Citation1941) divided the Sumeriomys (Argyropoulo, 1933) subgenus of Microtus into two groups: “Socialis” and “Guentheri”. The voles of the “Guentheri Group” are species with 2n = 54 chromosomes (Golenishchev et al. Citation2002), and it has traditionally been accepted that Microtus guentheri (Danford & Alston Citation1880), whose type location is Türkoğlu (Kahramanmaraş Province, Turkey), is distributed in the southeastern Balkans, Turkey, Syria, Israel and a limited area of northern Lebanon (Ellerman & Morrison-Scott Citation1951; Niethammer & Krapp Citation1982; Harrison Citation1991; Wilson & Reeder Citation2005; Aulagnier Citation2009). Nevertheless, morphological, karyological and systematic studies have revealed the complex taxonomy and phylogenetic relationships among the species in the Guentheri Group (Yiğit & Çolak Citation2002; Kryštufek et al. Citation2009, Citation2012; Thanou et al. Citation2012; Yiğit et al. Citation2012; Zima et al. Citation2013; Markov et al. Citation2014). Based on these studies, the three major taxonomic factors defining the Turkish Guentheri Group are as follows.
First, the Thrace, western and southeastern Anatolia populations differ from each other with regard to their morphological measurements and cytogenetical features (Yiğit & Çolak Citation2002; Yiğit et al. Citation2012; Zima et al. Citation2013; Markov et al. Citation2014).
Second, the mountain systems that separate western Anatolia from southeastern Asia along the Anatolian diagonal prevented M. guentheri from moving westward, so the Thrace and western Anatolia populations were isolated from the southeastern populations and differentiated (Yiğit & Çolak Citation2002; Yiğit et al. Citation2002, Citation2012; Kryštufek et al. Citation2009). Yiğit and Çolak (Citation2002) and Yiğit et al. (Citation2012) suggested that Microtus guentheri distributed in southeastern Anatolia differ from the western and Central Anatolia populations, which are classified as Microtus lydius. In addition, based on morphometric differences, these authors defined the populations from the coastal areas of western Anatolia as Microtus lydius lydius, those from Central Anatolia as Microtus lydius ankaraensis, and the Thrace population as Microtus hartingi. However, both the Thrace and western Anatolia populations were later assigned to M. hartingi by Kryštufek et al. (Citation2009, Citation2012).
Third, the Dardanelle and Bosphorus Straits are important geographical barriers to terrestrial animals that likely formed in the Late Pliocene (~ 2 Ma) (Bacescu Citation1985; Tortonese Citation1985; Çağatay et al. Citation2000; Yaltırak et al. Citation2000). Additionally, the 2n = 54 chromosome number was reported to be ancestral to the Microtus genera, which split 0.5–3.5 Ma (Lemskaya et al. Citation2010). In this respect, the Thrace and western Anatolia populations have been separated for a long time, and they have a high probability of becoming different species. Genetic studies using mt-cyb markers with a small number of samples were performed by Jaarola et al. (Citation2004), Kryštufek et al. (Citation2009, Citation2012) and Thanou et al. (Citation2012), and they provide some evidence that the western Anatolia and Thrace populations are the same species as Microtus hartingi.
Therefore, this study was aimed at clarifying the patterns of speciation described above and the phylogenetic relationships among the Guentheri Group voles using three mitochondrial genetic markers, mt-co1, mt-cyb and 12S rRNA, and large samples from Thrace, western and southeastern Anatolia.
Materials and methods
Sampling
The frozen tissue samples were obtained from the Ankara University Mammalian Research Collection (AUMAC, http://www.mammalia.ankara.edu.tr ). In addition to 57 Guentheri Group samples from 15 locations (), one Microtus levis sample from GenBank was used as an outgroup. The Mus musculus and Rattus rattus sequences used in the analysis of evolutionary divergence times were also obtained from GenBank.
Figure 1. Locations of Guentheri Group species samples in Turkey. 1: Kırklareli; 2: Gelibolu-Çanakkale; 3: İzmir; 4: Aydın; 5: Denizli; 6: Burdur; 7: Isparta; 8: Afyon; 9: Konya; 10: Ankara; 11: Kırşehir; 12: Hatay; 13: Kilis; 14: Kahramanmaraş; 15: Adıyaman. Squares indicate the Turkish Thrace population, diamonds indicate western Anatolia, and triangles indicate southeastern Anatolia.
DNA isolation and PCR
DNA isolation from liver and kidney tissues was performed using a GeneAll® ExgeneTM Tissue SV mini kit (Atlas Biotechnology, Turkey).
Amplification of the mitochondrial Cytochrome Oxidase-1 (mt-co1) and mitochondrial Cytochrome-b (mt-cyb) genes: For amplification of the mt-co1 gene (720 base pair), BatL5310 (forward) and R6036R (reverse) primers (Robins et al. Citation2007) were used, and L14727-SP (forward) and H15915-SP (reverse) primers were used for the mt-cyb gene (1100 bp) (Jaarola & Searle Citation2002). The 50-µL reaction mixture consisted of 0.5 µL of each primer (100 pmol), 1 µL dNTP (2 mM), 4 µL MgCl2 (2.0 mm), 5 µL buffer (10×), 0.25 µL Taq DNA polymerase (GeneAll, 5U) and 28.75 µL purified water. The PCR conditions (TECHNE TC-3000 Thermal Cycler) included an initial denaturation step at 94°C for 2 minutes followed by 35 cycles of the following steps: denaturation (30 sec at 94°C), primer annealing (30 sec at 49°C), extension (1 min at 72°C) and final extension (5 min at 72°C).
Amplification of the 12S rRNA Gene: L651 (forward) and 12GH (reverse) primers were used (Adkins et al. Citation2001) for amplification of the 12S rRNA gene (1000 bp). The 50-µL reaction mixture consisted of 0.5 µL of each primer (100 pmol), 1 µL dNTP (2 mM), 5 µL MgCl2 (2.5 mm), 5 µL buffer (10×), 0.25 µL Taq DNA polymerase (GeneAll, 5U) and 27.75 µL purified water. The PCR conditions (TECHNE TC-3000 Thermal Cycler) included an initial denaturation step at 94°C for 2 min followed by 35 cycles of the following steps: denaturation (30 sec at 94°C), primer annealing (30 sec at 60°C), extension (1 min at 72°C) and final extension (5 min at 72°C).
Amplified DNA samples were electrophoresed in 0.8% agarose gel for 1 hour at 70 V in 1×TAE, and the PCR bands were viewed with a SYNGENE Bio Imaging system.
Forward and reverse sequencing was performed by MEDSANTEK as a part of project 15L0430002 of the Scientific Research Projects Council of Ankara University.
Phylogenetic and genetic diversity analyses
Forward and reverse sequences were viewed with the program Chromas Lite 2.1.1 ( www.technelysium.com.au ) and aligned in Clustalx 2.0 (Larkin et al. Citation2007) and BIOEDIT 7.2.0 (Hall Citation1999). Nucleotide diversity, the number of polymorphisms, and haplotype number and diversity were calculated using the program DNASP 5.10.01 (Rozas et al. Citation2010). Dendrograms showing the phylogenetic relationships among species were constructed using haplotypes. The mean and net genetic distance values (d) and the nucleotide substitution matrix, maximum likelihood (ML), maximum parsimony (MP) and neighbour-joining (NJ) dendrograms were obtained using the program Mega 5.05 (Tamura et al. Citation2011), after determining the best substitution model for the data set. Genetic distance values were calculated based on the Kimura two-parameter (K2P) method (Kimura Citation1980) for all genes, and MP dendrograms were obtained using the “Close-Neighbour-Interchange on random trees” method. The nucleotide substitution matrix, ML and NJ dendrograms were constructed using bootstrap analysis with 1000 replicates as follows:
For the mt-co1 sequences: the Tamura-Nei (TN93) model (Tamura & Nei Citation1993) for the nucleotide substitution matrix, ML and NJ trees.
For the mt-cyb sequences: the Hasegawa, Kishino and Yano (HKY) model (Hasegawa et al. Citation1985) for the ML and nucleotide substitution matrix trees and the K2P method (Kimura Citation1980) for the NJ tree.
For the 12S rRNA sequences: the TN93 model (Tamura & Nei Citation1993) with a gamma (G) distribution for the ML and nucleotide substitution matrix trees and the Jukes and Cantor model (Jukes & Cantor Citation1969) for the NJ tree.
For the concatenated sequences: the HKY model (Hasegawa et al. Citation1985) with a G distribution for the ML and nucleotide substitution matrix trees and the p-distance model (Hamming Citation1950) for the NJ tree.
A Bayesian Markov chain Monte Carlo (Bayesian MCMC) approach was also implemented in the program BEAST 1.75 (Drummond & Rambaut Citation2007) based on the following:
The TN93 model (Tamura & Nei Citation1993) for the mt-co1 gene.
The HKY model (Hasegawa et al. Citation1985) for the mt-cyb gene.
The TN93 Parameter (Tamura & Nei Citation1993) with a G distribution for the 12S rRNA gene.
The HKY model (Hasegawa et al. Citation1985) with a G distribution for the concatenated sequences.
Three independent runs were performed for each 10,000,000 iterations, a total of 3000 burn-in data points were discarded, and the acquired dendrograms were visualised in the program FigTree 1.4 ( http://tree.bio.ed.ac.uk/software/figtree ). The accuracy of the Bayesian MCMC analyses was tested using the program Tracer 1.5 ( http://beast.bio.ed.ac.uk/Tracer ), and effective sample size (ESS) values were taken into consideration if they were 200 or higher. The evolutionary divergence times of the Guentheri Group species were calculated for each gene region according to the mammalian mtDNA divergence rate (2% per 1 my; Avise et al. Citation1998), and the Mus–Rattus split (11.7 Ma, Barome et al. Citation2001; Kennis et al. Citation2011) was used as a calibration point.
Results
Genetic diversity analyses
Genetic diversity values in the three markers and the concatenated sequences are shown in . In contrast to the findings from the 12S rRNA sequence, whose values were very low, the results from the mt-co1, mt-cyb and concatenated sequences were found to be similar. Additionally, the transition/transversion ratios (R) were 4.04 (mt-co1), 1.78 (mt-cyb), 1.52 (12S rRNA) and 2.53 (concatenated sequences). The nucleotide frequencies were as follows: A: 29.73%, T: 28.54%, C: 32.44%, G: 9.29% for the mt-co1 sequences; A: 30.43%, T: 27.63%, C: 27.77%, G: 14.17% for the mt-cyb sequences; and A: 37.66%, T: 24.99%, C: 20.15%, G: 17.20% for the 12S rRNA sequences. For the concatenated sequences, the nucleotide frequencies were A: 32.20%, T: 26.49%, C: 25.04% and G: 16.27%. A guanine deficiency appeared in our samples as is observed in other Microtus species and Arvicoline rodents.
Table I. Genetic diversity values of Guentheri Group voles based on COXI, cyt-b, 12S rRNA and concatenated gene sequences.
Genetic distance
Genetic distance values were calculated for each three-gene region and the concatenated sequences based on the K2P model, and these values were similar for the mt-co1, mt-cyb and concatenated sequences but considerably lower for 12S rRNA. Net and mean distance values are shown in and . According to these values, M. guentheri (southeastern Anatolia, SA) is more diverged than the Thrace and western Anatolia (WA) populations, although the divergence ratios were notably low between these two populations. K2P values were found to be lower than 10% in all groups: 7.3% SA–WA, 7.1% SA–Thrace and 1.3% Thrace–WA. The Thrace–WA value in particular remains within the limits of intraspecific variation.
Table II. Genetic distance (d) values (mean and net ± standard errors) between the western Anatolia, Thrace and southeastern Anatolia populations based on the COXI sequences. (Net distances are above the diagonal, and mean distances are below).
Table III. Genetic distance (d) values (mean or net ± standard error) between the western Anatolia, Thrace and Southeastern Anatolia populations based on the 12S rRNA sequences. (Net distances are above the diagonal, and mean distances are below).
Phylogenetic analyses
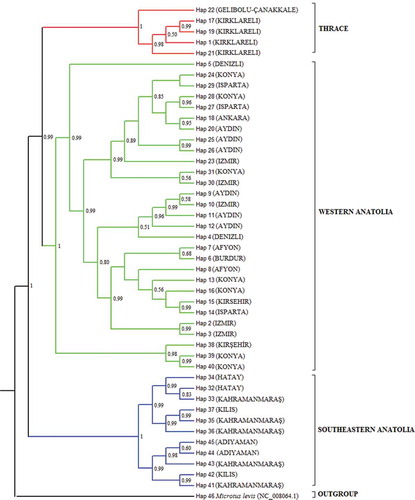
ML, MP, NJ and Bayesian MCMC dendrograms were constructed for each three-gene region and the concatenated sequences, and the results yielded approximately similar topologies. The MP and Bayesian MCMC dendrograms of the concatenated sequences are given in and . As seen in the MP tree, the Thrace and western Anatolia haplotypes clustered together, except for two haplotypes (percentage of bootstrap support: 56%), and the southeastern Anatolia haplotypes grouped under a different cluster than the Thrace and western Anatolia haplotypes (39%). Two western Anatolia haplotypes (Hap 39 and 40) clustered with the southeastern Anatolia haplotypes (94%), which supports the close relationships between the Guentheri Group species and might be considered a haplotypic homoplasy. In contrast to the MP tree, the Guentheri Group haplotypes were completely separate in the Bayesian MCMC tree (; percentage of bootstrap support: 78% for Thrace and western Anatolia and 94% for southeastern Anatolia and Thrace–western Anatolia).
Figure 2. Maximum parsimony tree from concatenated sequences. Numbers on branches are bootstrap support values (BS) above 50%.
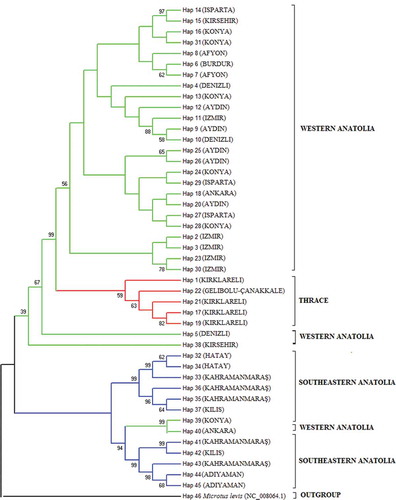
Figure 3. Bayesian Markov chain Monte Carlo (MCMC) tree from concatenated sequences. Numbers on branches are bootstrap support values (BS) above 50%.
Evolutionary divergence times
The potential evolutionary divergence times of the Guentheri Group species were determined by analysing the mt-co1, mt-cyb and 12S rRNA sequences based on the mammal mtDNA divergence ratio (2% per 1 my; Avise et al. Citation1998) and the Mus–Rattus split time of 11.7 Ma (Barome et al. Citation2001; Kennis et al. Citation2011), which was used as the calibration point.
The divergence time using the mt-co1 gene region indicated that the Thrace populations split from western Anatolia 1.62 Ma, and the southeastern Anatolia populations split from the Thrace and western Anatolia populations 2.14 Ma. The mt-cyb-based calculation showed that the Thrace populations diverged from western Anatolia 0.73 Ma, and the southeastern Anatolia populations split from these two groups 4.89 Ma. According to the 12S rRNA, the Thrace and western Anatolia populations diverged from each other 0.20 Ma, and the divergence time of the southeastern Anatolia populations was found to be 2.25 Ma. The low 12S rRNA values might be due to the high degree of preservation in this gene region because 12S rRNA is more useful for the taxonomic classification of higher taxa than for species and subspecies (Douzery & Catzeflis Citation1995; Ledje & Arnason Citation1996; Gatesy et al. Citation1997; Halanych & Robinson Citation1999; Wang et al. Citation2003). Considering that the Bosporus and Dardanelle Straits were closed until the Late Pliocene (approximately 2 Ma; Bacescu Citation1985; Tortonese Citation1985; Çağatay et al. Citation2000; Yaltırak et al. Citation2000), except for connections during glacial periods, the mt-co1-based divergence times seem more appropriate.
Discussion
Danford and Alston (Citation1880) described Microtus guentheri from Türkoğlu-Kahramanmaraş in southeastern Anatolia, and Barret-Hamilton (Citation1903) described Microtus hartingi from Larissa, Greece. Microtus lydius was first recorded from İzmir, which is located in western Anatolia, by Blackler (Citation1916).
Kryštufek et al. (Citation2009, Citation2012) performed taxonomic research on this group using a cytochrome-b marker and separated the Guentheri Group into two lineages: west (Macedonia, Greece, Turkish Thrace, and western and central Anatolia) and south (Syria and Israel). The west lineage was classified as Microtus hartingi, while the south lineage was considered to be Microtus guentheri. These authors also stated that Microtus dogramacii (Kefelioğlu & Kryštufek Citation1999), which is distributed in western Anatolia with 2n = 48 chromosomes, and Microtus guentheri are closely related species. Similarly, Thanou et al. (Citation2012) considered the Greece, Turkish Thrace and western Anatolia populations to be Microtus hartingi and the Syria and Israel populations to be Microtus guentheri based on the cytochrome-b gene.
Yiğit et al. (Citation2012) examined features of the fur, skull and baculum and suggested that the Bulgaria and Turkish Thrace populations be classified as Microtus hartingi according to the priority rule, and they named the western Anatolia populations Microtus lydius as a valid taxon. Zima et al. (Citation2013) described the Turkish Trace and Greece populations as Microtus hartingi and the western and eastern Anatolia populations as Microtus guentheri, according to chromosomal banding. Markov et al. (Citation2014) found that Microtus lydius and Microtus lydius ankaraensis were highly similar and that Microtus guentheri is closer to these subspecies than to the European populations, both morphologically and statistically.
In our findings using sequence data, the guanine frequencies in the three populations are consistent with those of Jaarola and Searle (Citation2002); Jaarola et al. (Citation2004); Kryštufek et al. (Citation2009); Kryštufek et al. (Citation2012). Transition/transversion ratios (R) were found to be 4.04 (mt-co1), 1.78 (mt-cyb), 1.52 (12S rRNA) and 2.53 (concatenated sequences). Tryfonopoulos et al. (Citation2008) found R values of 3.8 and 4.1 for mt-cyb and 12S rRNA, respectively; Kryštufek et al. (Citation2012) found 4.5 for mt-cyb; and Thanou et al. (Citation2012) found 2.5 for mt-cyb. These values for the mt-cyb gene and 12S rRNA are consistent with the results of the present study. According to all of these results, R values are higher in the mt-co1 sequences than in the mt-cyb and 12S rRNA sequences, which could indicate that the mt-co1 gene accumulates greater transition. On the other hand, lower mt-cyb and 12S rRNA R values showed high transversion accumulation, and transversion events have been used to establish deeper phylogenetic relationships because transversion accumulation is slow (Lockhart et al. Citation1995; Randi & Lucchini Citation1998; Kimball et al. Citation1999; Randi et al. Citation2001). Therefore, the mt-co1 gene may be more useful for studying recently diverged species, such as those of the Guentheri Group.
Additionally, nucleotide diversity values were found to be high in the southeastern and western Anatolia populations, and quite low in the Thrace populations, for all three genes and the concatenated sequences. In this case, it is possible that the Thrace populations originated from Anatolia and have lower nucleotide diversity because they are border populations.
Genetic distance (d) matrices revealed that the southeastern Anatolia populations differed greatly from the other Guentheri Group species in the western Anatolia and Thrace populations. On the other hand, the Thrace and western Anatolia haplotypes clustered closely in the MP dendrogram, and, consistent with this result, the Bayesian MCMC dendrogram clearly separated three lineages with high probability values. Our findings support the assumption presented above that the Thrace and western Anatolia populations are the same taxon. Anatolia is known as a centre of speciation (Nevo et al. Citation1994), and the Anatolian diagonal is an effective geographical barrier that separates southeastern Anatolia from western Anatolia and Thrace and prevents the dispersal of animal species (Yiğit et al. Citation2002; Veith et al. Citation2003).
According to our data, M. guentheri is a phylogenetically distinct group, and its genetic distance (d) values are higher than in other groups, supporting the hypothesis that the Anatolian diagonal prevents westwardly and southwardly gene flow between M. guentheri and M. hartingi as indicated by Yiğit et al. (Citation2002) and Kryštufek et al. (Citation2009). Some of the western Anatolian haplotypes located in the M. guentheri lineage might have resulted from close relationships or haplotype homoplasy between Guentheri Group species. Additionally, this phylogenetic proximity is supported by the recent divergence of Microtus species (0.5–3.5 Ma) (Lemskaya et al. Citation2010) and the ongoing speciation process in this genus (Jaarola et al. Citation2004; Tryfonopoulos et al. Citation2008).
Because most Microtus species are distributed in Anatolia, Iran and the Caucasus (Shenbrot & Krasnov Citation2005; Aulagnier Citation2009) and southwest Asia, this region has been thought of as a speciation centre for Microtus species. The ML and Bayesian MCMC dendrogram results supported the idea that the western Anatolia population is a basal group, and nucleotide diversity is highest in the eastern populations. Considering that the Messinian Salinity Crisis occurred in the Late Miocene Period (16.8–5.1 Ma), which resulted in increasingly open habitats (Strömberg et al. Citation2007), it is likely that Guentheri Group voles originating from southwest Asia first reached the eastern parts of Central Anatolia and then spread westward and southward due to the drying of the Paratethys Ocean. The divergence time of M. guentheri (4.89–2.14 Ma) found in the present study supports this hypothesis.
The Dardanelle and Bosporus Straits opened in the Late Pliocene (2 Ma) (Bacescu Citation1985; Tortonese Citation1985; Çağatay et al. Citation2000; Yaltırak et al. Citation2000), and some authors suggested that these straits prevent gene flow between the Thrace and western Anatolia populations so that they have become different species (Thanou et al. Citation2012; Yiğit et al. Citation2012). Our mt-co1 and mt-cyb data revealed the divergence time of the Thrace and western Anatolia populations to be approximately 1.62 and 0.73 Ma, respectively, and this finding is consistent with those of the above authors. However, genetic distance values are rather low between these populations even though they are clearly separated in the Bayesian MCMC tree. Therefore, the western Anatolia population appears to be a basal population from which both the southeastern population (M. guentheri) and the Thrace population (M. hartingi) originated. Genetic differences between the Thrace and western Anatolia populations are thought to be insufficient to classify these populations as separate species, which is why the Thrace and western Anatolia populations were considered Microtus hartingi by Kryštufek et al. (Citation2009, Citation2012) and Thanou et al. (Citation2012).
Supporting these suggestions, K2P values were found to be lower than 10% in all groups. Li et al. (Citation2015) stated that K2P values are 2.86% in interspecific, 11.80% in intraspecific and 16.78% in subfamilies in Arvicolinae rodents; they also reported that these values are sometimes very low (0.31–7.35%) in some rodent genera.
In our opinion, the Thrace population should be classified as Microtus hartingi hartingi, but the population of western Anatolia is hard to classify as Microtus hartingi (previously termed M. lydius by Yiğit et al. Citation2012). Consistent with this idea, the K2P value is only 11.1% between M. guentheri and Microtus levis which are morphologically very distinct species, and also 7.1% between M. guentheri and M. hartingi (from Thrace). Also, the Dardanelle and Bosporus straits are thought to cause the speciations of many fossorial and surface-dwelling rodent species, in contrast to arboreal ones. The Thrace and western Anatolia populations may separate into new species due to the presence of the Dardanelle and Bosporus straits despite the low K2P values in the groups.
Acknowledgements
This study was produced from Derya Çetintürk’s master’s thesis. This work supported by Ankara University Scientific Research Projects Coordination Unit (Project no: 15L0430002).
Additional information
Funding
References
- Adkins RM , Gelke EL , Rowe D , Honeycutt RL. 2001. Molecular phylogeny and divergence time estimates for major rodent groups: evidence from multiple genes. Molecular Biology and Evolution 18(5):777–791.
- Aulagnier S. 2009. Mammals of Europe, North Africa and the Middle East. London: A&C Black.
- Avise JC , Walker D , Johns GC. 1998. Speciation durations and Pleistocene effects on vertebrate phylogeography. Proceedings of the Royal Society B: Biological Sciences 265:1707–1712. DOI:10.1098/rspb.1998.0492.
- Bacescu M . 1985. The effects of the geological and physicochemical factors on the distribution of marine plants and animals in the Mediterranean. Mediterranean Marine Ecosystems NATO Conference Series 8:195–212.
- Barome PO , Volobouev V , Monnerot M , Mfune JK , Chitaukali W , Gautun JC , Denys C . 2001. Phylogeny of Acomys spinosissimus (Rodentia, Muridae) from north Malawi and Tanzania: Evidence from morphological and molecular analysis. Biological Journal of the Linnean Society 73:321–340. DOI:10.1111/j.1095-8312.2001.tb01366.x.
- Barret-Hamilton GEH . 1903. On the new voles of the subgenera Pitymys and Microtus . Annals and Magazine of Natural History 11:306–308. DOI:10.1080/00222930308678773.
- Blackler WFG . 1916. Microtus lydius . Annals and Magazine of Natural History 7:426–427. DOI:10.1080/00222931608693808.
- Çağatay MN , Görür N , Algan O , Eastoe C , Tchapalyga A , Ongan D , Kuhn T , Kuşçu I . 2000. Late Glasial-Holocene palaeoceanography of the Sea of Marmara: Timing of connections with the Mediterranean and the Black Seas. Marine Geology, Elsevier 167:191–206. DOI:10.1016/S0025-3227(00)00031-1.
- Danford CG , Alston RE . 1880. On the mammals of Asia Minor. Part II. Proceedings of the Zoological Society of London. pp. 50–64.
- Douzery E , Catzeflis FM . 1995. Molecular evolution of the mitochondrial 12S rRNA in Ungulata (Mammalia). Journal of Molecular Evolution 41:622–636. DOI:10.1007/BF00175821.
- Drummond AJ , Rambaut A . 2007. BEAST: Bayesian Evolutionary Analysis by Sampling Trees. BMC Evolutionary Biology 7:214. DOI:10.1186/1471-2148-7-214.
- Ellerman JR . 1941. The families and genera of living rodents. Vol. II. London: Family Muridae, British Museum (Natural History). pp. 690.
- Ellerman JR , Morrison-Scott TCS . 1951. Checklist of Palaearctic and Indian mammals 1758 to 1946. London: Order of the Trustees of the British Museum.
- Gatesy J , Amato G , Vrba E , Schaller G , DeSalle R . 1997. A cladistic analysis of mitochondrial ribosomal DNA from the Bovidae. Molecular Phylogenetics and Evolution 7:303–319. DOI:10.1006/mpev.1997.0402.
- Golenishchev FN , Sablina OV , Borodin PV , Gerasimov S . 2002. Taxonomy of voles of subgenus Sumeriomys Argyropulo, 1933 (Rodentia, Arvicolinae, Microtus). Russian Journal of Theriology 1:43–55.
- Halanych KM , Robinson TJ . 1999. Multiple substitutions affect the phylogenetic utility of Cytochrome b and 12S rDNA data: Examining a rapid radiation in leporid (Lagomorpha) evolution. Journal of Molecular Evolution 48:369–379. DOI:10.1007/PL00006481.
- Hall TA . 1999. BioEdit: A user-friendly biological sequence alignment editor and analysis program for Windows 95/98/NT. Nucleic Acids Symposium Series 41:95–98.
- Hamming RW . 1950. Error detecting and error correcting codes. Bell Labs Technical Journal 29:147–160. DOI:10.1002/j.1538-7305.1950.tb00463.x.
- Harrison DLB . 1991. Mammals of Arabia. 2nd ed. Sevenoaks, UK: Harrisson Zoological Museum.
- Hasegawa M , Kishino H , Yano T-A . 1985. Dating of the human-ape splitting by a molecular clock of mitochondrial DNA. Journal of Molecular Evolution 22:160–174. DOI:10.1007/BF02101694.
- Jaarola M , Martinkova N , Gündüz İ , Brunhoff C , Zima J , Nadachowski A , Amori G , Bulatova NS , Chondropoulos B , Fraguedakis-Tsolis S , Gonzalez-Esteban J , Lopez-Fustewr MJ , Kandaurov AS , Kefelioğlu H , Luz Mathias M , Villate I , Searle JB . 2004. Molecular phylogeny of the speciose vole genus Microtus (Arvicolinae, Rodentia) inferred from mitochondrial DNA sequences. Molecular Phylogenetics and Evolution 33:647–663. DOI:10.1016/j.ympev.2004.07.015.
- Jaarola M , Searle JB . 2002. Phylogeography of field voles (Microtus agrestis) in Eurasia inferred from mitochondrial DNA sequences. Molecular Ecology 11:2613–2621. DOI:10.1046/j.1365-294X.2002.01639.x.
- Jukes TH , Cantor CR . 1969. Evolution of protein molecules. Mammalian Protein Metabolism 3:132.
- Kefelioğlu H , Kryštufek B . 1999. The taxonomy of Microtus socialis group (Rodentia: Microtinae) in Turkey, with the description of a new species. Journal of Natural History 33:289–303. DOI:10.1080/002229399300425.
- Kennis J , Nicolas V , Hulselmans J , Katuala PG , Wendelen W , Verheyen E , Dudu AM , Leirs H . 2011. The impact of the Congo River and its tributaries on the rodent genus Praomys: Speciation origin or range expansion limit? Zoological Journal of the Linnean Society 163:983–1002. DOI:10.1111/j.1096-3642.2011.00733.x.
- Kimball RT , Braun EL , Zwartjes PW , Crowe TM , Ligon JD . 1999. A molecular phylogeny of the pheasants and partridges suggests these lineages are polyphyletic. Journal of Molecular Evolution 11:38–54. DOI:10.1006/mpev.1998.0562.
- Kimura M . 1980. A simple method for estimating evolutionary rates of base substitutions through comparative studies of nucleotide sequences. Journal of Molecular Evolution 16:111–120. DOI:10.1007/BF01731581.
- Kryštufek B , Buzan EV , Vohralík V , Zareıe V , Özkan B . 2009. Mitochondrial Cytochrome b sequence yields new insight into the speciation of social voles in South-west Asia. Biological Journal of the Linnean Society 98:121–128. DOI:10.1111/j.1095-8312.2009.01248.x.
- Kryštufek B , Vohralík V . 2009. Mammals of Turkey and Cyprus. Rodentia II: Cricetinae, Muridae, Spalacidae, Calomyscidae, Capromyidae, Hystricidae, Castoridae. Koper: Založba Annales. pp. 372.
- Kryštufek B , Zorenko T , Buzan EV . 2012. New insights into the taxonomy and phylogeny of social voles inferred from mitochondrial Cytochrome b sequences. Mammalian Biology 77:178–182. DOI:10.1016/j.mambio.2011.11.007.
- Larkin MA , Blackshields G , Brown NP , Chenna R , McGettigan PA , McWilliam H , Valentin F , Wallace IM , Wilm A , Lopez A , Thompson JD , Gibson TJ , Higgins DG . 2007. Clustal W and Clustal X version 2.0. Bioinformatics 23:2947–2948. DOI:10.1093/bioinformatics/btm404.
- Ledje C , Arnason U . 1996. Phylogenetic relationships within caniform carnivores based on analyses of the mitochondrial 12S rRNA gene. Journal of Molecular Evolution 43:641–649. DOI:10.1007/BF02202112.
- Lemskaya N , Romanenko S , Golenishchev F , Rubtsova N , Sablina O , Serdukova N , O’Brien PM , Fu B , Yiğit N , Ferguson-Smith M , Yang F , Graphodatsky A . 2010. Chromosomal evolution of Arvicolinae Rodentia). III. Karyotype relationships of ten Microtus species. Chromosome Research 18:459–471. DOI:10.1007/s10577-010-9124-0.
- Li J , Zheng X , Cai Y , Zhang X , Yang M , Yue B . 2015. DNA barcoding of Murinae (Rodentia: Muridae) and Arvicolinae (Rodentia: Cricetidae) distributed in China. Molecular Ecology Resources 15:153–167. DOI:10.1111/1755-0998.12279.
- Lockhart PJ , Penny D , Meyer A . 1995. Testing the phylogeny of swordtail fishes using split decomposition and spectral analysis. Journal of Molecular Evolution 41:666–674. DOI:10.1007/BF00175825.
- Markov G , Yiğit N , Çolak E , Kocheva M , Gospodinova M . 2014. Epigenetic diversity and similarity of the voles of “Guentheri” Group (Mammalia: Rodentia) in Anatolian Peninsula and South-Eastern Part of the Balkan Peninsula. Acta Zoologica Bulgarica 66:159–164.
- Musser GG , Carleton MD . 2005. Family Muridae. In: Wilson DE , Reeder DM , editors. Mammal Species of the World: A Taxonomic and Geographic Reference. 2nd ed. Washington, DC, and London: Smithsonian Institution Press. pp. 501–755.
- Musser GG , Carleton MD . 2005. Superfamily Muroidae. In: Wilson DE , Reeder DAM , editors. Mammal species of the World: A taxonomic and geographic reference.Vol. 3. 894–1531.
- Nevo E , Filippucci MG , Redi C , Korol A , Beiles A . 1994. Chromosomal speciation and adaptive radiation of mole rats in Asia Minor correlated with increased ecological stress. Proceedings of the National Academy of Sciences 91:8160–8164. DOI:10.1073/pnas.91.17.8160.
- Niethammer J , Krapp F . 1982. Handbuch der Säugetiere Europas. Vol. 2/1. Wiesbaden: Akademische Verlagsgesellschaft. pp. 649
- Randi E , Lucchini V . 1998. Organization and evolution of the mitochondrial DNA control region in the avian genus Alectoris . Journal of Molecular Evolution 47:449–462. DOI:10.1007/PL00006402.
- Randi E , Lucchini V , Hennache A , Kimball RT , Braun EL , Ligon JD . 2001. Evolution of the Mitochondrial DNA Control Region and Cytochrome b Genes and the inference of phylogenetic relationships in the Avian Genus Lophura (Galliformes). Molecular Phylogenetics and Evolution 19:187–201. DOI:10.1006/mpev.2001.0922.
- Robins JH , Hingston M , Matisoo-Smith E , Ross HA . 2007. Identifying Rattus species using mitochondrial DNA. Molecular Ecology Notes 7:717–729. DOI:10.1111/men.2007.7.issue-5.
- Rozas J , Librado P , Sánchez-Del Barrio JC , Messeguer X , Rozas R . 2010. DnaSP version 5 help contents [Help File]. Available: http://www.ub.edu/dnasp/ . Accessed Jan 2017 30.
- Shenbrot GI , Krasnov BR . 2005. Atlas of the geographic distribution of the Arvicoline rodents of the world (Rodentia, Muridae: Arvicolinae). Sofia & Moscow: Pensoft Publishers. pp. 336.
- Strömberg CA , Werdelin L , Friis EM , Saraç G . 2007. The spread of grass-dominated habitats in Turkey and surrounding areas during the Cenozoic: Phytolith evidence. Palaeogeography, Palaeoclimatology, Palaeoecology 250:18–49. DOI:10.1016/j.palaeo.2007.02.012.
- Tamura K , Nei M . 1993. Estimation of the number of nucleotide substitutions in the control region of mitochondrial DNA in humans and chimpanzees. Molecular Biology and Evolution 10:512–526.
- Tamura K , Peterson D , Peterson N , Stecher G , Nei M , Kumar S . 2011. MEGA5: Molecular evolutionary genetics analysis using maximum likelihood, evolutionary distance, and maximum parsimony methods. Molecular Biology and Evolution 28:2731–2739. DOI:10.1093/molbev/msr121.
- Thanou E , Tryfonopoulos G , Chondropoulos B , Fraguedakis-Tsolis S . 2012. Comparative phylogeography of the five Greek vole species infers the existence of multiple South Balkan subrefugia. Italian Journal of Zoology 79:363–376. DOI:10.1080/11250003.2011.651163.
- Tortonese E . 1985. Distribution and ecology of endemic elements in the Mediterranean fauna (fishes and echinoderms). Mediterranean Marine Ecosystems NATO Conference Series 8:57–83.
- Tryfonopoulos G , Thanou E , Chondropoulos B , Fraguedakıs‐Tsolıs S . 2008. mtDNA analysis reveals the ongoing speciation on Greek populations of Microtus (Terricola) thomasi (Arvicolidae, Rodentia). Biological Journal of the Linnean Society 95:117–130. DOI:10.1111/j.1095-8312.2008.01025.x.
- Veith M , Schmidtler JF , Kosuch J , Baran I , Seitz A . 2003. Palaeoclimatic changes explain Anatolian mountain frog evolution: A test for alternating vicariance and dispersal events. Molecular Ecology 12:185–199. DOI:10.1046/j.1365-294X.2003.01714.x.
- Wang CH , Kuo CH , Mok HK , Lee SC . 2003. Molecular phylogeny of elopomorph fishes inferred from mitochondrial 12S ribosomal RNA sequences. Zoologica Scripta 32:231–241. DOI:10.1046/j.1463-6409.2003.00114.x.
- Wilson DE , Reeder DM . 2005 .Mammal species of the world. A taxonomic and geographic reference. 3rd ed. Baltimore: John Hopkins University Press.
- Yaltırak C , Sakinç M , Oktay FY . 2000. Westward propagation of North Anatolian fault into the northern Aegean: Timing and kinematics. Comment and Reply. Geology 28:187–188. DOI:10.1130/0091-7613(2000)28<187:WPONAF>2.0.CO;2.
- Yiğit N , Çolak E . 2002. On the distribution and taxonomic status of Microtus guentheri (Danford and Alston, 1880) and Microtus lydius Blackler, 1916 (Mammalia: Rodentia) in Turkey. Turkish Journal of Zoology 26:197–204.
- Yiğit N , Çolak E , Sözen M , Özkurt S . 2002. A study of the geographical distribution along with habitat aspects of rodent species in Turkey. Bonner Zoologische Beitrage 50:355–368.
- Yiğit N , Markov G , Çolak E , Kocheva M , Saygılı F , Yüce D , Çam P . 2012. Phenotypic features of the ‘Guentheri’ Group Vole (Mammalia: Rodentia) in Turkey and Southeast Bulgaria: Evidence for its taxonomic detachment. Acta Zoologica Bulgarica 64:23–32.
- Zima J , Arslan A , Benda P , Macholán M , Kryštufek B . 2013. Chromosomal variation in social voles: A Robertsonian fusion in Günther’s vole. Acta Theriologica 58:255–265. DOI:10.1007/s13364-012-0113-x.