
Abstract
The numerical increase of roe deer has resulted in a noticeable growth of hunting activities allowing to have a great availability of biometrical data from both the hunted samples and the population by describing trends and variations and, then, optimize the consequent wildlife management decisions. Specifically, we analyzed biometric data of a roe deer (Capreolus capreolus) population at the Macerata Province, in central Italy. We focused on two animal groups: fawns (<11 months old) and adults (>2 years old). We assessed the relationship between body parameters and trophic resources available during the autumn-winter period. In particular, we analyzed live weight, head–trunk length, height at shoulders, chest circumference, length of hock, total length of the cranium, condilo-basal length, mastoid width, zygomatic width, ectorbital width, entorbital width, teeth row length and mandible length. In the context of studying trophic resources, we identified three environmental categories based on their carrying capacity and then assigned a specific environmental category to each sample. Statistical analysis was performed. In fawn, only zygomatic width showed significant differences both between sexes and among the environmental categories. In adult, the analysis showed significant differences between sexes for live weight, head–trunk length, length of hock and zygomatic width, with the highest values for males. Among environmental categories, the analysis showed significant differences for live weight, head–trunk length, length of hock chest circumference, length of hock, ectorbital width and teeth row length. This approach, applied to a broader database could be useful to identify suitable parameters to be used in planning the optimum selective hunting of roe deer.
Introduction
The roe deer (Capreolus capreolus, Linnaeus 1758) is one of the most common wild ungulates in Italy (Pedrotti Citation2001; Apollonio Citation2004; Perco Citation2011) and has been a protected species since the 1979 Bern Convention. In the past it was distributed throughout Italy but, starting in the 16th century, the population began to decrease drastically until it reached a critical point in the 19th century (Mattioli et al. Citation2009; Perco Citation2011). Populations increased since the 60s due to land abandonment. So, they expended their territory and inhabit a wider range of habitats, including also areas closer to people (Varuzza Citation2005). This has been the cause of numerous road accidents and significant crop damage, particularly in hilly zones. Increased density and its consequences require selective hunting to keep the population in balance, but often in the decision process authorities have overlooked the roe deer’s biological features, particularly its feeding habits.
Roe deer is quite demanding in terms of the optimal habitat (Aulak & Babińska-Werka Citation1990a), preferring complex and diversified woodlands characterized by good development of ecotone areas (Perco Citation2011). They thrive in landscapes with a mix of forest and agricultural land (Aulak & Babińska-Werka Citation1990b; Linnell & Andersen Citation1998) including high amounts of ecotonal habitats (Tufto et al. Citation1996).
Roe deer diet is also related to the morpho-physiological characteristics of its digestive apparatus that allow to classify it as Concentrated Selector into the three feeding types of Ruminants identified by Hofmann (Citation1989). This species, as the other Concentrated Selectors, choose plant species or their parts with high protein content and easily digestible nutrients, such as sprouts, buds, young leaves, grasses (preferably dicots), fruits and seed, provided that their fiber content is limited (Hofmann Citation1989; Duncan et al. Citation1998). Nevertheless, it can eat and digest a wide variety of plants including fungi, lichens, mosses, ferns, coniferous and deciduous tree leaves, shrubs, forbs, cultivated plants (Duncan et al. Citation1998), in relation to the available habitat types (Abbas et al. Citation2011).
The most critical period for roe deer feeding is the autumn-winter period, when its selected food is scarce (due to the plant vegetative stasis) and often covered by snow (Vitanzi et al. Citation2010). Currently, decisions about roe deer management are based on the annual trophic availability of the ecosystems, failing to take into account the critical autumn-winter period.
The collaboration of hunters in the measurement of the body parameters of their catch, and the use of these data for biometric analysis are useful tools to evaluate population features (Hewison et al. Citation1996; Morellet et al. Citation2007; Becciolini et al. Citation2016). To formulate better wildlife management practices, it is very important to incorporate biometrics in structured databases and to analyze the collected information related to the autumn-winter food availability. According to Klein (Citation1964), individuals differ in size because of genetics and nutrition. More recently, it was demonstrated that cranial and dental morphology could be correlated to dietary behavior (Janis Citation1995; Mendoza et al. Citation2002) or feeding group (Janis Citation1990), allowing to hypothesize that the nutrition affects the size/shape of body structures. So, study of the relationship between body parameters and food availability can be a useful tool in planning the selective hunting of roe deer.
In this research, we collected and analyzed biometric data of animals pertaining to two groups (fawns <11 months, adults >2 years), in population of roe deer in the Macerata Province, to evaluate the relationship between size of body/cranial parameters and trophic resources available during the critical autumn-winter period in the central Italy Apennines, in order to contribute to planning a more appropriate roe deer selective hunting.
Materials and methods
Study area
The study was carried out using animals killed within the selective hunting activities in the ATC-MC2 Territorial Hunting Zone in Macerata Province (central Italy). The ATC-MC2 covers 163,344 ha and has an irregular border naturally delimited, to the east by the Adriatic Sea, to the north by the Potenza river, to the west by the Umbria-Marche Apennines and to the south by the Chienti River and the Ete Morto and Salino streams. The ATCs are the main institutions of wildlife hunting management (State Law n. 157/92) and they are responsible for implementing hunting plans that harmonize the principles of fauna conservation with the interests of such stakeholders as farmers, hunters and other citizens. For the fauna management of the roe deer, each ATC divides its territory into sub-zones called “Management Districts” (MDs) with easily identifiable boundaries that coincide with natural, physical, administrative limits, roads, etc. In turn, each MD is divided into a variable number of “Management Units” (MUs). The ATC-MC2 (the study area) is divided into 6 MDs and many MUs based on the density of the roe deer population, as estimated by census.
Body and cranial parameters
For the analysis of roe deer body and cranial parameters, we used data collected from 203 animals killed in the last 5 hunting seasons (2012–2017). Of these, 56 were fawns (28 males and 28 females) and 147 were adults (57 males and 90 females). Data were collected according to the procedure indicated by the “Istituto Superiore per la Protezione e la Ricerca Ambientale” [Institute for Environmental Protection and Research] (ISPRA) (Mattioli et al. Citation2009). The following body and cranial parameter measurements were taken by hunters during the selective hunting period: live weight (LW), head–trunk length (HTL), height at shoulders (HS), chest circumference (CC), length of hock (HL), total length of the cranium (TL), condilo-basal length (CBL), mastoid width (MW), zygomatic width (ZW), ectorbital width (ECW), entorbital width (ENW), length of the teeth row (TRL), and mandible length (ML), as indicated in .
Figure 1. Reference point for body (a) and cranial (b) parameters collected from fawns adults taken by hunters: live weight (LW), head–trunk length (HTL), height at shoulders (HS), chest circumference (CC), length of hock (HL), total length of the cranium (TL), condilo-basal length (CBL), mastoid width (MW), zygomatic width (ZW), ectorbital width (ECW), entorbital width (ENW), length of the teeth row (TRL), mandible length (ML)
Environmental categories
To evaluate the relationship between size of body/cranial parameters and the trophic resources available in the autumn-winter period, we associated each animal with an environmental category based on the carrying capacity of the MU where it was killed, for fawns, and on the carrying capacity of the MD where it was killed, for adults.
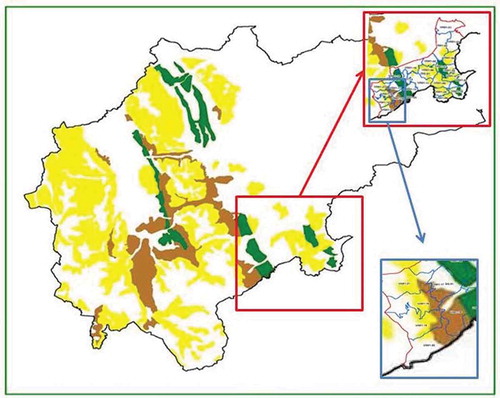
The choice of the two different zonations is due to the different home-range of fawn or adult animals. In fact, fawns move inside limited areas (Panzacchi et al. Citation2010) and MU are generally bordered by physical limits that they are unable to pass (hedges, ditches, etc.). Instead, adults move inside a wide area, likely represented by MD, varying in relation to resource abundance and season (Kjellander et al. Citation2004; Panzacchi et al. Citation2009; Morellet et al. Citation2013). Each MU and MD was assigned a carrying capacity value by overlapping two maps: the map with MD/MU territories and a map of the carrying capacity for roe deer (Vitanzi et al. Citation2010). In the latter study the author assessed the carrying capacity of each forest plant community dividing the edible phytomass amount per surface unit (kg/ha), composed of buds, leaves, and herbs of each forest ecosystem, and collected inside sampling areas between early December to late February by the nutritional demand of edible phytomass during the vegetative stasis (kg). The afore-mentioned map shows four colors that correspond to precise values of animals per hectare: 0 animals/hectare (white); 0.02 animals/hectare (yellow); 0.06 animals/hectare (brown); 0.20 animals/hectare (green).
Since the MDs and MUs generally overlapped with patches including more than one environmental category (), we weighted the carrying capacity on the extension of each environmental category (e.g. territory with prevalence of brown and yellow in the same proportions = 0.04 animals per hectare). The resulting values were grouped into three environmental categories:
Figure 2. Map of the carrying capacity for roe deer (green box), with an example of a Management District of the ATC-MC2 (red box) and of Management Units within a Management District (blue box). The colors in the map indicate the carrying capacity for roe deer: 0 animals/hectare (white); 0.02 animals/hectare (yellow); 0.06 animals/hectare (brown); 0.20 animals/hectare (green)
1= 0-0.02 animals/hectare, with lower food availability;
2= 0.03-0.1 animals/hectare, with intermediate food availability;
3= 0.11-0.13 animals/hectare, with higher food availability.
Statistical Analysis
The statistical approach involved the use of generalized linear models, in which the response variables were the cranial and body parameters for the two animal groups, while the predictors were the two-level categorical variable “sex”, the three-level ordered factor “environmental category” and their interaction term. The procedure for selecting the best fitting model for each response variable was based on an Akaike information criterion (AIC). The data were strongly unbalanced among the categories and the response variables did not meet the assumptions required for parametric tests; thus, for each variable included in the best model and their interaction, if any, we used a rank-based estimate of regression coefficients and the Wald test to assess their significance. We corrected significance values (p) for multiple testing using the Holm correction.
We performed all the analyses using R software (version 3.4.1, R Foundation for Statistical Computing, Vienna, Austria. http://www.R-project.org). Model selection was performed using the glmulti package, version 1.0.7 and the glmulti function. Corrections of p values for multiple testing were done through the p.adjust function (stats package). Rank-based fits were run using the rfit function and the Wald test, available as default option in the summary function (Rfit package, version 0.23.0) (Kloke & McKean Citation2012, Citation2014). The detailed procedure used and the detailed results are shown in .
Results
Body and cranial parameters for fawns are summarized in and and in and . No significant differences between sexes emerged on body and cranial parameters (), while HL, ZW, CBL, and TL showed significant variations among environmental categories (), as indicated in , being the one with the highest parameter values, characterized by the highest food availability (environmental category 3). However, only for HL and ZW there are a clear size increase among the three environmental categories.
Table I. Body and cranial measurements (mean ± standard deviation) of roe deer pertaining to age classes 0 and 2 per sex (F – female; M – male). Significance values (p) for the variable “sex” are indicated when this variable was included in the best model, following an AIC-based model selection procedure. p-values are adjusted using the Holm correction for multiple testing
Table II. Body and cranial measurements (mean ± standard deviation) of roe deer pertaining to age class 0 (fawns) per environmental category (1 = 0–0.02 animals/hectare, with lower food availability; 2 = 0.03–0.1 animals/hectare, with intermediate food availability; 3 = 0.11–0.13 animals/hectare, with higher food availability). Significance values (p) for the ordered factor “environmental category” are indicated when this variable was included in the best model, following an AIC-based model selection procedure. p values are adjusted using the Holm correction for multiple testing
Figure 3. Box-plot diagrams of body parameters (based on observed values) of fawns divided by sex (m – male; f – female) within environmental categories (1–3)
Figure 4. Box-plot diagrams of cranial parameters (based on observed values) of fawns divided by sex (m – male; f – female) within environmental categories (1–3)
Figure 5. Reference point for body (a) and cranial (b) parameters collected from fawns. With the asterisk are evidenced the significantly different parameters among environmental categories: length of hock (HL), total length of the cranium (TL), condilo-basal length (CBL), zygomatic width (ZW)

Body and cranial parameters for adults are summarized in and and in and . There were significant differences between sexes for the body parameters of LW, HTL, and HL (), while the cranial parameters differed significantly only for ZW, as indicated in ; males had always higher mean parameter sizes than females. The comparison between environmental categories showed significant differences in the body parameters LW, HTL, CC, and HL, while for cranial parameters there were significant differences in ECW and TRL (); parameter sizes of the samples in environmental category 2 were higher than in those of environmental category 1 ones.
Table III. Body and cranial measurements (mean ± standard deviation) of Roe deer pertaining to age class 2 (adults) per environmental category (1 = 0–0.02 animals/hectare, with lower food availability; 2 = 0.03–0.1 animals/hectare, with intermediate food availability). Significance values (p) for the ordered factor “environmental category” are indicated when this variable was included in the best model, following an AIC-based model selection procedure. p-values are adjusted using the Holm correction for multiple testing
Figure 6. Box-plot diagrams of body parameters (based on observed values) of adults divided by sex (m – male; f – female) within environmental categories (1–2)
Figure 7. Box-plot diagrams of cranial parameters (based on observed values) of adults divided by sex (m – male; f – female) within environmental categories (1–2)
Figure 8. Reference point for body (a) and cranial (b) parameters collected from adults. With the asterisk are evidenced the significantly different parameters between sexes: live weight (LW), head–trunk length (HTL), length of hock (HL), zygomatic width (ZW)

Figure 9. Reference point for body (a) and cranial (b) parameters collected from adults. With the asterisk are evidenced the significantly different parameters between environmental categories: live weight (LW), head–trunk length (HTL), chest circumference (CC), length of hock (HL), ectorbital width (ECW), length of the teeth row (TRL)
No significant interaction was found between sex and environmental category; thus, the environmental category did not exert a significantly different effect on the measured parameters in male and female individuals.
Discussion
Authorities responsible for managing roe deer populations and setting hunting guidelines, generally base their decisions on the annual trophic availability of the ecosystems. Doing so, almost always they fail to take into account the autumn-winter period, when the snow often covers remaining vegetation, whose availability (in addition to the duration of the vegetative stasis period) is one of the main elements for the assessment of habitat quality (Vitanzi et al. Citation2010). For example, in the reports about the annual management plans of roe deer, provided by the ATC-MC2, for two sample MD, there were estimated a density (based on annual trophic availability) of 0.075 and 0.16 animals/hectare, to which corresponded a carrying capacity (based on autumn-winter trophic availability) of 0.06 and 0.02 animals/hectare, respectively (Scocco et al. Citation2013).
As expected, our results showed that in fawns there was no significant difference between sexes for body and cranial parameters. This result is probably linked to the fact that the definitive body size is reached in the higher age classes (Pelliccioni et al. Citation2004); indeed, there is a low sexual dimorphism in the roe deer. As far as the cranial and body parameters among environmental categories are concerned, significant differences were observed for length of hock (HL), zygomatic width (ZW), condilo-basal length (CBL) and total length of the cranium (TL). In particular, for both length of hock (HL) and zygomatic width (ZW), in addition to an increasing trend in the size of parameters, the main differences occur between environmental category 1 and environmental category 3. Of note is the low number of samples pertaining to environmental category 3, which can be explained by the fact that this habitat, with trophic resources particularly suitable for roe deer, also offers shelter sites where they can hide from hunters (Panzacchi et al. Citation2010). Accordingly, Tufto et al. (Citation1996) stated that the forest types, characterized by high densities of food and low visibility, were preferred, suggesting that habitat use is allocated in proportion to either food or cover or both.
In contrast, adults showed significant differences between sexes for live body weight (LW), head-trunk length (HTL) and length of hock HL among body parameters, and for zygomatic width ZW for cranial ones. Adult animals have reached their full body size, and male parameter sizes were higher than female.
In addition, adults showed significant differences among environmental categories for live body weight (LW), head-trunk length (HTL), chest circumference (CC), length of hock LH, ectorbital width (ECW), and length of the teeth row (TRL). Among the body parameters, weight is often used as an indicator of the health status of the population (Kie Citation1988). The roe deer requires trophic resources rich in protein and low in fiber, and thus it is particularly subject to weight variations determined by the quality and quantity of the available food. The fact that live body weight (LW) showed significant difference between both the sexes and the environmental categories suggests that live weight could possibly be used as an indicator of ecological changes (Cederlund et al. Citation1998), and thus as a parameter to be considered in population management decisions (Mitchell et al. Citation1986; Morellet et al. Citation2007). As regards body length, our study found differences between field and forest roe deer, a finding also noted by Fruziński et al. (Citation1982), who concluded that life and habitat differences were the main factors explaining body length variations. Our results also indicate that trophic resources can affect the head-trunk length (HTL) of adult animals, which showed significant differences both between sex and environmental category. Therefore, also head-trunk length (HTL) could be used as an indicative parameter of the health status of the adult population.
Finally, considering that the head grows quickly during the first year of life, it can be said that environmental conditions are able to affect zygomatic width (ZW), condilo-basal length (CBL) and total length of the cranium (TL) size. Instead, roe deer reach their full size at the age of 2 years, and thus the environment seems to influence the potential cranial width (ECW) and the length of the teeth row (TRL), an important functional size strictly related to food intake. Moreover, length of hock (HL) is affected by environmental category in fawns and by both sex and environmental category in adults.
In conclusion, our findings indicate a possible relationship between food availability during the critical autumn-winter period and some roe deer body and cranial parameters; in particular, length of hock (HL) for both fawns and adults, live body weight (LW) and head-trunk length (HTL) for the adults.
The measurements provided by hunters during selective culling provide a great amount of information for building improved biometrical databases. Analysis of these data can help authorities to identify the most suitable parameters for defining optimum management plans for this ungulate, that should take into account the critical period trophic resource availability. Our results can be the starting point for future researches aimed at predictive model construction.
Acknowledgements
The authors wish to thank the ATC-MC2 for providing the database and Sheila Beatty for editing the English usage of manuscript.
Disclosure statement
No potential conflict of interest was reported by the authors.
References
- Abbas F, Morellet N, Mark Hewison AJ, Merlet J, Cargnelutti B, Lourtet B, Angibault JM, Daufresne T, Aulagnier S, Verheyden H. 2011. Landscape fragmentation generates spatial variation of diet composition and quality in a generalist herbivore. Oecologia 167:401–411. DOI: 10.1007/s00442-011-1994-0.
- Apollonio M. 2004. Gli ungulati in Italia: Status, gestione e ricerca scientifica. Hystrix 15(1). DOI: 10.4404/hystrix-15.1-4323.
- Aulak W, Babińska-Werka J. 1990a. Estimation of roe deer density based on the abundance and rate of disappearance of their faeces from the forest. Acta Theriologica 35(1–2):111–120. DOI: 10.4098/AT.arch.90-12.
- Aulak W, Babińska-Werka J. 1990b. Use of agricultural habitats by roe deer inhabiting a small forest area. Acta Theriologica 35(1–2):121–127. DOI: 10.4098/AT.arch.90-13.
- Becciolini V, Bozzi R, Viliani M, Biffani S, Ponzetta MP. 2016. Body measurements from selective hunting: Biometric features of red deer (Cervus elaphus) from Northern Apennine, Italy. Italian Journal of Animal Science 15(3):461–472. DOI: 10.1080/1828051X.2016.1186505.
- Cederlund G, Bergqvist J, Kjellander P, Gill R, Gaillard JM, Boisaubert B, Ballon P, Duncan P. 1998. Managing roe deer and their impact on the environment: Maximising the net benefits to society. In: Andersen R, Duncan P, Lannell JDC, editors. The European roe deer: The biology of success. Oslo. S: Scandinavian University Press. pp. 337–372.
- Duncan P, Tixier H, Hofmann RR, Lechnerr-Doll M. 1998. Feeding strategies and the physiology of digestion in roe derr. In: Andersen R, Duncan P, Lannell JDC, editors. The European roe deer: The biology of success. Oslo: Scandinavian University Press. pp. 91–116.
- Fruziński B, Kałuziński J, Baksalary J. 1982. Weight and body measurements of forest and field roe deer. Acta Theriologica 27(33):479–488. DOI: 10.4098/AT.arch.82-42.
- Hewison AJM, Vincent JP, Bideau E, Angibault JM, Putman RJ. 1996. Variation in cohort mandible size as an index of roe deer (Capredus capreolus) densities and population trends. Journal of Zoology 239(3):573–581. DOI: 10.1111/j.1469-7998.1996.tb05943.x.
- Hofmann RR. 1989. Evolutionary steps of ecophysiological adaptation and diversification of ruminants: A comparative view of their digestive system. Oecologia 78(4):443–457. DOI: 10.1007/BF00378733.
- Janis CM. 1990. Correlation of cranial and dental variables with dietary preferences in mammals: A comparison of macropodoids and ungulates. Memoirs of the Queensland Museum 28(1):349–366.
- Janis CM. 1995. Correlations between craniodental morphology and feeding behaviour in ungulates: Reciprocal illumination between living and fossil taxa. In: Thomason JJ, editor. Functional morphology in vertebrate paleontology. Cambridge: Cambridge University Press. pp. 76–98.
- Kie JG. 1988. Performance in wild ungulates: Measuring population density and condition of individuals. USDA Forest Service General Technical Report PSW-106: 1-17. Berkeley, CA: Pacific Southwest Forest and Range Experiment Station.
- Kjellander P, Hewison AJM, Liberg O, Angibault JM, Bideau E, Cargnelutti B. 2004. Experimental evidence for density-dependence of home-range size in roe deer (Capreolus capreolus L.): A comparison of two long-term studies. Oecologia 139(3):478–485. DOI: 10.1007/s00442-004-1529-z.
- Klein DR. 1964. Range-related differences in growth of deer reflected in skeletal ratios. Journal of Mammalogy 45:226–235. DOI: 10.2307/1376985.
- Kloke J, McKean JW. 2014. Nonparametric statistical methods using R. Milton: Chapman and Hall/CRC.
- Kloke JD, McKean JW. 2012. Rfit: Rank-based estimation for linear models. The R Journal 4(2):57–64. DOI: 10.32614/RJ-2012-014.
- Linnell JDC, Andersen R. 1998. Timing and synchrony of birth in a hider species, the roe deer Capreolus capreolus. Journal of Zoology 244(4):497–504. DOI: 10.1111/j.1469-7998.1998.tb00055.x.
- Mattioli S, De Marinis AM, Armaroli E. 2009. Guida al rilevamento biometrico degli Ungulati. Rome: ISPRA.
- Mendoza M, Janis CM, Palmqvist P. 2002. Characterizing complex craniodental patterns related to feeding behaviour in ungulates: A multivariate approach. Journal of Zoology 258(2):223–246. DOI: 10.1017/S0952836902001346.
- Mitchell B, McCowan D, Parish T. 1986. Performance and population dynamics in relation to management of red deer Cervus elaphus at Glenfeshie, Inverness-shire, Scotland. Biological Conservation 37:237–267. DOI: 10.1016/0006-3207(86)90084-4.
- Morellet N, Bonenfant C, Börger L, Ossi F, Cagnacci F, Heurich M, Kjellander P, Linnell JDC, Nicoloso S, Sustr P, Urbano F, Mystereud A. 2013. Seasonality, weather and climate affect home range size in roe deer across a wide latitudinal gradient within Europe. Journal of Animal Ecology 82(6):1326–1339. DOI: 10.111/1365-2656.12105.
- Morellet N, Gaillard JM, Hewison AJ, Ballon P, Boscardin YVES, Duncan P, Klein F, Maillard D. 2007. Indicators of ecological change: New tools for managing populations of large herbivores. Journal of Applied Ecology 44(3):634–643. DOI: 10.1111/j.1365-2664.2007.01307.x.
- Panzacchi M, Herfindal I, Linnell JD, Odden M, Odden J, Andersen R. 2010. Trade-offs between maternal foraging and fawn predation risk in an income breeder. Behavioral Ecology and Sociobiology 64(8):1267–1278. DOI: 10.1007/s00265-010-0941-0.
- Panzacchi M, Linnell JDC, Odden M, Odden J, Andersen R. 2009. Habitat and roe deer fawn vulnerability to red fox predation. Journal of Animal Ecology 78:1124–1133. DOI: 10.1111/j.1365-2656.2009.01584.x.
- Pedrotti L. 2001. Banca Dati Ungulati: Status, distribuzione, consistenza, gestione, prelievo venatorio e potenzialità delle popolazioni di Ungulati in Italia. Biologia E Conservazione Della Fauna 109:1–132.
- Pelliccioni ER, Scremin M, Toso S. 2004. Early body development of roe deer Capreolus capreolus in a sub-Mediterranean ecosystem. Wildlife Biology 10(2):107–113. DOI: 10.2981/wlb.2004.015.
- Perco F. 2011. Il Capriolo. Gavi (AL): Il Piviere Ed.
- Scocco P, Catorci A, Sparvoli D. 2013. Approccio Geosinfitosociologico ed Etologico alla Definizione della Carrying Capacity degli Ecosistemi Forestali dell’Appennino Centrale nei confronti del Capriolo (Capreolus Capreolus). Colleques Phytosociologiques XXIX. Stelvio ’70, Camerino.
- Tufto J, Andersen R, Linnell J. 1996. Habitat use and ecological correlates of home range size in a small cervid: The roe deer. Journal of Animal Ecology 65(6):715–724. DOI: 10.2307/5670.
- Varuzza P. 2005. Il capriolo. Biologia e gestione. Sala Consilina (SA): Lapelosa Printing.
- Vitanzi A, Brusaferro A, Nardi C, Sparvoli D, Catorci A. 2010. Approccio geosinfitosociologico alla definizione della carrying capacity potenziale degli ecosistemi forestali dell’Appennino centrale nei confronti del capriolo (Capreolus capreolus L.) [Geosynphytosociological approach to the definition of potential carrying capacity of central Apennines forest ecosystems in relation to the roe deer (Capreolus capreolus L.)]. Informatore Botanico Italiano 42:443–449.
Appendix 1. Results of the selection procedure, performed using the glmulti R-package, to identify the best models for each parameter in each age class, using AIC as selection criterion, with sex and environmental category (Env) as explanatory variables. Best AIC, model weight of the best model and the selected variables are indicated. The procedure had stopped when no variable was selected. The explanatory variables selected were tested using the rfit function of the Rfit R-package. Intercept, slope and significance values are indicated for every model