
 ?Mathematical formulae have been encoded as MathML and are displayed in this HTML version using MathJax in order to improve their display. Uncheck the box to turn MathJax off. This feature requires Javascript. Click on a formula to zoom.
Abstract
Survival is one of the most important traits to consider for limited animal populations under conservation programs. Here, we estimate the effects of inbreeding, geographical region (Europe, North America and other) and sex on survival at six points of life in American bison populations kept in zoological gardens. The data set consisted of 3893 animals, 1812 males and 2081 females, born between the years 1874 and 2013. We analyzed survival in terms of longevity and survival of the first day after birth. We applied regression analysis with a logistic model. Longevity was examined in terms of six time categories whereas the survival of the first day after birth as a binary trait. We find that the average longevity for the studied population was 5.21 years with a standard deviation of 6.75. The longevity was significantly affected by the sex: females survived on average longer than males. The median values of longevity were considerably lower than the averages and also conditioned by the sex. The largest number of individuals was recorded in survival up to the age of sexual maturity, equal to 43.6% of males and 30.75% of females. More females survived after reaching the age of sexual maturity. Survival of the first day after birth was not influenced by the calf’s sex. There was also detected that the survival of individuals decreased with an increasing level of inbreeding, under relative small pedigree parameters for the population studied. It was also demonstrated that geographical region has a significant effect on the longevity of captive bison.
Introduction
Observations of neonatal survivability, reaching of reproductive age, fecundity, and life span accumulated in stabile zoos conditions improve knowledge of populations, especially when combined with pedigree information. The captive management provided by zoological gardens is a specific and important part of animal conservation strategies around the world. The data collected for zoo-living animals enable us to detect and analyze the factors determining the survival, health, and welfare of endangered species (Scaglione et al. Citation2019). However, by contrast to the majority of livestock breeds, the population of zoo-living animals under a genetic conservation program is often relatively small. In consequence, it leads to an increase of homozygosity level and associated effects, especially for fitness characters. Mating relatives stimulates the frequency of the deleterious homozygous genotypes. As it is well known, inbreeding effects are depending on the gene pool of a given population (Keller & Waller Citation2002; Charlesworth & Willis Citation2009). Generally, an increase of inbreeding is negatively perceiving for survival traits. This is especially important for limited animal populations under conservation programs. Keller and Waller (Citation2002) concluded that inbreeding depression often significantly affects birth weight, survival traits, reproduction and resistance to diseases and environmental stress. The authors noted that inbreeding and inbreeding depression occur commonly in nature and can affect the viability of small and isolated populations. The estimation of inbreeding level and its impact on the welfare of zoo-living populations can be supported by the pedigree information collected in studbooks or other databases. Data from zoos around the world can be also used to detect the possible relationship between environmental and geographical factors and survival characters. The geographical area is perceived as a conglomerate of many factors, such as climatic conditions, maintenance and nutrition, and the breeding management. Da Rè et al. (Citation2018) found considerable effects on survival in mammals housed in zoological gardens. Moreover, unfavorable environmental conditions usually lead to and relatively high mortality (Flacke et al. Citation2016, Citation2017).
Measures used to indicate the welfare of zoo animals include longevity and neonatal and annual survival, and comparison of these with values obtained for free-ranging individuals (Espinosa et al. Citation2017). Tidière et al. (Citation2016) performed a comparative analysis between zoo and wild animals for an impressive number (over 50) of mammalian species based on several survival characteristics, including longevity. In our previous paper (Skotarczak et al. Citation2018), we performed a pedigree analysis (including estimation of the level of inbreeding) of an American bison zoo-living population on the basis of the data over the last century. However, to our knowledge, so far there is little in the literature results presented of survival analysis for American bison kept in zoos.
The history of this symbolic American species is very long, but includes some dramatic moments. Bison entered North America from northern Eurasia during the Pleistocene (Heck Citation1968; McDonald Citation1981). At the beginning of the nineteenth century, the number of bison roaming North America was estimated in the millions. As a result of human expansion, reduction of natural habitats and very intensive hunting, the size of the American bison population was reduced to only a few hundred by the mid-1880s (Isenberg Citation2000). After this demographic catastrophe, several small bison herds survived in North America, which means that the whole of today’s population is descended from less than 100 individuals. Moreover, as reported by Heck (Citation1968), at the end of the nineteenth century 256 bison were housed in zoos around the world. Nowadays, according to Aune et al. (Citation2017), in several conservation herds in North America live over 13 000 mature individuals (including the wood and the plains bison) and in the IUCN Red List, the current population trend is listed as stable. Including commercial herds, the number of American bison is estimated as more than half a million (Freese et al. Citation2007). Despite these numbers, it is clear that still, over 100 years after the decline time of this species, the consequences of the bottleneck can be expected in the genetic structure of population.
The genetic diversity of wild living American bison was investigated by Halbert (Citation2003), Halbert et al. (Citation2005) and Ranglack et al. (Citation2015). The mortality of free-ranged bison in Yellowstone was analysed by Geremia et al. (2009, Citation2015). In the present study, we expand our previous results by the estimation of the effects of inbreeding, geographical region and sex on survival, measured at six points of life. The significant impact of inbreeding and sex on the longevity was proved for several species (see e.g. Leroy Citation2014; Bangar et al. Citation2016). Hormonal differences between males and females considerably determined these relationships (Ngun et al. Citation2011). The including into predictive models of geographical regions seems to be also justified. It would be stressed that there is no common breeding program applied for bison across the world’s zoological gardens. Moreover, at least for the first half of the 20th century, there was no exchange of individuals between gardens (Heck Citation1968). As it was recognized by Scaglione et al. (Citation2019): each zoo will have different “diseases of concern”, depending on its geographical location and the types of animals collected. Therefore, in the present paper, we focused on finding significant factors that could influence the survivability of American bison kept in zoos. The aim of this work was to estimate the effects of inbreeding level, sex on geographical region on the survival of the first day after birth and on the longevity of American bison population living in zoological gardens.
Material and methods
The data set consisted of 3893 animals (1812 males and 2081 females) born between the years 1874 and 2013. The data were extracted from the Species360 database (https://www.species360.org). A single record has the following structure: local ID, birth and death dates, sex, names of sire and dam, and name of zoo. The recorded bison were kept by zoos in six continents: 35 individuals in Africa, 32 in Asia, 283 in Australia and Oceania, 1589 in Europe, 1906 in North America and 48 in South America. In the current data set, 601 individuals had a nonzero inbreeding coefficient. The mean inbreeding coefficient for the population studied was 3.48%, and the individual increase in inbreeding for a whole population ranged from 0% to 21.12% (Skotarczak et al. Citation2018). There were recorded the following numbers of individuals across the inbred levels: 25 bison were characterized by the lowest (positive) observed inbreeding level 6.25%, 128 individuals had it between 6.25% and 12.5%, 371 animals between 12.5% and 25%, 74 animals between 25% and 37.5% and 3 individuals achieved the largest observed value of inbreeding level equal 46.875%.
Two traits were included in the analysis: survival of the day after birth (a binary trait) and longevity (a multinomial trait). Longevity was assessed using six classes: class C1 for animals living until one day after birth, class C2 for those living until 1 month (30 days) after birth, class C3 for those living until 6 months after birth, class C4 for those living until the age of sexual maturity (30 months), class C5 for those living up to 10 years, and class C6 for those living over 10 years. The distribution of numbers of individuals across the classes is presented in .
Table I. Number of individuals across studied classes: sex, inbreeding categories (as binary trait) and geographical region.
Finally, the following factors were included in the statistical analysis: sex (male or female), inbreeding (as a binary trait: inbred or not), level of inbreeding (as a continuous variable) and geographic region (three classes: Europe, North America, and other). A description of the data structure is given in .
The dependencies between survival and sex, inbreeding and geographical region were evaluated using the Pearson chi-squared test for contingency tables. In cases with a strongly skewed distribution of numbers of observations across the categories, simulated p-values were used in the Pearson test. Moreover, regression analysis with a logistic model was applied for both analyzed traits. A cumulative link model was adapted, where an ordinal observation falling in an ordered finite set of categories can be represented by a random variable Yi, taking the value j if the i-th observation falls in the j-th category, where i = 1, …, 3893 and j = 1, 2 for survival of the first day after birth or j = 1, 2, …, 6 for longevity. The generalized linear model can be motivated by the assumption that the observed categorical trait is determined by a latent unobservable random variable, often normally distributed. The corresponding probability was modeled as:
where and
,
is a vector of regression variables,
denotes a corresponding vector of coefficients, f is the inverse link function, and
are the ordered thresholds (cut-points) for categories. For binary traits, the threshold between two categories is not estimable and is usually taken to be 0. For both analyzed traits the logit transformation was used as the link function. As mentioned above, three regression variables were considered: sex on two levels, geographic region on three levels, and level of inbreeding as a continuous variable. Both linear and quadratic polynomials were considered for the level of inbreeding in the regression model. Additionally, for longevity, the so-called partial proportional odds model was implemented for sex. In this model different thresholds are estimated for females and males, respectively.
The following three models were applied:
model 1:
model 2:
model 3:
where is the j-th threshold, Si denotes the sex of the i-th individual, Ri is the geographical region of the i-th individual, Fi is the inbreeding level of the i-th individual,
are regression coefficients, i = 1, …, 3893, j = 1, 2 or j = 1,2, …, 6 depending on the trait analyzed, and the numbers in superscripts are used to distinguish the model coefficients. In the first step of analyses, the above models included also the interactions terms. However, in all cases, the interactions were not significant, so the presented models incorporate the additive components, only.
The likelihood ratio test and Akaike’s information criterion (AIC) were used to compare the goodness of fit of the models. The computations were performed using the “ordinal” package (Christensen Citation2018) in R software (R Development Core Team Citation2014).
Results
Number of individuals across the studied classes—sexes, inbreeding (as a binary trait) and geographical regions—are listed in . The mean length of life for the studied population was 5.21 years with standard deviation (SD) 6.75. For males, the mean was 4.04 years (SD = 6.12) while for females it was 6.34 years (SD = 7.08). The median values of length of life were considerably lower than the means, equaling 1.17 years for males and 2.69 for females. The largest number of individuals was recorded in class C4 (survival up to the age of sexual maturity), equal to 36.73% of the total number of observed bison (43.6% of males and 30.75% of females). The proportions of numbers of males and females in particular classes changed with increasing length of life. Thus, 66.33% of males and 48.87% of females were placed in classes C1–C4. The fourth class (survival up to the age of sexual maturity) was the last with a higher proportion of males than females. Classes C5 (survival up to 10 years) and C6 (over 10 years) contained, respectively, 23.4% and 27.73% of females and 18.49% and 15.18% of males (). Interestingly, the proportions represented by the two categories for survival of the first day after birth were similar for both sexes: 4.19% of the total number of males and 3.96% of the total number of females were placed in the first category, that is, they did not survive the first day after birth.
The distribution of average inbreeding coefficients across survival classes for females and males is given in . Generally, the level of inbreeding decreases for successive survival classes. This indicates the presumed effects of inbreeding on survival at particular age points. It should be noted that 92.36% of inbred individuals survived the threshold of the first class. On the other hand, among animals in the sixth longevity class, only 9.04% had nonzero inbreeding coefficients. These conclusions were confirmed by the Pearson test, which showed that survival of the first day after birth is highly significantly influenced by inbreeding (P < 0.0001) and geographical region (P < 0.0001). However, first-day survival was independent of the calf’s sex (P = 0.636). For longevity, all factors—sex, inbreeding and geographical region—had a highly significant effect on the distribution of the trait values (P < 0.0001 in all cases).
Table II. Averages and standard deviations (in brackets) of inbreeding level (%) across the categories.
Results of regression analysis are provided in –I. In examining the estimated regression coefficients, it should be recalled that in both the general logistic and the ordinal logistic model the response variable is logit or cumulative logit; hence, these coefficients show the changes between the relevant logits. However, some implications can be clearly formulated. First of all, the signs of the estimated coefficients show the direction in which the expectation of the latent variable moves under the influence of the factors considered. Statistically significant positive coefficients indicate an increase in the probability of an observation falling into the higher category. Hence, for survival of the first day after birth it can be concluded that females have higher survival odds than males and that individuals living in Europe are more likely to survive the first day than those in North America, but for those outside Europe the likelihood is smaller (). On the other hand, the estimated regression coefficient is significantly negative for inbreeding level, and so the probability of surviving the first day decreases when the inbreeding level becomes higher. The results did not provide a strongly significant quadratic relation between inbreeding level and the response variable; however, a quadratic trend can be identified taking into account the smaller AIC value for model 2 (AIC = 1287.1) compared with model 1 (AIC = 1289.3) and the shape of the points cloud with coordinates taken for an individual as inbreeding level and predicted probability of first-day survival ().
Table III. Estimates of regression coefficients and standard errors (SE) for survival of the first day after birth.
Table IV. Estimated thresholds and standard errors (SE) for longevity classes.
Table V. Estimates of regression coefficients and standard errors (SE) for longevity.
Table VI. Estimated thresholds and standard errors (SE) in a partial proportional odds model for longevity classes.
Figure 1. Inbreeding level vs. probability of first-day survival depending on geographical region.
For longevity, six separable classes were considered; therefore, the thresholds between classes had to be estimated. Firstly, fixed thresholds for all levels of the explanatory variables were assumed. Their estimates are given in . For this trait, the quadratic regression for the inbreeding level was not significant, so the values of estimators of thresholds and regression coefficients are similar in model 1 and model 2.
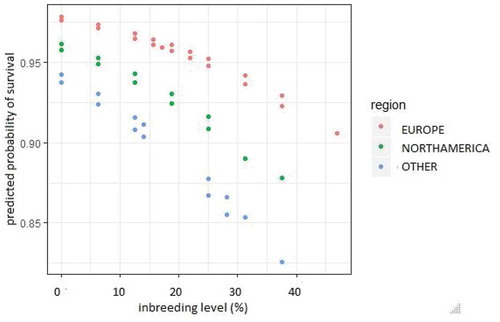
Taking into account the significant regression coefficients in model 3 (), it is possible to conclude that females have a greater probability of falling into a higher category than males, and individuals living in North America have a greater probability of being placed in a lower category than bison from other regions. Similarly as in the case of first-day survival, an increase in the inbreeding level has a negative impact on the length of a bison’s life. When the level of inbreeding increases by one unit (in %), the odds of moving from a lower to a higher category are multiplied by exp(−0.02297) = 0.977, when all other variables in the model are held constant.
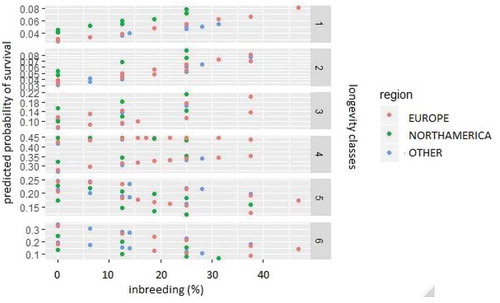
and show the relationship between inbreeding level and the category probabilities predicted in model 3, based on the six longevity classes. Every point on these graphs denotes individuals with the same factors level on the right side of the regression model i.e. the same sex, region and inbreeding level. The points are distributed across six observed longevity classes. It can be clearly seen that the fitted values of the probabilities of being placed in the third category or higher are different for the two sexes: they are higher for males in the third and fourth categories, and become higher for females in the fifth and sixth (). When the predicted probabilities are considered according to geographical region, it may be observed that in the first and second categories the highest probabilities were fitted for bison living in North America ().
Figure 2. Inbreeding level vs. category probability predicted in model 3 depending on six longevity classes and sex. One point on the figure denotes the individuals recorded with the same sex, geographical region and inbreeding level.
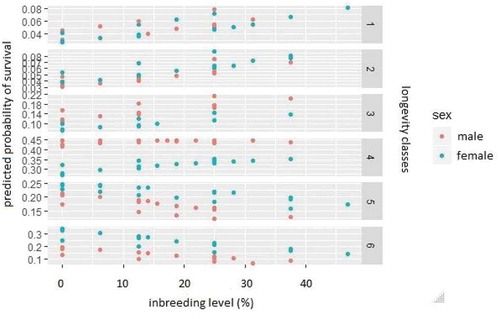
Figure 3. Inbreeding level vs. category probability predicted in model 3 depending on six longevity classes and geographical region. One point on the figure denotes the individuals recorded with the same sex, geographical region and inbreeding level.
The likelihood ratio test for longevity, used for comparison of model 1 and model 3, showed strongly significant differences between the models (P < 0.001). Moreover, the AIC value for model 3 was less than for model 1 (11,881 vs. 11,924); hence, model 3 appears to be more appropriate for analyzing the current data.
Discussion
As it already mentioned, in the studied American bison population a survival of individuals is negatively associated with increasing of level of inbreeding. Also, significant effects of geographic region are estimated. In turn, higher survival was registered for females, except of the first day after birth.
Let us recall, survival has been perceived as one of the main traits, especially for small animal populations under genetic conservation programs. Hence, a number of reports on the genetic and environmental effects on survival rates in livestock (Hare et al. Citation2006) and wild animals (Sternicki et al. Citation2003) are available in the literature. The results vary depending on species, environment (ecosystems vs. housing systems) and statistical methodology used.
Analyses of lifespan, survival and reproductive traits of free-ranging American bison have been provided by many authors (Halbert et al. Citation2005; Freese et al. Citation2007; Ranglack et al. Citation2015). According to American Bison: Status Survey and Conservation Guidelines (Gates et al. Citation2010) the rate of survival of American bison calves to 6 months is higher than 90% in herds living in protected areas in the absence of predators and diseases, and higher than 95% for adult (older than 1 year) individuals. For free-ranging bison in Yellowstone, it was observed that females live more than 20 years, while males live for a shorter time rarely over 12 years (Geremia et al. Citation2015). This disproportion may be caused by higher energetic costs incurred due to competition with other bulls during the breeding season (Meagher Citation1973). The neonatal survival of Yellowstone bison has been estimated at 75% during the first month of life and 87% during the remainder of the first year (Geremia et al. Citation2015). The probability of survival of 1 year in the case of adult female bison was estimated as 96% in northern Yellowstone and 91% in the central part of Yellowstone. Lower survival was observed in females from central Yellowstone after 9 years of age, which may be explained by the specific soil conditions in this part of Yellowstone (Geremia et al. Citation2015).
From observations of European bison, it was established that bulls from captive breeding live to 20 years, while males from free-ranging populations live for 14–16 years. Females of European bison live longer than males: up to the age of 28 in captivity and 24 when free-ranging (Krasiński Citation1978).
The aforementioned studies did not consider animals living in zoos. It is expected that stable access to water and food, along with the optimal life conditions and veterinary care provided by zoos, will enable animals to have a longer and healthier life. These expectations have been shown to be true for many species, especially mammals. Tidière et al. (Citation2016) compared four survival metrics for over 50 mammalian species living wild and captive, and concluded that 84% of the analyzed species lived longer in captivity than in the wild. However, the gains in longevity are more notable in species with a faster pace of life, defined by the authors as a short life span, high reproductive rate and high mortality in the wild. These analyses did not include American bison; however, the longevity of the similar species Bos gaurus was estimated at 15 and 18 years for males and females, respectively, living in zoos and 10 (males) and 17 (females) for free-ranging animals; hence, the benefits from stability of life conditions were more visible for males.
The present study complements the above results with findings relating to bison living in zoos. Over 27% of females and 15% of males survived more than 10 years, and of those, 0.7% (males) and 0.3% (females) lived longer than 30 years. However, looking at the means and medians for longevity, the conclusions are less optimistic. Half of the analyzed males lived not more than a little over 1 year (median longevity of 1.17) and 50% of females did not live longer than 3 years (median 2.69). Thus, half of males did not achieve reproductive age. Males living in zoos are not exposed to the competition experienced by individuals living wild; hence, other reasons for these results should be recognized. A substantial proportion of females lived only during one or a maximum of two breeding seasons. This fact may cause a decrease in genetic diversity, and as a consequence an increase in inbreeding.
The results obtained here correspond with the median longevity of American bison living in zoos as estimated by Korec et al. (Citation2019). Those authors obtained higher longevity medians, namely 2.12 for males and 6.64 for females, but these estimators were obtained for a data set different from ours. However, despite the differences in the values, the proportion between the medians for males and females is similar to our results.
According to the above-mentioned results of the Pearson test and regression analysis, longevity is significantly affected by sex, geographical region and inbreeding. Sex can influence the cut-points between longevity classes. The cut-points for females are shifted left compared with the thresholds estimated for males () meaning that a higher number of females are expected to be found in the central categories.
The significant effect of the geographical region in which a zoo is situated has also been confirmed in regression and contingency tests. During the building of the data set the geographical region of an individual animal was obtained from that individual’s local ID, and so no distinction was made between the place of birth of an animal and the zoo in which it lived. However, to our knowledge, bison are not often exchanged between zoos in different continents. As mentioned previously, the estimated probability of longer life was lower for bison living in North America than for bison from other regions. However, it should be stressed that the numbers of individuals in the analyzed regions were not balanced; hence, this conclusion should be treated as tentative. As reported by Lima et al. (Citation2019) the mortality is influenced by some diseases connected with climatic conditions (e.g. respiratory infections) as well as dystocia. The frequencies of them are higher for males. In turn, Getachew et al. (Citation2015) found the impact of additional stress could be suppressed in males since their metabolic rate may susceptible them to mortal factors.
As is well known, inbreeding has a negative impact on the welfare of animals. It has been demonstrated that inbreeding and loss of genetic variation reduce resistance to the stress of disease (Frankham Citation2005). A negative relationship between inbreeding and survival at birth were estimated by Da Rè et al. (Citation2018) for pygmy hippopotamus kept in zoos. It corresponds with results given by Ballou (Citation1997) for different species of wild animals. Moreover, unfavorable inbreeding effects on survival in livestock were well documented by Leroy (Citation2014) by the use of the meta-analysis. It is worth also recalling here the results obtained for European bison. This species, genetically close to American bison, has been almost exterminated in the 20th century and the current population has been reintroduced from a few number of individuals. The average inbreeding coefficient for the world population of European bison was estimated as 20.2% and was higher for animals with known pedigree: 43.98% for the Lowland line and 26.28% for the Lowland-Caucasian line (Olech Citation1998). The negative influence of inbreeding was reported for the mortality and the viability of young animals in the Lowland-Caucasian line (Slatis Citation1960; Olech Citation1987; Belousova Citation1999). However, for the higher inbred Lowland line, a relation between inbreeding and mortality was not found (Olech Citation1998). Some authors reported the inbreeding can lead to purging of population (i.e. Boakes et al. Citation2007). Thus, the reduction of fitness traits has not been observed. Hence, purging may be important to conservation of given population. However, in small zoo populations and probability of higher inbreeding, purging may be less efficient (Boakes et al. Citation2007). Ballou (Citation1997) showed that inbreeding had a significantly negative effect on neonatal survival in several mammalian species; however, for European bison, this effect was positive. This positive effect could be observed when inbred and healthy animals surviving to reproductive years are matched as it was reported for a captive population of Speke’s gazelle (Kalinowski et al. Citation2000) but according to Keller and Waller (Citation2002) the further analysis for more generations is necessary to confirm this purging effect.
In the present study, the negative consequences of inbreeding level were confirmed. In all three applied here regression models, the estimated regression coefficient for inbreeding level was significantly negative. Moreover, this negative influence can be analyzed in terms of a quadratic relation. However, the level of inbreeding in the studied population may be underestimated because of a lack of pedigree information. Skotarczak et al. (Citation2018) estimated relatively small pedigree completeness compared with those estimated for livestock populations. The average number of traced generations was 1.49, the mean of equivalent complete generations was 1.01, and the maximum number of fully traced generations was 3 (with a mean value of 0.693). For comparison, the average number of discrete generation equivalents for warmblood horses estimated by Borowska and Szwaczkowski (Citation2015) exceeded 4, and the average of all ancestral paths was estimated at 4.
In drawing conclusions from the results obtained in this study, it should be borne in mind that the effectiveness of the statistical methods used was constrained due to the incompleteness of the data set. The original data included animals born over a period of more than a century. The data analyzed were available as text records with no common method of data storage. We organized the data as far as we were able, but pedigree knowledge remained weak because information about the origin of many individuals was not registered. However, the number of recorded individuals made possible the use of certain statistical methods, such as the general linear model to indicate some factors possibly affecting the survival of bison living in zoos. A similar approach has been used by other authors. Da Rè et al. (Citation2018) estimated the effects of inbreeding level and geographical zone on the survival of pygmy hippopotamus using logit and probit transformations. Tomaszyk et al. (Citation2014) used odds ratio estimation to investigate synergy between birth survival and effects of sex–inbreeding and sex–birth type interactions for lambs.
The investigations have confirmed that survival and longevity are complex traits determined by both genetic and environmental factors. Although statistically significant effects of inbreeding, sex and geographical region on survival have been shown, advanced molecular approaches should be employed in further studies.
Acknowledgements
We gratefully acknowledge the helpful comments of anonymous reviewers who contributed to the improvement of the revised version of this manuscript.
Disclosure statement
No potential conflict of interest was reported by the authors.
Additional information
Funding
References
- Aune K, Jørgensen D, Gates C 2017. Bison bison (errata version published in 2018). The IUCN Red List of threatened species 2017: E.T2815A123789863. Available: http://dx.DOI.org/10.2305/IUCN.UK.20173.RLTS.T2815A45156541.en
- Ballou JD. 1997. Ancestral inbreeding only minimally affects inbreeding depression in mammalian populations. Journal of Heredity 8:169–178. DOI:10.1093/oxfordjournals.jhered.a023085.
- Bangar Y, Pachpute S, Nimase R. 2016. The survival analysis of the potential risk factors affecting lamb mortality in deccani sheep. Journal of Dairy, Veterinary Animal Research 4:266–270. DOI:10.15406/jdvar.2016.04.00114.
- Belousova IP, editor. 1999. Znachenie i otsenka pokazateleigeneticheskogo raznoobraziya dlya resheniya problemysokhraneniya evropeiskogo zubra. In: Prioksko-terrasnyigosudarstviennyi biosfernyi zapovednik. Pushchino, Russia. pp. 1–104.
- Boakes EH, Wang J, Amos W. 2007. An investigation of inbreeding depression and purging in captive pedigreed populations. Heredity 98:172–182. DOI:10.1038/sj.hdy.6800923.
- Borowska A, Szwaczkowski T. 2015. Pedigree analysis of Polish warmblood horses participating in riding performance tests. Canadian Journal of Animal Science 95:2129. DOI:10.4141/CJAS-2014-006.
- Charlesworth D, Willis JH. 2009. The genetics of inbreeding depression. Nature Review. Genetics 10:783–796. DOI:10.1038/nrg2664.
- Christensen RHB 2018. Cumulative link models for ordinal regression with the R Package ordinal. Available: https://cran.r-project.org/web/packages/ordinal/vignettes/clm_article.pdf
- Da Rè F, Graczyk M, Ćwiertnia P, Cassandro M, Szwaczkowski T, Sell-Kubiak E. 2018. Explorative statistical analysis to identify factors affecting the survival of pygmy hippopotamus (Choeropsis liberiensis) kept in zoological gardens. Belgian Journal of Zoology 148:1–12. DOI:10.26496/bjz.2018.15.
- Espinosa J, López-Olvera JF, Cano-Manuel F, Fandos P, López-Graells C, Ráez-Bravo A, Mentaberre G, Romero D, Soriguer RC, Granados JE. 2017. Guidelines for managing captive Iberian ibex herds for conservation purposes. Journal for Nature Conservation 40:24–32. DOI:10.1016/j.jnc.2017.09.002.
- Flacke GL, Tkalčić S, Steck B, Warren K, Martin GB. 2016. A retrospective analysis of mortality in captive pygmy hippopotamus (Choeropsis liberiensis) from 1912 to 2014. Zoo Biology 35:556–569. DOI:10.1002/zoo.21336.
- Flacke GL, Tomkins JL, Black R, Steck B. 2017. Demographics of polycystic kidney disease and captive population viability in pygmy hippopotamus (Choeropsis liberiensis). Zoo Biology 36:136–151. DOI:10.1002/zoo.21351.
- Frankham RJ. 2005. Stress and adaptation in conservation genetics. Evolutionary Biology 18:750–755. DOI:10.1111/j.1420-9101.2005.00885.x.
- Freese CH, Aune KE, Boyd DP, Derr JN, Forrest SC, Gates CC, Goga PJP, Grassel SM, Halbert ND, Kunkel K, Redford KH. 2007. Second chance for the plains bison. Biological Conservation 136:175–184. DOI:10.1016/j.biocon.2006.11.019.
- Gates CC, Freese CH, Gogan PJP, Kotzman M, Eds. 2010. American Bison: Status survey and conservation guidelines 2010. Gland, Switzerland: IUCN.
- Geremia C, White PJ, Wallen RL, Blanton DW. 2015. Reproduction and survival. In: White J, Wallen RL, Hallac DE, Jerrett JA, editors. Yellowstone bison—Conserving an American icon in modern society. Yellowstone National Park, Wyoming: Yellowstone Association. pp. 83–97.
- Getachew T, Gizaw S, Wurzinger M, Haile A, Rischkowsky B, Okeyo A, Sölkner J, Meszaros G. 2015. Survival analysis of genetic and non-genetic factors influencing ewe longevity and lamb survival of Ethiopian sheep breeds. Livestock Science 176:22–32. DOI:10.1016/j.livsci.2015.03.021.
- Halbert ND 2003. The utilization of genetic markers to resolve modern management issues in historic bison populations: Implications for species conservation. Doctoral dissertation. Texas A&M University, College Station, Texas.
- Halbert ND, T J W, Schnabel RD, Taylor JF, Derr JN. 2005. Conservation genomics: Disequilibrium mapping of domestic cattle chromosomal segments in North American bison populations. Molecular Ecology 14:2343–2362. DOI:10.1111/j.1365-294x.2005.02591.x.
- Hare E, Norman HD, Wright JR. 2006. Survival rates and productive herd life of dairy cattle in the United States. Journal of Dairy Science 89(9):3713–3737. DOI:10.3168/jds.S0022-0302(06)72412-2.
- Heck H. 1968. Der Bison. Wittenberg Lutherstadt, Germany: A. Ziemsen Verlag.
- Isenberg AC. 2000. The destruction of the Bison: An environmental history 1750–1920. Cambridge, UK: Cambridge University Press.
- Kalinowski ST, Hedrick PW, Miller PS. 2000. Inbreeding depression in the Speke's gazelle captive breeding program. Conservation Biology 14:1375–1384. DOI:10.1046/j.1523-1739.2000.98209.x.
- Keller LF, Waller DM. 2002. Inbreeding effects in wild populations. Trends in Ecology & Evolution 17:230–241. DOI:10.1016/S0169-5347(02)02489-8.
- Korec E, Hančl M, Kott O, Škorpíková L, Srbová A, Chalupa O, Grieblová A, Šplíchalová P, Korcová J. 2019. Genus bison has the biggest sex-related difference in longevity among mammals. Approaches in Poultry Dairy & Veterinary Science 5(4):APDV.000620.2019. DOI:10.31031/APDV.2019.05.000620.
- Krasiński ZA. 1978. Dynamics and structure of the European bison population in the Białowieża Primeval Forest. Acta Theriologica 23:13–48. DOI:10.4098/AT.arch.78-1.
- Leroy G. 2014. Inbreeding depression in livestock species: Review and meta-analysis. Animal Genetics 45:618–628. DOI:10.1111/age.12178.
- Lima MJ, Rokouei M, Dashab GR, Seyedalian AR, Faraji-Arough H. 2019. Genetic and non-genetic analysis of lamb survival in Sangsari sheep by Gibbs sampling method. Small Ruminant Research 177:56–60. DOI:10.1016/j.smallrumres.2019.06.013.
- McDonald JN. 1981. North American Bison: Their classification and evolution. Berkeley: University of California Press.
- Meagher MM. 1973. The bison of Yellowstone National Park. National Park Service Scientific Monograph Series 1:1—161. DOI:10.5962/bhl.title.70842.
- Ngun TC, Ghahramani N, Sanchez FJ, Bocklandt S, Vilain E. 2011. The genetics of six differences in brain and behavior. Frontiers in Neuroendocrinology 32:227–246. DOI:10.1016/j.yfrne.2010.10.001.
- Olech W. 1987. Analysis of inbreeding in European bison. Acta Theriologica 32:373–387. DOI:10.4098/AT.arch.87-25.
- Olech W 1998. The inbreeding of European Bison (Bison bonasus L.) population and its influence on viability. 49th EAAP meeting, August 24 –27, Warsaw, Poland.
- R Development Core Team. 2014. R: A language and environment for statistical computing. Vienna, Austria: R Foundation for Statistical Computing. Available: http://www.R-project.org/
- Ranglack DH, Dobson LK, Du Toit JT, Derr J. 2015. Genetic analysis of the Henry Mountains Bison Herd. PLoS ONE 10(12):e0144239. DOI:10.1371/journal.pone.0144239.
- Scaglione FE, Biolatti C, Pregel P, Berio E, Cannizzo FT, Biolatti B, Bollo E. 2019. A survey on zoo mortality over a 12-year period in Italy. PeerJ 7:e6198. DOI:10.7717/peerj.6198.
- Skotarczak E, Ćwiertnia P, Szwaczkowski T. 2018. Pedigree structure of American Bison (Bison bison) population. Czech Journal of Animal Science 63:507–517. DOI:10.17221/120/2017-CJAS.
- Slatis HM. 1960. An analysis of inbreeding in the European bison. Genetics 45:275–287.
- Sternicki T, Szablewski P, Szwaczkowski T. 2003. Inbreeding effects on lifetime in David’s deer (Elaphurus davidianus, Milne Edwards 1866) population. Journal of Applied Genetics 44:175–183.
- Tidière M, Gaillard J-M, Berger V, DWH M, Bingaman LL, Gimenez O, Clauss M, Lemaître J-F. 2016. Comparative analyses of longevity and senescence reveal variable survival benefits of living in zoos across mammals. Scientific Reports 6:36361. Available: https://www.nature.com/articles/srep36361
- Tomaszyk K, Dobek A, Molinski K, Gut A, Szwaczkowski T. 2014. Synergy factors in the analysis of lamb survival. Italian Journal of Animal Sciences 13:735–740.