
Abstract
The potential of forest nature reserves as refuges for biodiversity seems to be overlooked probably due to their small size. These, however, may constitute important safe havens for saproxylic organisms since forest reserves are relatively numerous in Europe. Saproxylic beetles are among the key groups for the assessment of biodiversity in forest habitats and longhorn beetles may play an important role in bioindication as they are ecologically associated with various microhabitats and considered a very heterogeneous family of insects. To study the role of forest reserves as important habitats for saproxylic beetles, we compared cerambycid assemblages in corresponding pairs of sites (nature reserves and managed stands) in a forest region under high anthropogenic pressure (Upper Silesia, Poland, Central Europe). Moreover, we also intended to assess the role played by these beetles as bioindicators in the different forest types from this area. According to the obtained diversity index values, the most valuable stands are located in nature reserves, whilst sites with the lowest value included managed forests together with two homogeneous and relatively recently established nature reserves. Our analyses demonstrated a positive correlation between deadwood volume and biodiversity, for both species richness and abundance. Our results indicate that the decisive factor is the type of a given habitat, whose characteristics can be mainly influenced/determined by forest management. The potential role of longhorn beetles as bioindicators is highlighted and the effectiveness of using traps in this family, as well as general issues regarding the use of non-selective lethal traps in the study of single invertebrate groups in protected areas are discussed.
Introduction
Managed and unmanaged forests differ regarding the population characteristics and species composition of various groups of organisms (Weslien & Schroeder Citation1999). This is especially true for the saproxylic beetle diversity that was in the focus of several studies (e.g. Weslien & Schroeder Citation1999; Martikainen et al. Citation2000; Borowski Citation2001; Mokrzycki Citation2001; Byk Citation2001a, Citation2001b; Gutowski et al. Citation2006; Hilszczański et al. Citation2007; Gossner et al. Citation2013, Citation2016; Bouget et al. Citation2014; Müller et al. Citation2015; Bouget & Parmain Citation2016). However, only a small part of such research took place in nature reserves (or reserves outside national parks), which on the one hand are usually local and small-scale objects, but on the other hand are relatively numerous, which in turn increases their importance in the network of ecological corridors. Along with national parks, nature reserves play an important role as deadwood reservoirs. In 2020, Poland has 1501 nature reserves, which cover a total area of 169,000 ha, representing 0.54% of the country’s territory. There are about 720 forest reserves with a total area of 67,224 ha and 140 fauna ones (45,869 ha). Forest reserves constitute approx. 0.73% of all national forests (9.2 million ha), although only a few have been established for the purpose of insect protection (Central Register of Forms of Nature Protection Citation2020).
Saproxylic beetles represent one of the most species-rich and functionally diverse groups of endangered organisms inhabiting forest ecosystems (Stokland et al. Citation2012) and they constitute a key group when assessing forest biodiversity. Thus, it is important to explore their habitat requirements (Horák et al. Citation2011) and mechanisms driving their occurrence. Studies on the relationships between saproxylic beetles and deadwood have been undertaken relatively recently (Speight Citation1989; Martikainen et al. Citation2000; Grove Citation2002; Lachat et al. Citation2007, Citation2012, Citation2016; Dollin et al. Citation2008; Müller & Bütler Citation2010; Lassauce et al. Citation2011; Boucher et al. Citation2012; Hjältén et al. Citation2012; Wu et al. Citation2013, Citation2015; Müller et al. Citation2014; De Zan et al. Citation2014; Della Rocca et al. Citation2014; Buse et al. Citation2016; Heikkala et al. Citation2016; Seibold et al. Citation2016; Doerfler et al. Citation2018; Jaworski et al. Citation2019). Most of these studies were conducted in the temperate and boreal zones, while only a few refer to subtropical and tropical ones (Seibold et al. Citation2015). Nevertheless, despite the numerous studies on this topic, it is still relatively rare to find results dealing with the amount of deadwood that is needed to maintain a proper saproxylic diversity.
Within saproxylic beetle assemblages, longhorn beetles (Coleoptera: Cerambycidae) are one of the most diverse groups occurring in various habitats with different characteristics. The members of this family can be excellent indicators of well-differentiated saproxylic communities (Speight Citation1989) and of the progress of forest restoration (Maeto et al. Citation2002), but their role in biodiversity assessment of islands can be also emphasized (Sugiura et al. Citation2009). Given that proper biodiversity indicators should reflect similar patterns in biodiversity as those observed for total species diversity, longhorn beetles were among the top beetle families indicating coleopteran diversity in Japanese forests (Ohsawa Citation2010). Considering the degree of habitat specificity, longhorn beetles are among the five best indicators of habitat conditions (Bhargava Citation2009; Lachat et al. Citation2012). According to Holland (Citation2007), some cerambycid species may even serve as very good bioindicators of forest sites with high biodiversity since they are closely associated with specific forest habitats, although monophagous and oligophagous species are better indicators than strongly polyphagous ones.
In the present study, we compared the diversity, species assemblages, richness, and abundance of cambio-xylophagous representatives of Cerambycidae between nature reserves and managed forest stands and assessed the effects of some general stand (forest stand size and number of dominant tree species) and deadwood characteristics (number of deadwood tree species, decomposition class, and type of deadwood) on their species richness and abundance. We hypothesized that the nature reserves would differ from management sites in the (a) diversity and (b) species richness and abundance of Cerambycidae, and that these latter (c) will be determined by the different site characteristics. We expected a higher Cerambycidae diversity with a higher number of species with high natural value (e.g. protected, red listed, locally endangered) in the nature reserves. Moreover, we also expected that site characteristics, like the larger size of the sites and the presence of different types and higher amount of deadwood, would have a positive effect on species richness and abundance of Cerambycidae. One of the key issues in protecting the biodiversity of forest ecosystems is to find a compromise regarding the amount of deadwood that is left in managed forests. The applied forestry practices, besides the social interest, should also take into account the preservation of high species richness in these ecosystems. To achieve this it is necessary to understand the ecological requirements of saproxylic organisms.
Materials and methods
Study area
Fourteen forest sites located in southern Poland (the Silesian Voivodeship) were designated for the study area representing both lowlands (the North European Plain: Silesian Lowlands) and highlands (the Polish Highlands: Silesian Upland and Woźnicko-Wieluńska Upland). The entire region is located in the catchment area of the two biggest rivers in Poland—the Oder and Vistula. The annual average precipitation is from 700 to 800 millimeters. Being the largest urbanized area in Poland, the climate has undergone a significant transformation under the influence of human activity (strong air pollution that results in reduced solar radiation and increased cloudiness) (Ramanathan & Feng Citation2009; RWMŚ GIOŚ Citation2019).
Unmanaged stands were selected within forest nature reserves and managed stands within regular areas of State Forests (six stands) and one part of the Natura 2000 network () as this site was the only available suitable comparative area for one of the reserves. In Natura 2000 sites, forest management is carried out in a standard manner but regarding possible investments, the general principle is to conduct operations in such a way as not to worsen the condition of these habitats and populations of individual species. The study sites cover different types of stands: broadleaved, mixed, coniferous, and riparian forests. All sites are in the jurisdiction of the Regional Directorate of State Forests in Katowice (RDST) or the Regional Directorate for Environmental Protection in Katowice (RDEP). In most cases, reserve protection has been carried out since the sixties (1953–1958), except for one site (B1) that was created relatively recently in 2002. We included also this site because we wanted to assess the biggest range of different forest site types available in this region. In Poland, due to the method of protection, there are regular and strict nature reserves. All selected reserves belong to the former category. Although some limited maintenance in various forms, such as sanitary treatments (e.g. opening the canopy in thermophilous oak forests to bring in more light) in regular nature reserves are allowed by Polish law (occasionally and locally), none of such forest renewal operations, or their recent residues have been noticed during the surveys. Therefore, we considered these stands unmanaged. The proper permits from RDEP (WPN.6205.10.2013.MM–WPN.6205.10.2013.MM.6) were obtained to conduct research in all nature reserves. The geological and tree species data on particular habitats were gained from portals of the Interactive map of RDST in Katowice (Citation2017) and Forest Data Bank (Citation2017).
Table 1. Specifications (stand type, area, forest site type, dominant tree species, and stand age) of the research sites
Sampling design
Seven pairs of managed and unmanaged corresponding research sites were considered, in which the cerambycid assemblages were thoroughly examined. Sites within each pair were situated about 1–11 km from each other. They were almost equal in respect of the area and very similar in terms of the age (although, due to the difference in management, generally older stands were found in most of the nature reserves) and tree species composition. Also, the forest site types were the same or very close (H1/H2) in each pair ().
Field surveys were carried out in 2013–2016. In this period, 10 to 14 standardized inventories (depending on the area size) were conducted in each site (in total approx. 160 inventories), wherein the number of visits in a particular pair of sites was always identical. The average duration of a single inventory was four to five hours. Visits to a given pair were scheduled on the same day (alternately in following visits) or on the following day to maintain the most similar research conditions. Standardized field inventories, using the most effective and non-invasive methods, were carried out. These consisted in shaking flowering plants (mostly shrubs of Crataegus L., Cornus L., Padus Mill., Sorbus L., Sambucus L., and Viburnum L.) and deadwood, controlling woodpiles and flowers, and attracting individuals to artificial light sources (power generator with two lamps: 500 W mercury and 23 W UV, white sheet 4 × 2 m) during the plant growing season (from mid-April to mid-August). Moreover, in late autumn and early spring, larval feeding galleries were analyzed but also wood material inhabited by immature beetle stages was collected for further rearing. Regarding abandoned feeding galleries, to eliminate the problem of counting intersecting galleries and parasitized or moldy larvae and pupae, the method of single observation was applied: all galleries of the same cerambycid species on a single plant specimen were counted as one. In some cases, the immature stages were identified using the taxonomic keys provided by Švácha and Danilevsky (Citation1987, Citation1988, Citation1989) under an Optek SZM7045-J4L stereo microscope (at 7–90× magnifications), and in one situation the identification was confirmed by Petr Švácha (Czech Academy of Sciences). Whenever larval galleries could not be identified with certainty in the field, species were confirmed by rearing. As in other methods, the time spent searching for inhabited material was a standardizing factor also here, which resulted in an uneven sampling of the deadwood amount between particular sites and, generally, in increased sampling in nature reserves as these stands accumulate larger amounts of the suitable material. Only one person (LK) was responsible for collecting beetles, both the imagoes and the infested deadwood. During the laboratory rearing, the obtained wood material with immature beetle stages was placed in suitably adapted containers (transparent plastic boxes with a capacity of 65 l and ventilation holes). A separate culture was set up for each of the 14 research stands, regularly inspected, moistened, and replenished in the course of the research. Larval rearing was carried out in an unheated room to keep the indoor temperature possibly similar to natural conditions.
Deadwood measurements
To estimate the quantity and quality of deadwood in all research stands, we used the methodology developed by Czerepko (Citation2008) based on the field manual for the BioSoil Forest Biodiversity Project (Bastrup-Birk et al. Citation2007). This was slightly modified by us by accounting for the ecological requirements of the saproxylophagous representatives of the family Cerambycidae. The BioSoil method consists of determining the common center of an area and deriving from it three circular sub-surfaces with the radii: 3.09 m (30 m2), 11.28 m (400 m2) and 25.24 m (2000 m2), respectively. In these three sub-surfaces, particular deadwood categories are counted: 1—coarse woody debris (CWD hereafter) (Ø > 10 cm), lying dead trees (Ø1.3m > 0), stumps (Ø > 10 cm), snags (Ø > 10 cm), and standing dead trees (Ø1.3m > 0); 2—CWD (Ø > 10 cm), lying dead trees (Ø1.3m > 10 cm), stumps (Ø > 10 cm), snags (Ø > 10 cm), and standing dead trees (Ø1.3m ≥ 10 cm); 3—lying dead trees (Ø1.3m ≥ 50 cm) and standing dead trees (Ø1.3m ≥ 50 cm). We introduced the following modifications in the discussed method: (I) wood debris from the oldest (fifth) decomposition class was not taken into account as such material is no longer suitable for most Cerambycidae species, and (II) stumps and snags (Ø > 10 cm), being the optimal micro-habitats for numerous species, were counted on all three sub-surfaces. Besides the above parameters, for each piece of deadwood the tree species was determined and a decomposition class was assigned.
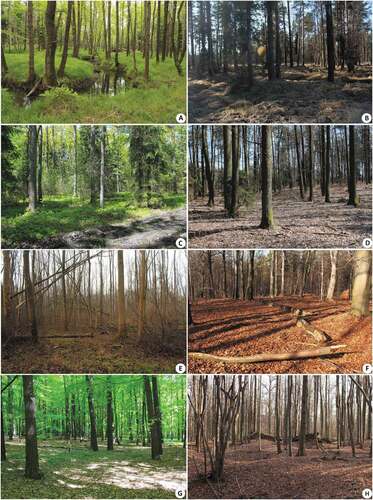
Due to the relatively small area of sites and unevenly distributed woody debris, in each stand one plot was selected for estimation of the amount of deadwood. To maintain the comparability of the results, the plot with the clearly highest share of deadwood was always chosen, and the core of each plot was selected so that it could cover the largest amount of the substrate. This evaluation was made by two independent observers after identifying the resources in the entire site. Although the data obtained in this way are therefore estimates and should be averaged, a distinctly larger share of deadwood in nature reserves clearly results from different management strategies. General disparities in the amount of the material and structure of the forest floor are depicted in .
Figure 1. Typical habitats in examined nature reserves: (a) D1, (b) H1, (c) L1, (d–f) M1, (g) MG1, (h) S1
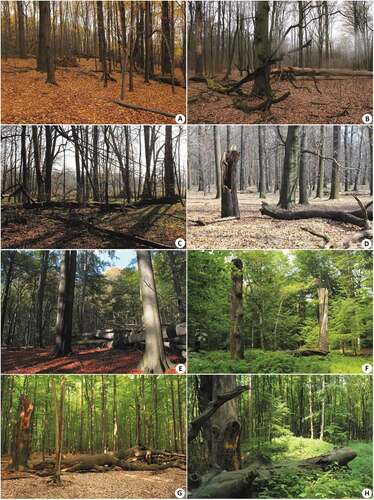
Figure 2. Typical habitats in examined managed stands: (a–b) B2, (c) D2, (d) H2, (e) L2, (f) M2, (g) MG2, (h) S2
Data analyses
The Margalef diversity index (d) (Margalef Citation1958), using natural logarithm, was applied in order to determine the longhorn beetle species diversity in particular sites. Valorisation of all sites was done according to the cumulative (Gutowski et al. Citation2006, Citation2010) and non-cumulative index of species value. The cumulative index was slightly modified by the authors regarding the categories used (exclusion of the categories unrelated to the presented study, for instance, species characteristic for pine forests) and it awards a given species for being present in all applicable categories, by summing up all relevant values. The non-cumulative index is based on similar categories, however, the point values for a given species are not cumulative, which means that species only receive points for the highest category that applies to them. Detailed categories of species value are presented in . Regarding both indices, in order to avoid the impact of different research intensity between pairs of sites that strongly differ in the area size, the sum of points obtained was divided by the number of all species recorded in a given site.
Table 2. Categories in cumulative and non-cumulative index of species value
The European Red List of Saproxylic Beetles (Nieto & Alexander Citation2010) was not considered due to the fact that some subfamilies (Lepturiane, Necydalinae, Spondylidinae) were not yet compiled, while among the others (e.g. Lamiinae) many vulnerable species such as Acanthocinus reticulatus (Razoumowsky, 1789), Exocentrus adspersus Mulsant, 1846, Exocentrus stierlini Ganglbauer, 1883, and Saperda similis Laicharting, 1784 (taking into account only Polish fauna) were not included. Local lists of endangered species (Pawłowski et al. Citation2002; Głowaciński & Nowacki Citation2004; Greń et al. Citation2012) seem to better reflect the real situation. Furthermore, national protection includes all species from the Annex IV of the Habitats Directive, as they are subject to a strict protection system in all EU Member States. As for the relict species (primeval forest species) in Poland only two taxa were considered: Cerambyx cerdo Linnaeus, 1758—in accordance with Müller et al. (Citation2005) and Eckelt et al. (Citation2018)—and Stictoleptura scutellata (Fabricius, 1781). For stenotopic species we considered cerambycids tolerating only a narrow range of environmental conditions or adaptable to only a narrow range of environmental changes. All species included in this category are listed in Tables S1 (List of total point values assigned to individual species).
The species richness and abundance of the different sites were compared between the different site categories (very high, high, moderate obtained by their classification based on the Margalef diversity index) with the help of LMMs (maximum likelihood). Two separate models were built, one with species abundance and one with species richness as a dependent variable. In the models, the site category was included as an explanatory factor, whereas the different site pair ID (managed, unmanaged), as a random factor.
The similarity of the assemblages was examined by using cluster analysis performed with Ward’s method (Ward Citation1963). The species richness and abundance of the different study site pairs were compared by using Canonical Correspondence Analysis (CCA). Two separate models were built with a matrix of the species abundance (1) or richness (2) for every site, as dependent variables, whereas every site pair and the management (managed, unmanaged) were included, as explanatory variables in both models. To calculate the significance of the association between the dependent and independent variables, for each independent variable a permutation test was performed (Oksanen et al. Citation2019), with Bray-Curtis dissimilarity method and 999 permutations. We also examined the beta diversity of the forest sites to see the contribution of turnover versus nestedness within and between site pairs. The nestedness and turnover values between forest sites were obtained by comparing the cumulated values of species richness (if present in at least one of the managed and unmanaged sites, got 1, if missing from both, 0) and abundance for all the site pairs (managed + unmanaged). The within-site pair values (managed vs. unmanaged) of nestedness and turnover were extracted (both for species richness and abundance) from the matrix of all site comparisons. In this latter case, the average of the within site pair values were taken.
The difference in the deadwood volume between the managed and unmanaged sites was analysed using GLM (Gaussian error, maximum likelihood). In the model, the deadwood volume was included as a dependent variable, whereas the managed or unmanaged state of the sites, as an explanatory factor. A similar model approach (GLM, Gaussian error, maximum likelihood) was used to test the effect of deadwood volume on the species richness and abundance. Two models were built, one with species richness and one with abundance as a dependent variable, whereas the deadwood volume was an explanatory factor in both models. In these two models, one pair of beech sites (S1/S2) was not included because a very small number of cerambycid species that are associated with beech wood was found and at the same time this tree species had an almost exclusive share on the respective measurement plots. Moreover, the site MG1 was identified as a highly influential point by the model diagnostics, so it was left out from these analyses. Two non-saproxylic species (Pseudovadonia livida and Agapanthia villosoviridescens) were also excluded from the analyses.
The effects of the different site (management, site size, number of dominant tree species, ) and deadwood (number of deadwood tree species, decomposition class, and type of deadwood, Table S2) characteristics on the species richness and abundance were analysed in two separate GLMs (Gaussian error, maximum likelihood). In the models, the species richness and abundance were included as dependent variables, whereas the management type (two-level factor: managed, unmanaged), site size, number of dominant tree species (one vs. two, see ), the different number of deadwood categories (three-level factor: 3 or less, 4, and 5), the decomposition class (two-level factor: classes 1–2 or 3–4), and number of deadwood tree species were used as explanatory variables. In the model for species abundance, the stand MG2 was identified as an influential point by the model diagnostics, so it was left out from this analysis.
Statistical analyses were performed in Statistica 13.1 (StatSoft) and R statistical environment (R Core Team Citation2019). If necessary, the variables were log-transformed prior to the analyses to meet the normality and homogeneity of variances. GLMs were performed using the glm function (‘stats’ package), whereas LMMs were performed by using the lmer function (‘lme4ʹ package, Bates et al. Citation2015). To carry out the multivariate statistic (CCA) and the PERMANOVA we used the adonis2 function from the ‘vegan’ package (Oksanen et al. Citation2019). The portioning of beta diversity into turnover and nestedness was performed with ‘betapart’ package (Baselga et al. Citation2020). The pairwise comparisons within site pairs were performed with the beta.pair (species richness) and beta.pair.abund (species abundance) functions. The between site pair turnover and nestedness values were obtained with the help of beta.multi (species richness) and beta.multi.abund (species abundance) functions. The emmeans function (‘emmeans” package) was used for sequential post-hoc comparisons among factor levels when performing GLM analyses (Russell Citation2019).
Results
Cerambycid diversity and the valorisation of the sites
A total number of 2,838 individuals belonging to 75 species (ca. 40% of the Polish cerambycid fauna) and 49 genera, which represent all six subfamilies occurring in the country, were found. During the field study, approx. 1,700 imagines, 650 larvae and pupae, and 220 feeding galleries (in the form of single observations) of longhorn beetles were recorded. As a result of carrying out over 280 separate laboratory rearings, a total of 424 imagines of longhorn beetles were obtained. Four species: Axinopalpis gracilis (Krynicki, 1832), E. adspersus, Mesosa nebulosa (Fabricius, 1781), and Pachytodes cerambyciformis (Schrank, 1781) were reported for the first time in this region of Poland. The species that were considered primeval forest relicts (C. cerdo and S. scutellata) were found exclusively in nature reserves. A complete species list with the number of individuals recorded in particular research sites is available in the Supplementary Material (S1 Appendix).
The Margalef diversity index (d) for the assemblages of longhorn beetles ranged from 3.84 to 7.0. The highest values were obtained for the sites L2 (7.0; riparian forest within a Natura 2000 site) and L1 (6.46; riparian forest within nature reserve) and the lowest for the sites B1 (3.84; mainly pine monoculture within a nature reserve of a short protection time) and S1 (3.85; shady beech forest within a nature reserve). Based on the obtained index values, we conducted the classification of research sites into three classes of species richness: I) d > 5.3—very high (sites L2, L1); II) 4.7 ≤ d ≤ 5.3—high (sites H1, D1, M1, MG1); III) d < 4.7—moderate (sites B1, B2, H2, M2, S1, S2, D2, MG2).
Based on the classes of species richness, there is a conspicuous share of the cerambycid assemblages of the majority of nature reserves in the second biodiversity group (high biodiversity value) and of the assemblages of all the remaining managed sites in the last group (moderate biodiversity value). The detailed values for the assemblages of all sites are presented in . The three categories were significantly different in the species richness, with the very high being larger than the high and moderate (LMM z > 3.95, p < 0.01), whereas the high larger than the moderate (z = 3.16, p = 0.02). Similarly, the species abundance was larger in the very high category compared to the moderate (z = 3.61, p = 0.03), but showed only marginally significant difference between the high and moderate (z = 2.58, p = 0.06), and no difference between the very high and high classes (z = 1.22, p = 0.48).
Table 3. The number of longhorn beetle species and the Margalef diversity index (d) values of their assemblages for all investigated stands
As a result of the valorisation of sites based on the cumulative index of species value, we found that the most precious sites in terms of the occurrence of rare and valuable (from a conservation point of view) species are MG1 (1.79) and M1 (1.37). Stands of L1 and L2 were also ranked very high (1.32 and 1.34, respectively), whereas the least valuable sites in the considered category were H2 (1.04) and B1 together with M2 (1.05). The valorisation carried out based on a non-cumulative index gave similar results. The most valuable sites turned out to be MG1 (1.96) and M1 together with MG2 (1.57). Again, the least valuable ones were H2 (1.09), as well as B1 and M2 (1.1). The detailed values for all sites together with a list of total point values assigned to individual species are presented in the Supplementary Material (Table S1).
Similarity of assemblages
The cluster analysis carried out using Ward’s method showed that in every studied site the cerambycid communities were most similar in managed and unmanaged site pairs (). The strongest similarity was observed for the B1/B2 group, while the most diverse pair of sites was L1/L2. This method also enabled the identification of five faunal groups within the research area: (I) assemblage of fresh forest (MG1/MG2) with stands dominated by oak and larch and a share of aspen; (II) assemblage of riparian forest (L1/L2; sisters with the previous one), whose stands are dominated by oak, linden, and alder; (III) assemblage of acid lowland beech forest (M1/M2 and S1/S2); (IV) assemblage of subcontinental oak-hornbeam forests in the habitats of fresh deciduous and fresh mixed deciduous forests (D1/D2 and H1/H2; sisters with the previous one) formed by oak-spruce and oak-pine stands, respectively; (V) assemblage of pine-dominated marsh reed forest in the habitat of a humid mixed deciduous forest transforming into a humid mixed coniferous forest (B1/B2). The two first-mentioned faunal groups (pairs MG1/MG2 and L1/L2) actually clustered in a distinct branch separated from other site pairs at a higher level. Most likely this was resulted by the share of species associated with oak and poplars/aspen in both of these assemblages.
Figure 3. Ward’s cluster analysis of similarity of the assemblages, shown for all sites
The species richness (CCA F = 6.11, R2 = 0.83, p = 0.001) and abundance found in the different study site pairs showed significant differences (F = 2.46, R2 = 0.66, p = 0.001). However, we did not find any difference in the species richness (F = 1.31, R2 = 0.03, p = 0.29) and in abundance (F = 1.45, R2 = 0.07, p = 0.13) between managed and unmanaged sites. We also considered the beta diversity based on species richness and abundance. The contribution of turnover (richness: 0.61; abundance: 0.74) was much larger than that of the nestedness (richness: 0.07; abundance: 0.08) between site pairs. However, within site pairs, the contribution of turnover (richness: 0.17; abundance: 0.38) and nestedness (richness: 0.1; abundance: 0.2) to the beta diversity was more even, but still with a larger turnover both in species richness and abundance.
Site and deadwood characteristics
As a result of the field surveys, the data on the quantity and quality of deadwood in all individual measurement plots (2000 m2) were obtained. Definitely, the highest volume of deadwood was found in the MG1 site (67.37 m3), followed by the M1 (25.33 m3) and L1 (22.03 m3). As assumed, generally the lowest amount of deadwood was counted in the managed sites, with the extreme values in MG2 (0.79 m3), B2 (0.85 m3), and H2 (0.9 m3). The exception is site S2, where the deadwood was in form of old beech snags—left by the forestry for aesthetic reasons. The volume of the deadwood was significantly lower in the managed sites (GLM t = −3.45, p = 0.005). Moreover, the species richness (GLM t = 2.35, p = 0.04, ) and abundance was affected significantly by the deadwood volume (t = 2.25, p = 0.05, ).
Figure 4. The effect of deadwood volume on the number of cerambycid species richness, shown for all sites except S1, S2 and MG1 (the pair of beech sites—S1/S2—were not included because a small number of cerambycid species associated with beech wood, whereas the MG1—the site with three times higher amount of deadwood than other sites—was identified as an influential point). The black line with confidence band (grey) is plotted based on the Pearson correlation of the two variables
Figure 5. The effect of deadwood volume on the abundance of the cerambycid species richness, shown for all sites except S1, S2 and MG1 (the pair of beech sites—S1/S2—were not included because a small number of cerambycid species associated with beech wood, whereas the MG1—the site with three times higher amount of deadwood than other sites—was identified as an influential point). The black line with confidence band (grey) is plotted based on the Pearson correlation of the two variables
The most diverse deadwood in terms of species composition was inventoried in the D1 site (five species), followed by the sites: D2, H1, L1, MG1, S1, and S2 (three species each). The predominance of unmanaged sites is noticeable in this respect. Considering the type of deadwood (CWD, lying dead trees, stumps, snags, and standing dead trees), all five categories were found in the sites: D1, D2, and M1, whereas all four types of decomposition classes were inventoried in the sites: D1, H2, M1, M2, MG2, and S1. The detailed deadwood characteristics for all sites can be found in the Supplementary Material (Table S2). The final model testing the effect of different site (management, site size, number of dominant tree species, ) and deadwood (deadwood tree species, decomposition class, and type of deadwood) characteristics on the species richness contained the site size, number of dominant tree species and the tree species of deadwood. The size of the site (GLM t = 2.74, p = 0.02; ) had a positive effect, whereas there was a marginally higher species richness in forest sites with more than one dominant tree species (t = 2.06, p = 0.06). The deadwood species composition did not have a significant effect (t = 1.61, z = 0.14). Considering the species abundance, the final model contained the size of the site, number of dominant tree species, and the type of deadwood. The species abundance was higher in larger forest sites (GLM t = 4.08, p = 0.003) and sites with more than one dominant tree species (t = 5.23, p < 0.001). Sites with five and three (or less) types of deadwood had a higher species abundance than those containing four types (t > 4.18, p < 0.001), however, there was no significant difference between the former two types (t = 0.68, p = 0.78).
Figure 6. The effect of area size on the cerambycid species richness, shown for all sites. The black line with confidence band (grey) is plotted based on the Pearson correlation of the two variables
Discussion
Our results indicate an important effect of area size and the amount of deadwood present in forest habitat on the species richness and abundance of cerambycid beetles. Moreover, we also found differences in the species richness and abundance of longhorn beetles between the different forest types, and species of this group are good indicators of forest value in the terms of saproxylic diversity. Even if our results indicated a difference in the amount of deadwood between the managed and unmanaged sites, we could not detect an effect of the management type strictly on the species richness and abundance of Cerambycidae, perhaps due to the differences between the site pairs. However, the species that are the most valuable from a conservation point of view were found almost solely in nature reserves: C. cerdo—a primeval forest species included in all considered endangered species lists (Karpiński et al. Citation2017)—in the MG1 site, S. scutellata (primeval forest species) in the M1 site, and A. gracilis (RLBSV) in the L1 and MG1 sites. The latter species was also recorded from a Natura 2000 site (L2).
Methods used
Various types of traps are a great tool to be used to measure the overall saproxylic biodiversity. However, in our opinion, when it comes to a single indicator group that consists of taxa with very diverse biology, the use of a full range of methods provides better results and allows us to reveal a much wider picture of a community in a given area. This is possible because they take into account the ecological preferences of all representatives. Moreover, in this heterogeneous beetle family, different species respond differently to many variables (lure type, trap color, trap height, etc.), thus trapping efficacy varies not only at the species level but also at upper taxonomic levels (Rassati et al. Citation2019). Accordingly, the used design might affect the obtained structure of assemblages. It is also noteworthy that cerambycids seem to be insensitive to alcohol baits (Sweeney et al. Citation2004; Bouget et al. Citation2009).
The effectiveness of traps in capturing longhorn beetles is controversial. For instance, Rassati et al. (Citation2019) reported on 35 longhorn beetle species (approx. 13% of the Italian fauna) caught in North-East Italy, while Fayt et al. (Citation2006) trapped 1,637 individuals of 30 species (approx. 25% of the Belgian fauna) in southern Belgium. For a total of 12,211 saproxylic beetles representing 196 species, only 4 cerambycid species were lured in the central French Pyrenees (Bouget et al. Citation2009). In North America, 885 individuals of 37 longhorn beetle species were trapped in east-central Illinois (Wong & Hanks Citation2016).
In the presented research, 75 species representing all six subfamilies that occur in Poland were found, which constitutes approx. 40% of the Polish fauna. Additionally, some uncommon and more valuable (from a conservation point of view) taxa, such as Anaglyptus mysticus (Linnaeus, 1758), Necydalis major Linnaeus, 1758, and Rhamnusium bicolor (Schrank, 1781) usually require personal search and they are predominantly found at larval stage in their specific microhabitats. On the other hand, some nocturnal species (e.g. A. gracilis and E. adspersus) can be relatively easily attracted to an artificial light source. Overall, the effectiveness of individual research methods was as follows: the largest number of species (43) was found by controlling breeding material and flowers, followed by analyzing inhabited material with immature stages and abandoned galleries (40 species) and conducting laboratory rearings (39 species). As two of the latter methods seem to be closely related, it should be emphasized that only 24 species (approx. 44%) were found using both techniques. It is also noteworthy that, despite generally the larger deadwood sampling in most nature reserves (related to the greater resources), the total number of reared species was comparable between both site types, slightly favouring the managed sites (25 vs. 27, respectively). This may be due to the fact that the suitable deadwood pool is much poorer in managed sites and, consequently, it is more optimally utilized by females, while the rich deadwood pool present in nature reserves is inhabited more evenly. Halfway through the list, there was a method of shaking off blooming plants and deadwood, with the result of 23 species. The least effective was attracting beetles to an artificial light source (5 species) and sweep netting (3 species). Although it might be found problematic for an untrained investigator to correctly identify immature stages of some cerambycids, many species are very characteristic in larval stages as well as in the structure of their feeding galleries, especially in certain specific microhabitats (, S1, S2).
Figure 7. Immature stages, larval feeding galleries and microhabitats of cambio-xylophagous longhorn beetles: (a) Oplosia cinerea—larva in a linden branch; (b) O. cinerea—prepupal larva in its pupal cell in linden wood; (c) Xylotrechus rusticus—larva in its pupal cell deep in an aspen trunk; (d) X. rusticus—stopper of pupal cell made of moistened aspen sawdust; (e) X. rusticus—feeding galleries in an aspen trunk; (f) Prionus coriarius—larva in a hornbeam root; (g) Saperda populnea—pupa in its pupal cell in an aspen twig; (h) Saperda perforata—pupa in its pupal cell in an aspen trunk
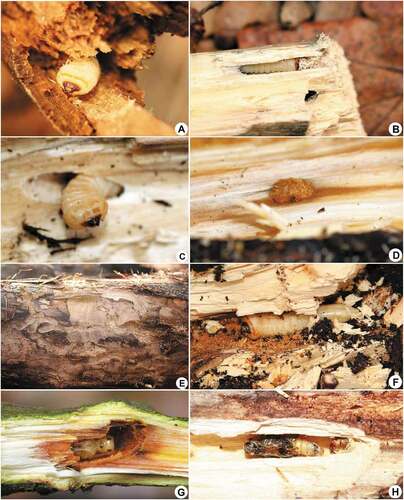
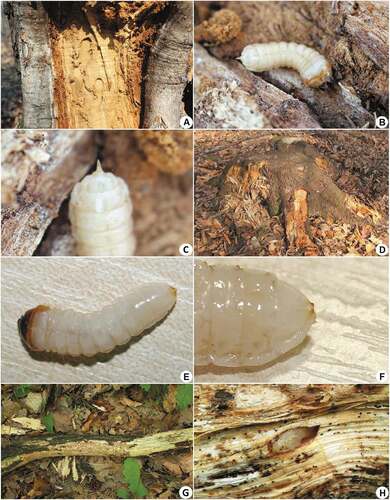
Figure 8. Immature stages, larval feeding galleries and microhabitats of cambio-xylophagous longhorn beetles: (a) Rhamnusium bicolor—characteristic feeding galleries in chestnut necrosis at the contact zone with living tissue; (b) R. bicolor—larva; (c) R. bicolor—characteristic caudal process on ninth tergum; (d) Oxymirus cursor—microhabitat (spruce stump); (e) O. cursor—larva; (f) O. cursor—characteristic stout conical urogomphi on ninth tergum; (g) Grammoptera abdominalis—microhabitat (oak branch with fruiting bodies of Vuilleminia comedens); (h) G. abdominalis—pupa in its characteristic tear-like shaped pupal cell
These results indicate the advantage of using a full range of diverse methods, which can be time standardized, provided that the research is carried out by one and the same person in all sites. The results of cluster analysis seem to confirm the effectiveness and objectivity of such standardized surveys. Namely, despite the fact that a few different sets of sites shared similar types of forest stands (e.g. fresh deciduous), the cluster analysis carried out using Ward’s method showed that in each studied case the cerambycid communities were most similar in individual pairs of sites ().
Another important aspect, along with the disputed effectiveness of various traps in longhorn beetles is the fact of unnecessary killing of thousands of other invertebrates that causes serious objections against the use of non-selective lethal traps, mostly when the rest of the material is not used for other research. This is particularly important when considering research in protected areas. Such an approach is consistent with a widely cited guide to good practice in insect collecting (Invertebrate Link —JCCBI— Citation2002), which states that “collecting should always be limited to the minimum necessary for the purpose intended”. Many British organisations and recent authors, for instance, Fischer and Larson (Citation2019), support the code. The latter indicates that the problem is not only the way in which insects are killed but also that the trapping techniques give little consideration to the importance of minimising the number of insects collected and killed. The authors consider whether the unintentional killing of many non-target species by the use of Malaise traps—which have enormous bycatch rates—obligates the research community to coordinate a global sampling regime and to create opportunities for other researchers to study all collected specimens. Issues of invertebrates protection seem to be particularly important in times of global trends of insect declines (Basset & Lamarre Citation2019; Cardoso & Leather Citation2019).
Regarding the deadwood measurements, in the unmanaged stands, due to the episodic nature of events (e.g. storms, snowfalls) that create deadwood and distribute it non-homogeneously, there were usually several plots that were similar regarding the deadwood amount, while the managed forests were generally almost empty—both because of forestry service operation and local people who illegally but frequently collect deadwood for fire. During the research, we observed several such situations when the fallen trees were removed within a few weeks (much faster than it takes for a single generation of longhorn beetles to develop, which is usually two to three years) and as such deadwood is removed so quickly it does not affect the insect fauna of these stands. Therefore, it is difficult to find a proper and objective method for assessing the amount of deadwood that is comparable between sites of different sizes. Finally, we opted to keep only the most abundant plot per each site. The fact that nature reserves accumulate much more deadwood is obvious due to the different management strategies and it is confirmed by our own observations depicted in the photographs presented in this paper, as well as the latest literature data from Polish forests (Bujoczek et al. Citation2021).
Target amounts of deadwood
Based on the results we can tell that the volume of the deadwood has a positive influence on both the species richness and abundance. However, our results about the different types of deadwood influencing species abundance were not conclusive, and the higher species abundance in sites with three (or less) and five different types of deadwood compared to those with four can be mainly linked with the presence of lying dead trees, almost absent in the middle category (except S1/S2 with a very small number of cerambycid species). According to the obtained Margalef’s diversity index values, sites with the richest cerambycid assemblages (classes I and II) were nature reserves and a Natura 2000 site. The volume of the deadwood in the measurement plots (2000 m2) within these sites was at least 13.00 m3, which would result in approx. 70 m3 per hectare. It should be emphasized, however, that this is an estimated value and the average volume of the deadwood in these areas is lower. The exclusive share of managed sites in the group of moderate biodiversity is noticeable. Among unmanaged stands, the sites B1 and S1 were ranked with the lowest biodiversity. In the first case, it is related to the monoculture character of pine stands and presumably with the short time of reserve protection (established only in 2002), while in the second case, with an almost exclusive share of beech, a tree species that is not preferred by domestic representatives of Cerambycidae, especially outside the mountainous areas. It is also noteworthy that all sites with an estimated volume of deadwood below 5 m3/ha (B2, D2, MG2) belong to the group characterized by moderate species richness. This is very similar to the results of Czerepko (Citation2008), who after analyzing numerous related publications proposed the following classification based on deadwood volume (V) per hectare: i) V ≤ 3.0 m3/ha—conditions of existence for saproxylic organisms are unsatisfactory; ii) 3.0 < V ≤ 10.0 m3/ha—conditions are satisfactory for some organisms; iii) 10.0 < V ≤ 30.0 m3/ha—conditions are good for most organisms; iv) V > 30.0 m3/ha—conditions for preserving saproxylic biodiversity are very good. This is somehow consistent with the results published by further authors, for instance: Della Rocca et al. (Citation2014)—a threshold of 35 m3/ha for saproxylic beetles, above which there is a minor increase in species richness; Bouget et al. (Citation2013)—a threshold of 46 m3/ha for saproxylic beetles—beyond this value the number of common species increased more slowly; Müller and Bütler (Citation2010)—similar peaks (20–50 m3/ha) of thresholds for saproxylic organisms for three main types of forests; Okland et al. (Citation1996)—a threshold of 23 m3/ha, below which the disappearance of some saproxylic beetle species can be observed.
Cerambycidae as bioindicators
Longhorn beetles have already been used as exclusive indicators (e.g. Maeto et al. Citation2002; Makino et al. Citation2007) but they are usually utilized as an accompanying group among the aggregate of saproxylic families (e.g. Fayt et al. Citation2006; Gutowski et al. Citation2006; Makino et al. Citation2006; Bhargava Citation2009; Sebek et al. Citation2012).
The usefulness of cambio-xylophagous representatives of Cerambycidae as effective indicators on the state of biodiversity conservation in saproxylic habitats is certainly supported by our results (cluster analysis, canonical correspondence analyses, site valorization) and the facts that (i) they constitute a well-known group of moderate-sized and relatively easily identifiable beetles, (ii) they exhibit close associations with specific forest habitats, and (iii) they are characterized by great heterogeneity of lifestyles resulting in inhabiting specific and diverse microhabitats at different forest layers. Moreover, (iv) many representatives of the family have strong requirements for the quantity and quality of wood and probably particular species of saproxylic fungi, as they almost exclusively feed on living, dying or dead trees in the larval stage. Furthermore, (v) longhorn beetles show a great range of host tree species, extending from strict monophages to broad polyphages, as well as (vi) the adults of numerous anthophilous species visit flowers to feed on nectar and pollen, which makes them easy to spot and collect.
Management practices affecting biodiversity
For species that develop in stumps, forest management favors the number and availability of this optimal microhabitat. However, the problem is stump milling, which is conducted in the subsequent years after cutting. As it was observed in the clear-cuts from the managed stand B2, most of the stumps were destroyed together with the immature stages and overwintering imagines of several cerambycid species. Consequently, the element of forest management that could promote saproxylic biodiversity, in fact, limits it by attracting fertilized females into a deadly trap. This wrong practice could easily be abandoned or even converted by leaving spread snags with a height of 3–5 meters next to the standard stumps, as it is commonly practiced in Scandinavian forests (Jonsell et al. Citation2004).
On the other hand, unintentional lateral damaging of trees done during dragging logs from the forest, which often lead to trunk scars, may benefit saproxylic species associated with such microhabitat, as observed in the case of A. mysticus and R. bicolor in M1 and MG2 stands. However, this may apply also to other valuable longhorn beetles such as Anisarthron barbipes (Schrank, 1781), Anoplodera rufipes (Schaller, 1783), Pedostrangalia revestita (Linnaeus, 1767), and Ropalopus ungaricus (Herbst, 1784) sspp. (Karpiński et al. Citation2020).
Conclusions
The results on the effects of deadwood volume on the cerambycid biodiversity indicate that the deadwood is an important factor determining both the species assemblages and their abundance, mostly through the larval development of the cambio-xylophagous longhorn beetles, although the importance of other factors is also indicated. Despite the difference in the amount of deadwood between managed and unmanaged sites, this was not reflected in differences regarding the species richness and abundance of Cerambycidae. However, it seems that the reason behind this is the high species turnover between different site pairs. Until some deadwood characteristics, like the deadwood type, had an important effect on the species abundance, whereas other deadwood characteristics were less important (i.e. decomposition class), emphasizing the importance of other factors linked with the site characteristics (e.g. dominant tree species, size). Stand characteristics, as the size of the site, can be important factors that influence its microclimate characteristics, like temperature and humidity, being important for larval development, but these factors can also determine the cerambycid species composition of these sites. In aggregate, our results indicate that the decisive factor is the type of a given habitat, in which specific cerambycid assemblages are formed, whose characteristics can be mainly influenced/determined by forest management.
To conclude, we have demonstrated that, as predicted, forest nature reserves in the studied region can harbor diverse cambio-xylophagous assemblages of the family Cerambycidae. On the other hand, a very small share of relict species may indicate that the area of these forest stands is usually too small to provide the appropriate microclimate (required by primeval forest species), characteristic for large-scale forest areas. However, further research in nature reserves protecting other habitats in other geographical regions and using other insect families as model groups should be continued in order to be able to perform a broader analysis on the importance of these protected areas for saproxylic diversity.
Supplemental Material
Download PDF (475.6 KB)Supplemental Material
Download PDF (641 KB)Supplemental Material
Download MS Excel (14.4 KB)Supplemental Material
Download JPEG Image (1.9 MB)
Supplemental Material
Download JPEG Image (1.4 MB)
Acknowledgements
The authors thank Wojciech Szczepański (Upper Silesian Museum, Poland) for his support during several field surveys and Petr Švácha (Czech Academy of Sciences, Czech Republic) for his help with identifying the larval material. Authors thank Jacek Hilszczański (Forest Research Institute, Poland) and Marek Bunalski (Poznań University of Life Sciences, Poland) for their valuable remarks on the initial version of the manuscript. Additionally, the authors are indebted to three anonymous referees, whose detailed comments helped to significantly improve the final version of this article. This research was conducted in the framework of Ph.D. thesis of the first author.
Disclosure statement
No potential conflict of interest was reported by the authors.
Supplementary material
Supplemental data for this article can be accessed here.
Additional information
Funding
Related Research Data
References
- Baselga A, Orme D, Villeger S, De Bortoli J, Leprieur F, Logez M. 2020. betapart: Partitioning beta diversity into turnover and nestedness components. R package version 1.5.2. Available: https://CRAN.R-project.org/package=betapart. Accessed Nov 2020 5.
- Basset Y, Lamarre G. 2019. Toward a world that values insects. Science 364(6447):1230–1231. DOI: 10.1126/science.aaw7071.
- Bastrup-Birk A, Neville P, Chirici G, Houston T. 2007. The BioSoil Forest biodiversity field manual. Hamburg, Germany: ICP Forests.
- Bates D, Maechler M, Bolker B, Walker S. 2015. Fitting linear mixed-effects models using lme4. Journal of Statistical Software 67(1):1–48. Accessed Oct 2019 22. DOI: 10.18637/jss.v067.i01.
- Bhargava VK 2009. Assessing the potential role of Coleoptera (Insecta) as bioindicators in Simbalbara wildlife sanctuary. PhD thesis, Himachal Pradesh: Saurashtra University, Gujarat, India.
- Borowski J. 2001. Valorization of the Białowieża primeval forest by zooindication method using tree-fungus beetles (Coleoptera). The attempt of assessment valorization of the forests in the Białowieża primeval forest by zooindication method. Szujecki, A. editors. pp. 287–317. Warsaw, Poland: SGGW Press. (in Polish).
- Boucher J, Azeria ET, Ibarzabal J, Hébert C. 2012. Saproxylic beetles in disturbed boreal forests: Temporal dynamics, habitat associations, and community structure. Écoscience 19(4):328–343. DOI: 10.2980/19-4-3503.
- Bouget C, Brustel H, Brin A, Valladares L. 2009. Evaluation of window flight traps for effectiveness at monitoring dead wood-associated beetles: The effect of ethanol lure under contrasting environmental conditions. Agricultural and Forest Entomology 11(2):143–152. DOI: 10.1111/j.1461-9563.2008.00400.x.
- Bouget C, Larrieu L, Nusillard B, Parmian G. 2013. In search of the best habitat drivers for saproxylic beetle diversity in temperate deciduous forests. Biodiversity and Conservation 22(9):2111–2130. DOI: 10.1007/s10531-013-0531-3.
- Bouget C, Parmain G. 2016. Effects of landscape design of forest reserves on saproxylic beetle diversity. Conservation Biology 30(1):92–102. DOI: 10.1111/cobi.12572.
- Bouget C, Parmain G, Gilg O, Noblecourt T, Nusillard B, Paillet Y, Gosselin F. 2014. Does a set-aside conservation strategy help the restoration of old-growth forest attributes and recolonization by saproxylic beetles? Animal Conservation 17(4):342–353. DOI: 10.1111/acv.12101.
- Bujoczek L, Bujoczek M, Zięba S. 2021. How much, why and where? Deadwood in forest ecosystems: The case of Poland. Ecological Indicators 121:107027. DOI: 10.1016/j.ecolind.2020.107027.
- Buse J, Entling MH, Ranius T, Assmann T. 2016. Response of saproxylic beetles to small-scale habitat connectivity depends on trophic levels. Landscape Ecology 31(5):939–949. DOI: 10.1007/s10980-015-0309-y.
- Byk A. 2001a. Valorization of older tree-stands in Białowieża primeval forest based on the structure of communities of beetles (Coleoptera) associated with decaying wood of standing dead tree trunks and hollows. The attempt of assessment valorization of the forests in the Białowieża primeval forest by zooindication method. Szujecki, A. editors. pp. 333–367. Warsaw, Poland: SGGW Press. (in Polish).
- Byk A. 2001b. Valorization of older tree-stands in Białowieża Primeval Forest based on the structure of communities of beetles (Coleoptera) associated with decaying wood of lying trunks and stumps. The attempt of assessment valorization of the forests in the Białowieża primeval forest by zooindication method. Szujecki, A. editors. pp. 369–393. Warsaw, Poland: SGGW Press. (in Polish).
- Cardoso P, Leather SR. 2019. Predicting a global insect apocalypse. Insect Conservation and Diversity 12(4):263–267. DOI: 10.1111/icad.12367.
- Central Register of Forms of Nature Protection. 2020. Available: http://crfop.gdos.gov.pl/CRFOP/search.jsf. Accessed Oct 2020 30.
- Czerepko J. 2008. Biodiversity condition of polish forests on the basis of monitoring plots. Synthesis of the results obtained in the framework of the biosoil forest biodiversity project. Sękocin Stary, Poland: Forest Research Institute. (in Polish).
- De Zan LR, Bellotti F, D’Amato D, Carpaneto GM. 2014. Saproxylic beetles in three relict beech forests of central Italy: Analysis of environmental parameters and implications for forest management. Forest Ecology and Management 328:229–244. DOI: 10.1016/j.foreco.2014.05.040.
- Della Rocca F, Stefanelli S, Pasquaretta C, Campanaro A, Bogliani G. 2014. Effect of deadwood management on saproxylic beetle richness in the floodplain forests of northern Italy: Some measures for deadwood sustainable use. Journal of Insect Conservation 18(1):121–136. DOI: 10.1007/s10841-014-9620-1.
- Doerfler I, Gossner MM, Müller J, Seibold S, Weisser WW. 2018. Deadwood enrichment combining integrative and segregative conservation elements enhances biodiversity of multiple taxa in managed forests. Biological Conservation 228:70–78. DOI: 10.1016/j.biocon.2018.10.013.
- Dollin PE, Majka CHG, Duinker PN. 2008. Saproxylic beetle (Coleoptera) communities and forest management practices in coniferous stands in southwestern Nova Scotia, Canada. Zookeys 2:291–336. DOI: 10.3897/zookeys.2.15.
- Eckelt A, Müller J, Bense U, Brustel H, Bußler H, Chittaro Y, Cizek L, Frei A, Holzer E, Kadej M, Kahlen M, Köhler F, Möller G, Mühle H, Sanchez A, Schaffrath U, Schmidl J, Smolis A, Szallies A, Németh T, Wurst C, Thorn S, Christensen RHB, Seibold S. 2018. “Primeval forest relict beetles” of Central Europe: A set of 168 umbrella species for the protection of primeval forest remnants. Journal of Insect Conservation 22(1):15–28. DOI: 10.1007/s10841-017-0028-6.
- Fayt P, Dufrene M, Branquart E, Hastir P, Pontegnie C, Henin JM, Versteirt V. 2006. Contrasting responses of saproxylic insects to focal habitat resources: The example of longhorn beetles and hoverflies in Belgian deciduous forests. Journal of Insect Conservation 10(2):129–150. DOI: 10.1007/s10841-006-6289-0.
- Fischer B, Larson BMH. 2019. Collecting insects to conserve them: A call for ethical caution. Insect Conservation and Diversity 12(3):173–182. DOI: 10.1111/icad.12344.
- Forest Data Bank. 2017. Available: www.bdl.lasy.gov.pl/portal/mapy-en. Accessed May 2017 12.
- Głowaciński Z, Nowacki J. 2004. Polish red data book of animals. Invertebrates. Kraków, Poland: IOP PAN.
- Gossner MM, Floren A, Weisser WW, Linsenmair KE. 2013. Effect of dead wood enrichment in the canopy and on the forest floor on beetle guild composition. Forest Ecology and Management 302:404–413. DOI: 10.1016/j.foreco.2013.03.039.
- Gossner MM, Wende B, Levick S, Schall P, Floren A, Linsenmair KE, Steffan-Dewenter I, Schulze ED, Weisser WW. 2016. Deadwood enrichment in European forests – Which tree species should be used to promote saproxylic beetle diversity? Biological Conservation 201:92–102. DOI: 10.1016/j.biocon.2016.06.032.
- Greń C, Królik R, Szołtys H. 2012. The red list of beetles (Coleoptera) of the Silesian Voivodship. reports opinions 6. Conservation strategy of nature of the Silesian Voivodship by 2030. Report on the state of nature of the Silesian Voivodship 4. Parusel, J.B. editors. pp. 37–70. Katowice, Poland: Upper Silesian Nature Heritage Center. (in Polish).
- Grove SJ. 2002. Saproxylic insect ecology and the sustainable management of forests. Annual Review of Ecology, Evolution, and Systematics 33(1):1–23. DOI: 10.1146/annurev.ecolsys.33.010802.150507.
- Gutowski JM, Buchholz L, Kubisz D, Ossowska M, Sućko K. 2006. Saproxylic beetles as indicator of deformation of pine forest ecosystems. Leśne Prace Badawcze 4:101–144. (in Polish).
- Gutowski JM, Kubisz D, Sućko K, Zub K. 2010. The succession of saproxylic beetles (Coleoptera) on windthrow areas in the Scots pine stands of the Piska Forest. Leśne Prace Badawcze 71(3):279–298. (in Polish).
- Heikkala O, Seibold S, Koivula M, Martikainen P, Müller J, Thorn S, Kouki J. 2016. Retention forestry and prescribed burning result in functionally different saproxylic beetle assemblages than clear-cutting. Forest Ecology and Management 359:51–58. DOI: 10.1016/j.foreco.2015.09.043.
- Hilszczański J, Gibb H, Bystrowski C. 2007. Insect natural enemies of Ips typographus (L.) (Coleoptera, Scolytinae) in managed and unmanaged stands of mixed lowland forest in Poland. Journal of Pest Science 80(2):99–107. DOI: 10.1007/s10340-006-0160-7.
- Hjältén J, Stenbacka F, Pettersson RB, Gibb H, Johansson T, Danell K, Ball JP, Hilszczański J. 2012. Micro and macro-habitat associations in saproxylic beetles: Implications for biodiversity management. PloS One 7(7):e41100. DOI: 10.1371/journal.pone.0041100.
- Holland JD. 2007. Sensitivity of Cerambycid biodiversity indicators to definition of high diversity. Biodiversity and Conservation 16(9):2599–2609. DOI: 10.1007/s10531-006-9066-1.
- Horák J, Chumanová E, Hilszczański J. 2011. Saproxylic beetle thrives on the openness in management: A case study on the ecological requirements of Cucujus cinnaberinus from Central Europe. Insect Conservation and Diversity 5(6):403–413. DOI: 10.1111/j.1752-4598.2011.00173.x.
- Interactive map of RDST in Katowice. 2017. Available: http://mapa.katowice.lasy.gov.pl/. Accessed Apr 2017 5.
- Invertebrate Link (JCCBI). 2002. A code of conduct for collecting insects and other invertebrates. British Journal of Entomology and Natural History 15(1):1–6.
- Jaworski T, Plewa R, Tarwacki G, Sućko K, Hilszczański J, Horák J. 2019. Ecologically similar saproxylic beetles depend on diversified deadwood resources: From habitat requirements to management implications. Forest Ecology and Management 449:117462. DOI: 10.1016/j.foreco.2019.117462.
- Jonsell M, Nitterus K, Stighäll K. 2004. Saproxylic beetles in natural and man-made deciduous high stumps retained for conservation. Biological Conservation 118(2):163–173. DOI: 10.1016/j.biocon.2003.08.017.
- Karpiński L, Rutkowski T, Szczepański WT. 2017. First record of phoresy of Dendrochernes cyrneus (L. Koch, 1873) (Pseudoscorpiones, Chernetidae) on Cerambyx cerdo Linnaeus, 1758 (Coleoptera, Cerambycidae) and their potential value as bioindicators. Animal Biodiversity and Conservation 40(2):187–192. DOI: 10.32800/abc.2017.40.0187.
- Karpiński L, Szczepański WT, Kruszelnicki L. 2020. Revision of the Ropalopus ungaricus/insubricus group (Coleoptera: Cerambycidae: Callidiini) from the western Palaearctic region. Zoological Journal of the Linnean Society 189(4):1176–1216. DOI: 10.1093/zoolinnean/zlz154.
- Lachat T, Chumak M, Chumak V, Jakoby O, Müller J, Tanadini M, Wermelinger B. 2016. Influence of canopy gaps on saproxylic beetles in primeval beech forests: A case study from the Uholka-Shyrokyi Luh forest, Ukraine. Insect Conservation and Diversity 9(6):559–573. DOI: 10.1111/icad.12188.
- Lachat T, Peveling R, Atignon S, Goergen G, Sinsin B, Nagel P. 2007. Saproxylic beetle assemblages on native and exotic snags in a West African tropical forest. African Entomology 15(1):13–24. DOI: 10.4001/1021-3589-15.1.13.
- Lachat T, Wermelinger B, Gossner MM, Bussler H, Isacsson G, Müller J. 2012. Saproxylic beetles as indicator species for dead-wood amount and temperature in European beech forests. Ecological Indicators 23:323–331. DOI: 10.1016/j.ecolind.2012.04.013.
- Lassauce A, Paillet Y, Jactel H, Bouget C. 2011. Deadwood as a surrogate for forest biodiversity: Meta-analysis of correlations between deadwood volume and species richness of saproxylic organisms. Ecological Indicators 11(5):1027–1039. DOI: 10.1016/j.ecolind.2011.02.004.
- Maeto K, Sato S, Miyata H. 2002. Species diversity of longicorn beetles in humid warm-temperate forests: The impact of forest management practices on old-growth forest species in south-western Japan. Biodiversity and Conservation 11(11):1919–1937. DOI: 10.1023/A:1020849012649.
- Makino S, Goto H, Hasegawa M, Okabe K, Tanaka H, Inoue T, Okochi I. 2007. Degradation of longicorn beetle (Coleoptera, Cerambycidae, Disteniidae) fauna caused by conversion from broad-leaved to man-made conifer stands of Cryptomeria japonica (Taxodiaceae) in central Japan. Ecological Research 22(3):372–381. DOI: 10.1007/s11284-007-0359-y.
- Makino S, Goto H, Inoue T, Sueyoshi M, Okabe K, Hasegawa M, Hamaguchi K, Tanaka H, Okochi I. 2006. The monitoring of insects to maintain biodiversity in Ogawa forest reserve. Environmental Monitoring and Assessment 120(1–3):477–485. DOI: 10.1007/s10661-005-9074-8.
- Margalef R. 1958. Information theory in ecology. International Journal of General Systems 3:36–71.
- Martikainen P, Siitonen J, Punttila P, Kaila L, Rauh J. 2000. Species richness of Coleoptera in mature managed and old-growth boreal forests in southern Finland. Biological Conservation 94(2):199–209. DOI: 10.1016/S0006-3207(99)00175-5.
- Mokrzycki T. 2001. Valorization of older tree-stands in Białowieża primeval forest by zooindication method based on saproxylic beetle assemblages of trunks surface. The attempt of assessment valorization of the forests in the Białowieża primeval forest by zooindication method. Szujecki, A. editors. pp. 267–285. Warsaw, Poland: SGGW Press. (in Polish).
- Müller J, Brustel H, Brin A, Bussler H, Bouget C, Obermaier E, Heidinger IMM, Lachat T, Förster B, Horak J, Procházka J, Köhler F, Larrieu L, Bense U, Isacsson G, Zapponi L, Gossner MM. 2014. Increasing temperature may compensate for lower amounts of dead wood in driving richness of saproxylic beetles. Ecography 38(5):499–509. DOI: 10.1111/ecog.00908.
- Müller J, Bußler H, Bense U, Brustel H, Flechtner G, Fowles A, Kahlen M, Möller G, Mühle H, Schmidl J, Zabransky P. 2005. Urwald relict species – Saproxylic beetles indicating structural qualities and habitat tradition. Waldoekologie Onlinae 2:106–116.
- Müller J, Bütler R. 2010. A review of habitat thresholds for dead wood: A baseline for management recommendations in European forests. European Journal of Forest Research 129(6):981–992. DOI: 10.1007/s10342-010-0400-5.
- Müller J, Wende B, Strobl C, Eugster M, Gallenberger I, Floren A, Steffan-Dewenter I, Linsenmair KE, Weer WW, Gossner MM. 2015. Forest management and regional tree composition drive the host preference of saproxylic beetle communities. Journal of Applied Ecology 52(3):753–762. DOI: 10.1111/1365-2664.12421.
- Nieto A, Alexander KNA. 2010. European red list of saproxylic beetles. Luxembourg City, Luxembourg: Publications Office of the European Union.
- Ohsawa M. 2010. Beetle families as indicators of Coleopteran diversity in forests: A study using Malaise traps in the central mountainous region of Japan. Journal of Insect Conservation 14(5):479–484. DOI: 10.1007/s10841-010-9276-4.
- Okland B, Bakke A, Hagvar S, Kvamme T. 1996. What factors influence the diversity of saproxylic beetles? A multiscaled study from a spruce forest in southern Norway. Biodiversity and Conservation 5(1):75–100. DOI: 10.1007/BF00056293.
- Oksanen J, Blanchet FG, Friendly M, Kindt R, Legendre P, McGlinn D, Minchin PR, O’Hara RB, Simpson GL, Solymos P, Stevens MHH, Szoecs E, Wagner H. 2019. Vegan: community ecology package. R package version 2.5-6. Available: https://CRAN.R-project.org/package=vegan. Accessed May 2020 22.
- Pawłowski J, Kubisz D, Mazur SM. 2002. Coleoptera – beetles. Red list of threatened animals in Poland. Głowaciński, Z. editors. Cracow, Poland: IOP PAN. pp. 88–110.
- R Core Team. 2019. R: A language and environment for statistical computing. R foundation for statistical computing. Vienna, Austria. Available: https://www.R-project.org/.
- Ramanathan V, Feng Y. 2009. Air pollution, greenhouse gases and climate change: Global and regional perspectives. Atmospheric Environment 43(1):37–50. DOI: 10.1016/j.atmosenv.2008.09.063.
- Rassati D, Marini L, Marchioro M, Rapuzzi P, Magnani G, Poloni R, Di Giovanni F, Mayo P, Sweeney JD. 2019. Developing trapping protocols for wood boring beetles associated with broadleaf trees. Journal of Pest Science 92(1):267–279. DOI: 10.1007/s10340-018-0984-y.
- Russell L. 2019. Emmeans: Estimated marginal means, Aka LEAST-squares means. 2019 R Package Version 1.4.2. Available: https://CRAN.R-project.org/package=emmeans. Accessed Oct 2019 22.
- RWMŚ GIOŚ. 2019. An annual assessment of air quality in the Silesian Voivodeship. Available: http://powietrze.gios.gov.pl/pjp/documents/download/103141. Accessed Oct 28 2020. in Polish.
- Sebek P, Barnouin T, Brin A, Brustel H, Dufrêne M, Gosselin F, Meriguet B, Micas L, Noblecourt T, Rose O, Velle L, Bouget C. 2012. A test for assessment of saproxylic beetle biodiversity using subsets of “monitoring species”. Ecological Indicators 20:304–3015. DOI: 10.1016/j.ecolind.2012.02.033.
- Seibold S, Bässler C, Brandl R, Büche B, Szallies A, Thorn S, Ulyshen MD, Müller J. 2016. Microclimate and habitat heterogeneity as the major drivers of beetle diversity in dead wood. Journal of Applied Ecology 53(3):934–943. DOI: 10.1111/1365-2664.12607.
- Seibold S, Bässler C, Brandl R, Gossner MM, Thorn S, Ulyshen MD, Müller J. 2015. Experimental studies of dead-wood biodiversity – A review identifying global gaps in knowledge. Biological Conservation 191:139–149. DOI: 10.1016/j.biocon.2015.06.006.
- Speight MCD. 1989. Saproxylic invertrebrates and their conservation. Nature and environment. Strasbourg, France: Council of Europe Publishing.
- Stokland JN, Siitonen J, Jonsson BG. 2012. Biodiversity in dead wood. New York City, US: Cambridge University Press.
- Sugiura S, Tsuru T, Yamaura Y, Makihara H. 2009. Small off-shore islands can serve as important refuges for endemic beetle conservation. Journal of Insect Conservation 13(4):377–385. DOI: 10.1007/s10841-008-9185-y.
- Švácha P, Danilevsky ML. 1987. Cerambycoid larvae of Europe and Soviet Union (Coleoptera, Cerambycoidea). Part 1. Acta Universitatis Carolinae. Biologica 30:1–186.
- Švácha P, Danilevsky ML. 1988. Cerambycoid larvae of Europe and Soviet Union (Coleoptera, Cerambycoidea). Part II. Acta Universitatis Carolinae. Biologica 31(3–4):121–284.
- Švácha P, Danilevsky ML. 1989. Cerambycoid larvae of Europe and Soviet Union (Coleoptera, Cerambycoidea). Part III. Acta Universitatis Carolinae. Biologica 32(1–2):1–205.
- Sweeney J, De Groot P, MacDonald L, Smith S, Cocquempot C, Kenis M, Gutowski JM. 2004. Host volatile attractants and traps for detection of Tetropium fuscum (F.), Tetropium castaneum L., and other longhorned beetles (Coleoptera: Cerambycidae). Environmental Entomology 33(4):844–854. DOI: 10.1603/0046-225X-33.4.844.
- Ward Jr. JH. 1963. Hierarchical grouping to optimize an objective function. Journal of the American Statistical Association 58(301):236–244. DOI: 10.1080/01621459.1963.10500845.
- Weslien J, Schroeder LM. 1999. Population levels of bark beetles and associated insects in managed and unmanaged spruce stands. Forest Ecology and Management 115(2–3):267–275. DOI: 10.1016/S0378-1127(98)00405-8.
- Wong JC, Hanks LM. 2016. Influence of fermenting bait and vertical position of traps on attraction of cerambycid beetles to pheromone lures. Journal of Economic Entomology 109(5):2145–2150. DOI: 10.1093/jee/tow197.
- Wu J, Pan H, Yang SZ, Niu X. 2013. Tree species and elevation influence the assemblage composition of saproxylic beetles in subtropical forest of east China. Forest Ecology and Management 292:29–38. DOI: 10.1016/j.foreco.2012.12.004.
- Wu J, Pan H, Zhang J, Yang SZ, Zhao MS. 2015. Effect of sun exposure on saproxylic beetle assemblages may change with topoclimate in a subtropical forest of east China. Journal of Insect Conservation 19(5):877–889. DOI: 10.1007/s10841-015-9805-2.