
Abstract
Whale sharks are known to aggregate in coastal areas. In the South Ari Marine Protected Area (Maldives) a aggregation, mostly represented by young males with a high level of residency, has been described in the literature. Despite the worldwide interest in the natural resources of the Maldives, this population is increasingly subjected to anthropogenic pressure and major concern regards the flourishing tourist industry. In this study, data collected by the Maldives Whale Shark Research Programme between 2014 and 2017 have been used to detect both temporal and spatial patterns of occurrence. Favourable environmental conditions to visually detect whale sharks have been defined for the studied area. Accordingly, a total of 1077 shark encounters have been analysed in this study. Environmental conditions (i.e. sea surface temperature, monsoon occurrence) have been used to detect possible factors affecting the spatial and temporal variability of Rhincodon typus aggregations. A two-way ANOVA has been performed to detect temporal trends in animal occurrence, sea surface temperature pattern and to investigate the sea bottom depth variability during encounters. Significant differences in the monthly occurrence of whale sharks within the same year and among different years have been detected. Similar patterns have been observed for environmental parameters such as sea surface temperature and depth. A different spatial distribution has also been detected as a function of the Indian Monsoon reversal (north-eastern and south-western) affecting the area. During the northeast monsoon period, whale sharks appeared to concentrate in a smaller longitudinal range closer to the western-central part of the MPA, where deeper water conditions occur due to the proximity of a deep depression (submarine canyon). Results from this study provide new pieces of information for the implementation of dedicated management actions to protect the whale sharks population inhabiting the South Ari Marine Protected Area.
1. Introduction
The whale shark (Rhincodon typus, Smith 1828) is the largest shark on earth (Pierce & Norman, Citation2016) and one of three known planktivorous shark living species (Colman Citation1997; Compagno Citation2001; Rowat & Brooks Citation2012). The species occurs seasonally in coastal and oceanic-pelagic environments of the circumtropical, tropical, and warm temperate waters between 30°N to 35°S, both in the Atlantic and Indo-Pacific Oceans (Colman Citation1997; Compagno Citation2001; Rowat & Brooks Citation2012; Sequeira et al. Citation2014a).
Most of the knowledge about the species ecology is limited to coastal areas, where whale sharks seasonally aggregate for foraging on a variety of prey, including spawning fish, zooplankton blooms, baitfish, and crab larvae (Graham et al. Citation2005; Meekan et al. Citation2009; Rowat & Brooks Citation2012; Robinson et al. Citation2013; Pierce & Norman Citation2016; Copping et al. Citation2018; Boldrocchi & Bettinetti Citation2019). In these feeding areas, individuals of different sizes and genders have been observed (Aca & Schmidt Citation2011; Ketchum et al. Citation2013; Cochran et al. Citation2019; Whitehead et al. Citation2020; Allen et al. Citation2021). Due to their feeding and thermoregulatory behaviours (Thums et al. Citation2013), whale sharks spend a large amount of time in proximity to the surface, making them easier to spot but also leaving them exposed to various dangers (Boldrocchi et al. Citation2020; Allen et al. Citation2021). Currently, whale sharks are listed as “Endangered” by the International Union for Conservation of Nature (IUCN) Red List of Threatened species and in Appendix II of the Convention on International Trade in Endangered Species (CITES), as a result of a severe decline of its population (>50%) over the last 75 years due to the past overfishing (Schmidt et al. Citation2009; Pierce & Norman Citation2016).
Owing to their life history (i.e., long lifespan, late maturity, and slow growth) and habitat use, sharks are exposed to pressure coming from different anthropogenic activities and therefore are subject to a higher risk of extinction if compared to other vertebrates (Lieber et al. Citation2020). The main threats are represented by targeted harvesting (Li et al. Citation2012; Cochran et al. Citation2016; Perry et al. Citation2018), bycatch, illegal fishing, habitat modification, vessel strikes (Speed et al. Citation2008), and contaminant exposure (Boldrocchi et al. Citation2020).
Globally, whale sharks are also an important socioeconomic source. Shark watching or “swimming with whale sharks” are profitable activities in many countries (Gallagher & Hammerschlag Citation2011; Araujo et al. Citation2017). However, unregulated ecotourism can be a source of disturbance thus threatening the well-being of whale sharks (Quiros Citation2007; Trujillo-Córdova et al. Citation2016; Araujo et al. Citation2017; Allen et al. Citation2021; Harvey-Carroll et al. Citation2021). The establishment of Marine Protected Areas (MPAs) and the regulation of activities within their borders are known to bring both mid- and long- term benefits to marine biodiversity (FAO Citation2007; West et al. Citation2009; Ibarra-García et al. Citation2017). MPAs are also widely considered a critical conservation tool for the protection of many elasmobranch species (Davidson & Dulvy Citation2017; Rigby et al. Citation2019; Birkmanis et al. Citation2020).
In the coastal waters of the Republic of Maldives, whale sharks are seasonally present and show a semi-annual residency pattern. They move along the western atolls during the northeast monsoon (from December to April), and along the eastern atolls during the southwest monsoon (from May to November) (Anderson & Ahmed Citation1993; Riley et al. Citation2010; Anderson et al. Citation2011; Cagua et al. Citation2014; Donati et al. Citation2016). Movements of whale sharks along the double chains of atolls of the Maldives, appear to be affected principally by the seasonal variability in productivity (Anderson et al. Citation2011) and by ocean currents (Anderson & Ahmed Citation1993; Wilson et al. Citation2001). The south region of Ari Atoll (Alif Dhaalu Atoll) represents an exception compared to the other atolls in the Maldives. Indeed, although the driver of aggregation has not to be defined yet, this area hosts year-long aggregations, mainly composed of juvenile males (Riley et al. Citation2010; Donati et al. Citation2016; Perry et al. Citation2018; Allen et al. Citation2021; Harvey-Carroll et al. Citation2021). The high re-sighting rate of some individuals suggests a high site fidelity over the years, and the absence of adult, neonates, and female indicates that this area might be a “secondary nursery area” and a developmental habitat for juvenile males (Perry et al. Citation2018; Allen et al. Citation2021; Harvey-Carroll et al. Citation2021). To protect this species, the Government of Maldives banned hunting of the whale sharks in 1995 (Cagua et al. Citation2014) and the fishing industry has been replaced with ecotourism (Zimmerhackel et al. Citation2019; Harvey-Carroll et al. Citation2021). In 2009, the South Ari Marine Protected Area (SAMPA, Ari Atoll, Maldives) was established as the largest Maldivian area to specifically protect the whale shark aggregation present in the Ari Atoll (Environmental Protection Agency, Cagua et al. Citation2014; Stevens et al. Citation2015; EPA Citation2019), and to promote long-term human well-being by protecting the marine ecosystem (Rasheed & Abdulla Citation2020). In the SAMPA, as in the entire Maldives, the regular presence of whale sharks represents a profitable attraction, as this involves thousands of people every year engage in “whale sharks’ excursions” (Cagua et al. Citation2014) and therefore, ecotourism has become an integral part of conservation strategies (Sanzogni et al. Citation2015). Despite the agreements between stakeholders, the management planning in the SAMPA is yet to be implemented (Cagua et al. Citation2014; Rasheed et al. Citation2016; EPA Citation2019; Rasheed & Abdulla Citation2020) therefore whale sharks are still considered at risk as showered by the high number of injured individuals (i.e., presenting collision marks) reported in the SAMPA area (Allen et al. Citation2021; Harvey-Carroll et al. Citation2021).
More extensive knowledge about whale shark’s populations is necessary to develop effective management and conservation actions that account for the protection of the different life stages of animals (West et al. Citation2009; Grüss et al. Citation2011; Breen et al. Citation2015; Haupt et al. Citation2017) and their habitats (Haupt et al. Citation2017; Copping et al. Citation2018). Understanding whale shark presence and use of the habitat is a key issue to inform decision-making processes that aim to implement the dedicated management actions and to support any future conservation plans at the MPA level (Heupel et al. Citation2014). Therefore, this study aims to provide additional pieces of information on the whale shark occurrence in the SAMPA by investigating the temporal and spatial variability of this species within and between different seasons.
2. Materials and methods
2.1. Study area
The study area is located within the waters of the SAMPA (Latitude range: 3°38′10 N – 3°32′15 N; Longitude range: 72°42′18E – 72°55′58E) (Rasheed et al. Citation2016) in the southern part of the Ari Atoll (), the largest atoll of the Maldives (Gischler Citation2006). The SAMPA boundaries extend along the seaward fringe of South Ari atoll and comprise the adjacent 1 km buffer zone, moving from Dhigurah Island to Rangali Island, from east to north-west, for a total area of 42 km2. The MPA includes four islands (Dhigurah, Maamigili, Dhiddhoo, and Fenfushi), resort islands reefs (Rasheed & Abdulla Citation2020) and a pass area where the lagoon communicates with the channel Ariadhoo kandu between Ari Atoll and North Nilandhe Atoll.
Figure 1. Map of South Ari Marine Protected Area (SAMPA) – The map shows the 1 km buffer zone defined by the MPA and isobaths; it is possible to note the differences of depths between Dhigurah and Fenfushi Islands
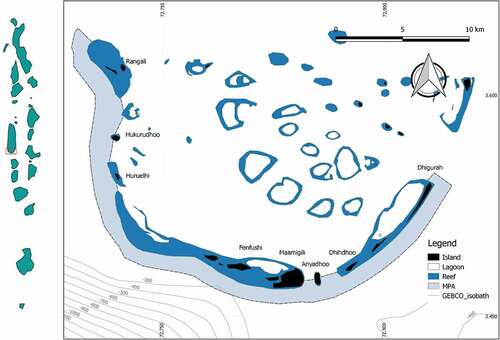
Bathymetry is relatively shallow within the atolls and lagoons if compared to the open ocean. Lagoons can reach 50–60 m of depth, oceanward margins up to 2000 m, while the inner seaside reaches a few hundred meters (Fürstenau et al. Citation2010; Betzler et al. Citation2016). The depth of the channel Ariadhoo kandu ranges from about 400 m to 1000 m from east to west.
The forereef shows the same geomorphological characteristics typical of the atolls of the Maldives (Fürstenau et al. Citation2010; Betzler et al. Citation2016). The northeast-southwest sector (from Dhigurah to Dhiddhoo) is characterized by a narrow and steep forereef, whereas the east-west sector (from Maamigili to Rangali) displays a larger and gentler slope. The slope, here, is interrupted between Maamigili and Fenfushi islands, close to the edge of the buffer zone, by an abrupt reef slope that leads to deep waters ().
Climate and hydrography are strongly influenced by the Indian Monsoon reversal (Gischler et al. Citation2014; Betzler et al. Citation2016). Notably, the area experiences two monsoons annually. The southwest monsoon blows from May to November; it brings increased average rainfall, wind speeds, and cloud cover, which causes rougher seas, and a dominant current that flows from west to east. The northeast monsoon, on the contrary, blows from December to April, it brings blue skies, calm and clear waters for most of the time, with the dominant current flowing from east to west (Anderson & Ahmed Citation1993; Wilson et al. Citation2001; Rowat Citation2007; Stevens et al. Citation2015; Betzler et al. Citation2016).
2.2. Research effort
The Maldives Whale Shark Research Programme (MWSRP) is the only long-term research-based conservation charity dedicated to the study of whale sharks in the Maldives, and it has conducted annual research and surveys in the area since 2012.
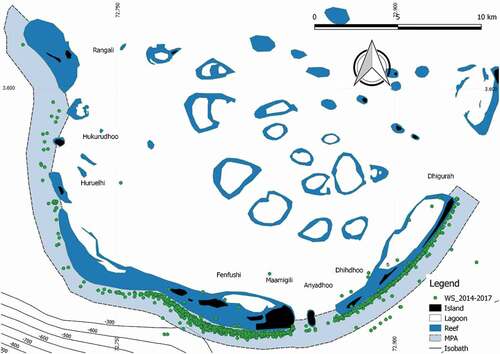
Surveys were undertaken along the outer reef within the MPA, on board a 15 meters wooden hull motorized local boat, called dhoni, following protocols described by Riley et al. (Citation2010). Transect routes were designed parallel to the upper margin of the forereef drop off and they followed two directions: from northeast to southwest and from southwest to northeast, starting from and returning to Dhigurah Island (see ). The extension, number, and time (start and ending time) of the surveyed transects varied, depending on the daily weather conditions, mainly due to any possible rough navigational conditions during both monsoon seasons. Visual effort was conducted, during daylight hours, by three trained team members that looked, from the upper deck, for a dark silhouette underwater or the dorsal fin tips of a whale shark at the surface.
2.2.1. Environmental data
During each encounter, the following data were collected: i) general data (i.e., date, time, position) and ii) environmental data such as cloud coverage (classified as clear, partially covered, totally covered), wind speed (using Beaufort scale) and direction.
In-situ Sea Surface Temperature (SST, °C) was collected from the lower deck of the boat, using a digital thermometer.
Derived Sea Surface Temperature (hereafter called SST_SAMPA) from remote sensing (MODIS, monthly average at 4 km resolution), and monthly rate precipitations (Tropical Rainfall Measuring Mission 2011 and TMPA/3B43 Rainfall Estimate, 0.25 degree x 0.25 degree spatial grid) were also extracted from the NASA Ocean Biology Processing Group (OBPG) through the Giovanni system
(©Giovanni.gsfc.nasa.gov - https://giovanni.gsfc.nasa.gov/giovanni/-).
Depth data were obtained from the General Bathymetric Chart of the Oceans (GEBCO, 2014, 30 arcsec spatial grid resolution) ().
Table I. Summary of environmental data used for analysis
2.3. Data preparation for the analysis
This study analysed data collected between 4 years, 2014 and 2017, and only during months presenting more than 6 research days were considered. It is well known that weather conditions could affect the detectability of marine vertebrates (e.g., cetaceans - Reid et al. Citation2003; Evans & Hammond Citation2004; Dunshea et al. Citation2020; seabirds - Webb & Durinck Citation1992; turtles - Eguchi et al. Citation2007; and sharks - Sims et al. Citation2005). Therefore, to reduce the bias induced by the heterogeneity in sampling conditions, only data collected in standardized Favourable Environmental Conditions (hereafter called FEC) were considered in this study.
FEC are defined as i) wind speed not exceeding 3 in the Beaufort scale, and ii) clear or partial cloud coverage of the sky. These criteria, from Sims et al. (Citation2005), allowed to characterize the most favourable condition to detect whale sharks during boat surveys in the SAMPA.
In this study, Sightings Per Unit Effort (SPUE) was calculated, for each month and year, as the number of whale shark encounters collected in FEC per day of research effort.
Sightings collected between May and November were classified as collected under the influence of the southwest Monsoon, whereas those collected from December to April under the influence of the northeast Monsoon based on Anderson and Ahmed (Citation1993).
2.3.1. Data analysis
The temporal variability in the SPUE among the years and months, as well as the SST variability, were investigated by using a two-way ANOVA that allowed estimating the effect of two factors on a continuous dependent variable. The relationship between environmental variables and their association has been investigated using Pearson’s Correlation coefficient.
Differences in the position (descriptive statistics of latitude and longitude and depth) of the whale sharks as a function of the Indian Monsoon reversal (north-eastern and south-western) were investigated using a Kruskall Wallis test.
Maps were generated using the software QGIS (Version 2.18.16) and all statistical analyses were undertaken using SPSS Statistics (version 25, IBM, New York, USA, https://www.ibm.com/it-it/products/spss-statistics).
3. Results
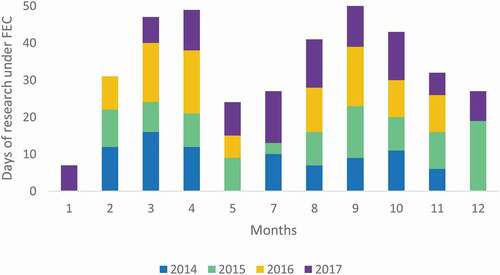
Between 2014 and 2017, a total of 451 research days were conducted by MWSRP reporting 1244 whale shark sightings (). Research days varied among the years, with a minimum of 93 days recorded in 2014 and a maximum of 124 days in 2017, with a monthly average of 12.5 days (). FEC conditions were respected 84% of the days (n = 378).
Table II. Total numbers of days at sea, days under favourable environmental conditions and encounters during the whole study period
Figure 2. Total number of encounters during the whole study period
Out of the total number of sightings, 1077 (86%) were collected in FEC, with a yearly average of 269 encounters, a minimum of 247 in 2015, and a maximum of 283 encounters in 2014 ( - ). Only 167 sightings were reported with unfavourable environmental conditions throughout the entire research period. These sightings were excluded from the analysis.
Figure 3. Number of research days under Favourable Environmental Conditions (FEC) per month and per year
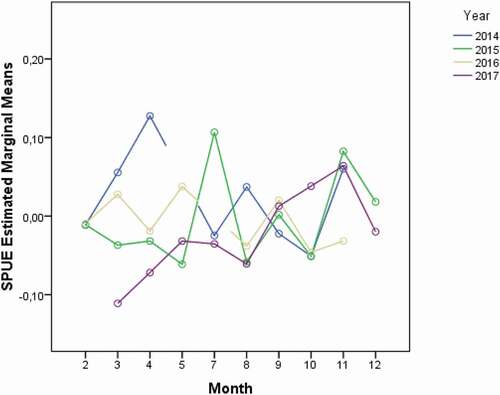
3.1. Temporal variability of SPUE
The two-way ANOVA did not show any significant difference (P-level > 0.05) in the SPUE amongst different years (see and ). Conversely, differences in the monthly occurrence of the species were identified (). Specifically, the occurrence of whale sharks was significantly different among months of the same year (P-level < 0.01) and between the same months of different years (P-level < 0.01) ().
Table III. Two-way ANOVA – SPUE variability between years, months of the same year, and months of different years. Significant results are highlighted in bold
Figure 4. Box plot showing whale sharks sighting per unit effort (SPUE) during the study period (2014–2017)
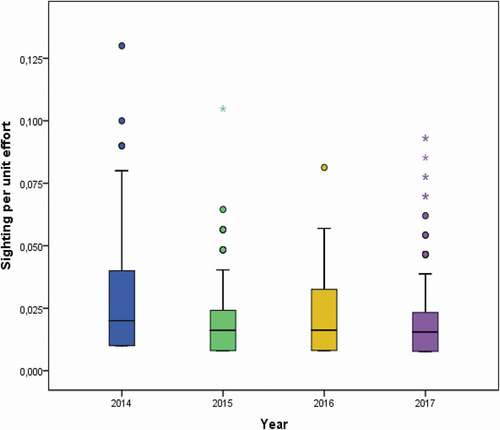
Figure 5. Whale sharks sighting per unit effort (SPUE) monthly variability across the years (2014–2017)
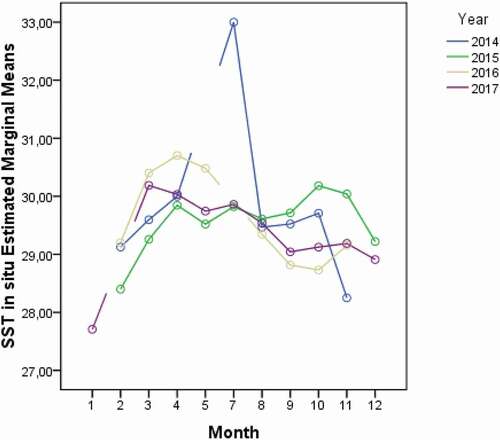
In the attempt to explain these results, the variability of the in situ SST (°C) (averaged values across the time period: mean = 29.5 ± 0.04; median = 29.5; min = 27; max = 33; SD = 0.78) was tested againts time (months, years). As for the SPUE, the analysis showed significant differences in the average values of in situ SST between years (P-level < 0.01), months of the same year (P-level < 0.01) and months of different years (P-level < 0.01) (; ).
Table IV. Two-way ANOVA – SST variability between years, months of the same year, and months of different years. Significant results are highlighted in bold
Figure 6. Sea Surface Temperature (SST; °C) monthly variability across the years (2014–2017)
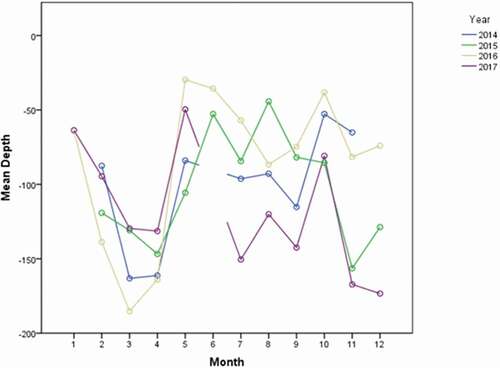
The variability of average sea bottom depth in the areas, where encounters occurred, was also tested on a yearly and monthly basis (averaged values across the time period: mean = 115 ± 2.6; median = 92; min = 3; max = 342; SD = 86). The analysis showed significant differences in the average values of depth between years (P-level < 0.01), months of the same year (P-level < 0.01), and months of different years (P-level < 0.01) (, ).
Table V. Two-way ANOVA - Depth variability between years, months of the same year, and months of different years. Significant results are highlighted in bold
Figure 7. Depth (m) monthly variability across the years (2014–2017)
3.2. Correlations between SPUE and environmental variables
No significant correlation between in-situ SST and SPUE was observed (P-level > 0.05), however, a significant correlation between monthly average of in-situ SST and derived SST_SAMPA was detected (Pearson correlation N = 36; r = 0.5; P-level < 0.05). Therefore, the relation of SPUE with SST_SAMPA, collected by remote sensing was tested. An inverse correlation close to the significant level was found between average monthly values of SST_SAMPA and SPUE (Pearson correlation N = 36; r = −0.31; P-level = 0.06). This could be due to the temporal resolution of the remote sensing data. However, no significant linear relationship was found between sea surface temperature and the occurrence of whale sharks. Finally, the analysis showed a significant inverse correlation between the SPUE and the monthly average values of precipitation (mm/month) derived from remote sensing (Pearson correlation N = 36; r = −0.6; P-level < 0.05).
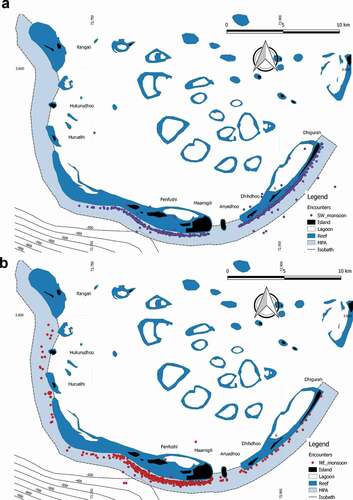
3.3. Spatial variability of the encounters during Indian Monsoons
A significant inverse correlation between the SPUE and the monthly average values of precipitation (mm/month) derived from remote sensing (Pearson correlation N = 36; r = −0.6; P-level < 0.05) was observed. To further investigate this result, the position (latitude and longitude) of the encounters were compared during the two Indian monsoons seasons (north-eastern, N = 499; SD = 84 and south-western, N = 569; SD = 81). During the northeast monsoon season, encounters occurred in areas with average depth of about 140 m while during the southwestern monsoon they occured in areas with shallower depths, at average depth of 93 m. The difference in latitudinal variability in whale shark’s encounters was statistically significant (H = 136.8; df = 1; P-level < 0.001) ().
Figure 8. Position of whale sharks encounters during the southwest (a) and the northeast (b) monsoon
4. Discussion
This study provided new information on the temporal and spatial variation of whale sharks aggregation within the South Ari Marine Protected Area (SAMPA, Maldives). Different studies on whale sharks were focused on understanding animal occurrence and distribution throughout ocean-basins scale (Sequeira et al. Citation2012, Citation2013, Citation2014a, Citation2014b). Several species of sharks are pelagic and they travel great distances in high seas areas where their conservation is extremely difficult or almost impossible. By protecting critical habitats for reproduction and feeding, MPAs can play an important role in their conservation (Norse Citation2010; Escalle et al. Citation2015). However, substantial uncertainty remains regarding the effectiveness of MPAs and their specific benefits to sharks’ populations (MacKeracher et al. Citation2019). In this framework, there is a growing demand from MPA managers to supply more accurate results on the occurrence and distribution of target species in order to develop appropriate conservation actions, especially for small scale MPAs (<100 km2) (Rigby et al. Citation2019). Results presented in this study allow to better understand the monthly variability of species occurrence at SAMPA site, and to further investigate potential drivers of occurrence of whale sharks in the area.
4.1. The importance of environmental conditions
The present study is the first to include environmental conditions to assess whale sharks relative abundance (expressed as SPUE) in the area, through the application of criteria previously used to study basking sharks (Sims et al. Citation2005). Results show that most of the encounters (86% of the dataset) occurred in favourable environmental conditions for visual detection from the surface (wind speed < than 3 Beaufort; clear or partial cloud coverage of the sky). The exclusion of data for which FEC requirements were not met, allowed to minimize biases induced by the research effort (i.e., reducing false negative encounters), as weather conditions could affect the detectability of many marine species (e.g., cetaceans (Reid et al. Citation2003; Evans & Hammond Citation2004; Dunshea et al. Citation2020), seabirds (Webb & Durinck Citation1992; Arroyo et al. Citation2020), turtles (Eguchi et al. Citation2007)).
4.2. Monthly variability in sharks presence
Results from this study confirmed the year-round presence of whale sharks in the South Ari Atoll previously described as one of a few coastal areas where whale sharks can be frequently encountered yearlong, showing high site fidelity and residency behaviour (Riley et al. Citation2010; Donati et al. Citation2016; Perry et al. Citation2018; Allen et al. Citation2021; Harvey-Carroll et al. Citation2021). In particular, this study highlighted significant oscillations in the number of encounters among months, both in the same year and between months of different years, indicating that sharks’ relative abundance changes within and between years. Despite the presence of a monthly variability, the absence of seasonal peaks confirms that whale sharks are regularly present in the area during the entire year. In the time interval investigated in this study (four years period), the yearly relative abundance appeared to be homogeneous, and no trends were detected; however, a recent study by Harvey-Carroll et al. (Citation2021), where a longer time period was considered (six years), detected a decreasing trend in whale shark presence in the SAMPA. This result highlighted the importance to consider an adequate time interval when assessing the existence of a temporal trend for the species in the SAMPA area.
4.3. Drivers of occurrence in SAMPA
Despite, no linear relationship was found between sea surface temperature and the temporal occurrence of whale sharks in SAMPA area, the inverse correlation, almost close to the significant level, with monthly valued of derived SST suggests that temperature likely plays a role in sharks’ habitat selection at this scale. Sequeira et al. (Citation2012) classify the SST as the main variable affecting the relative occurrence of whale sharks at Indian Ocean-scale suggesting that whale sharks used only a small band of averaged temperatures for their large-scale movements and they might move outside this range for other activities (e.g. foraging). The limited area considered in this study might constitute a limitation to capture an adequate temperature variability to describe variation in sharks’ relative abundance across the year and among years. As reported in many studies, one of the most influential factors for filter feeders aggregations is food abundance (e.g., fish and coral spawning, high-density patch of zooplankton) (Anderson et al. Citation2011; Sequeira et al. Citation2012; Robinson et al. Citation2013; Cárdenas‐Palomo et al. Citation2015; Cárdenas-Palomo et al. Citation2018; Harris et al. Citation2020). Although the feeding activity is not confirmed in the SAMPA area, if available, zooplankton biomass data, rather than SST, can represent a suitable variable to understand the occurrence of whale sharks in SAMPA and the rest of Maldives.
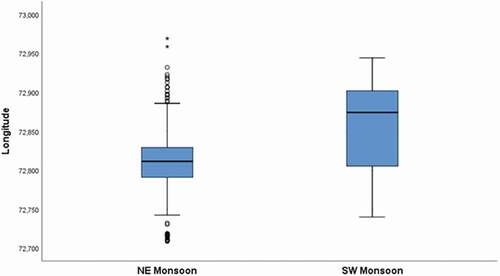
The present study found an inverse correlation between SPUE and average values of rainfalls. Maldives climate is tropical equatorial and characterized by two main seasons influenced by the Indian Monsoon. The northeast monsoon, from December to April, brings the “dry season” with limited rainfalls, whilst the southwest monsoon “wet season” occurs from May to November bringing increased rainfalls (Anderson & Ahmed Citation1993; Wilson et al. Citation2001; Rowat Citation2007; Stevens et al. Citation2015). The findings from the present study highlighted the presence of whale shark especially during the dry season (northeast monsoon) but data did not show a seasonal peak in the first half of the year. Along the entire Maldives archipelago, whale sharks show a pattern of distribution strongly related to the monsoon seasons (Anderson & Ahmed Citation1993; Anderson et al. Citation2011), this spatial pattern is confirmed by the results of our study at a much smaller spatial scale (MPA scale; 42 km2). In the SAMPA during the northeast monsoon period, whale sharks appeared to be more concentrated in a smaller longitudinal range ()) closer to the western-central part of the MPA. In this area, deeper waters conditions occur due to the proximity to a deep depression () close to the forereef, which could be considered an “accumulation” zone for nutrients and preys.
Figure 9. Differences in longitudinal position of whale sharks encounters during the northeast and the southwest monsoons
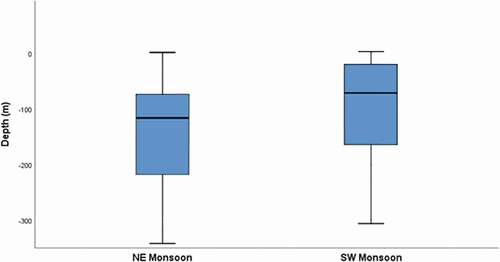
The direct correlation between latitudinal position of whale sharks and sea bottom depth recorded during the encounters (Pearson correlation N = 1068; r = 0.56; P-level < 0.001) indicated that bathymetrical features could play a role in the shark distribution at SAMPA especially during monsoon seasons. During the northeast monsoon season, encounters occurred in areas with average depth of about 140 m while during the southwestern monsoon they occur in areas with shallower depths. (). This result suggested a potential influence of deep canyon systems, and related oceanographic factors, with the habitat selection, during the dry season.
Figure 10. Differences in sea bottom depth recorded during whale sharks encounters during the northeast and the southwest monsoons
This key role played by oceanographic geomorphological features is supported by other studies. Copping et al. (Citation2018) showed that coastal whale sharks aggregations occur typically in the shallow forereef and lagoon areas which have steep slopes and deep water in their proximity. Canyons are well known to induce upwelling events and to be characterized by high productivity (Copping et al. Citation2018). The influence of currents on sharks aggregation was also reported in southern Mozambique (e.g., whales sharks aggregation in Praia de Tofo) where the presence of eddies was indicated as important factors affecting shark aggregation along the coast (Sleeman et al. Citation2010; Rohner et al. Citation2013; Donati et al. Citation2016).
Additionally, studies indicated that whale sharks feeding activity could occur in deep water and then, successively the animals surfaced in shallower and warmer waters, to thermoregulate and recover (Motta et al. Citation2010; Copping et al. Citation2018; Allen et al. Citation2021). In SAMPA canyon areas could be used by shark for feeding purposes especially during dry season. However, results presented in this study focused only on data collected in shallow waters, and further data (e.g., tagging data, zooplankton samples or foraging evidence, oceanographic data collected as a function of depth) from the canyon area, are needed to support this hypothesis.
Here, at the scale of MPA, the strongest drivers of whale sharks temporal occurrence and distribution appear to be related to seasonal rainfalls events (monsoon influence) or bathymetric features (canyon presence), rather than productivity or sea surface temperature, widely used in literature (Sequeira et al. Citation2014a, Citation2014b) to explain sharks movements and habitat selection at a larger scale. To fully assess the population status of whale sharks it is necessary to understand the key elements affecting their occurrence and the influence that climate change-related events may have on their distribution at the local scale.
Despite the worldwide interest in the natural resources of the Maldives, the whale shark population from this area is increasingly subjected to anthropogenic pressure mainly coming from tourism-related activities. The results presented in this work provided additional elements to increase the knowledge about whale shark aggregations in South Ari Atoll and to inform decision-making processes that aim to implement dedicated management actions and to protect this fragile population inhabiting SAMPA.
Acknowledgements
This study was conducted with the crucial effort of Maldives Whale Shark Research Programme. The Authors are deeply thankful to all the staff and volunteers who worked collecting data and to the Dhoni captains and their collaborators.
A special thanks to Dr. Stefania Cerretelli and Dr. Valentina Melica for English language editing and their precious comments and suggestions. In the end, the authors would like to thank the referees who greatly contributed to improving this work with their comments and suggestions.
Disclosure statement
No potential conflict of interest was reported by the author (s).
References
- Aca EQ, Schmidt JV. 2011. Revised size limit for viability in the wild: Neonatal and young of the year whale sharks identified in the Philippines. Asia Life Sciences 20(2):361–367.
- Allen HL, Stewart BD, McClean CJ, Hancock J, Rees R. 2021. Anthropogenic injury and site fidelity in Maldivian whale sharks (Rhincodon typus). Aquatic Conservation: Marine and Freshwater Ecosystem 1–14.
- Anderson RC, Adam MS, Goes JI. 2011. From monsoons to mantas: Seasonal distribution of Manta alfredi in the Maldives. Fisheries Oceanography 20(2):104–113. DOI: 10.1111/j.1365-2419.2011.00571.x.
- Anderson RC, Ahmed H. 1993. The shark fisheries of the Maldives. Male, Maldives: FAO, Rome, and Ministry of Fisheries.
- Araujo G, Snow S, So CL, Labaja J, Murray R, Colucci A, Ponzo A. 2017. Population structure, residency patterns and movements of whale sharks in Southern Leyte, Philippines: Results from dedicated photo‐ID and citizen science. Aquatic Conservation: Marine and Freshwater Ecosystems 27(1):237–252. DOI: 10.1002/aqc.2636.
- Arroyo GM, de la Cruz A, Delgado D. 2020. How adequately are the critically endangered Balearic Shearwaters protected by the Special Protection Areas (SPAs) for seabirds? A case study in the Gulf of Cadiz. Global Ecology and Conservation 21:e00861. DOI: 10.1016/j.gecco.2019.e00861.
- Betzler C, Hübscher C, Lindhorst S, Lüdmann T, Reijmer JJ, Braga JC. 2016. Lowstand wedges in carbonate platform slopes (Quaternary, Maldives, Indian Ocean). The Depositional Record 2(2):196–207. DOI: 10.1002/dep2.21.
- Birkmanis CA, Partridge JC, Simmons LW, Heupel MR, Sequeira AM. 2020. Shark conservation hindered by lack of habitat protection. Global Ecology and Conservation 21:e00862. DOI: 10.1016/j.gecco.2019.e00862.
- Boldrocchi G, Bettinetti R. 2019. Whale shark foraging on baitfish off Djibouti. Marine Biodiversity 49(4):2013–2016. DOI: 10.1007/s12526-018-00934-8.
- Boldrocchi G, Monticelli D, Butti L, Omar M, Bettinetti R. 2020. First concurrent assessment of elemental-and organic-contaminant loads in skin biopsies of whale sharks from Djibouti. Science of the Total Environment 722:137841.
- Breen P, Posen P, Righton D. 2015. Temperate marine protected areas and highly mobile fish: A review. Ocean & Coastal Management 105:75–83. DOI: 10.1016/j.ocecoaman.2014.12.021.
- Cagua EF, Collins N, Hancock J, Rees R. 2014. Whale shark economics: A valuation of wildlife tourism in South Ari Atoll, Maldives. PeerJ 2:e515. DOI: 10.7717/peerj.515.
- Cárdenas‐Palomo N, Herrera‐Silveira J, Velázquez‐Abunader I, Reyes O, Ordoñez U. 2015. Distribution and feeding habitat characterization of whale sharks Rhincodon typus in a protected area in the north Caribbean Sea. Journal of Fish Biology 86(2):668–686. DOI: 10.1111/jfb.12589.
- Cárdenas-Palomo N, Noreña-Barroso E, Herrera-Silveira J, Galván-Magaña F, Hacohen-Domené A. 2018. Feeding habits of the whale shark (Rhincodon typus) inferred by fatty acid profiles in the northern Mexican Caribbean. Environmental Biology of Fishes 101(11):1599–1612. DOI: 10.1007/s10641-018-0806-3.
- Cochran JE, Braun CD, Cagua EF, Campbell Jr MF, Hardenstine RS, Kattan A,Priest MA, Sinclair-Taylor TH, Skomal GB, Sultan S, Sun. 2019. Multi-method assessment of whale shark (Rhincodon typus) residency, distribution, and dispersal behavior at an aggregation site in the Red Sea. PloS One 14(9):e0222285. DOI: 10.1371/journal.pone.0222285.
- Cochran JEM, Hardenstine RS, Braun CD, Skomal GB, Thorrold SR, Xu K,Genton MG, Berumen ML. 2016. Population structure of a whale shark Rhincodon typus aggregation in the Red Sea. Journal of Fish Biology 89(3):1570–1582. DOI: 10.1111/jfb.13054.
- Colman JG. 1997. A review of the biology and ecology of the whale shark. Journal of Fish Biology 51(6):1219–1234. DOI: 10.1111/j.1095-8649.1997.tb01138.x.
- Compagno LJ. 2001. Sharks of the world. An annotated and illustrated catalogue of shark species known to date, vol 2. Bullhead, mackerel and carpet sharks (Heterodontiformes, Lamniformes and Orectolobiformes). FAO Species Catalogue for Fishery Purposes 1:viii+-1.
- Copping JP, Stewart BD, McClean CJ, Hancock J, Rees R. 2018. Does bathymetry drive coastal whale shark (Rhincodon typus) aggregations? PeerJ 6:e4904. DOI: 10.7717/peerj.4904.
- Davidson LN, Dulvy NK. 2017. Global marine protected areas to prevent extinctions. Nature Ecology & Evolution 1(2):1–6. DOI: 10.1038/s41559-016-0040.
- Donati G, Rees RG, Hancock JW, Jenkins TK, Shameel I, Hindle K, Cagua EF. 2016. New insights into the South Ariatoll whale shark, Rhincodon typus, aggregation. QScience Proceedings, The 4th International Whale Shark Conference, May 2016, Volume 2016, 16.
- Dunshea G, Groom R, Griffiths AD. 2020. Observer performance and the effect of ambiguous taxon identification for fixed strip-width dugong aerial surveys. Journal of Experimental Marine Biology and Ecology 526:151338. DOI: 10.1016/j.jembe.2020.151338.
- Eguchi T, Gerrodette T, Pitman RL, Seminoff JA, Dutton PH. 2007. At-sea density and abundance estimates of the olive ridley turtle Lepidochelys olivacea in the eastern tropical Pacific. Endangered Species Research 3(2):191–203. DOI: 10.3354/esr003191.
- EPA. 2019. List of stakeholder meetings held to identify management measures for South Ari Marine Protected Area (SAMPA).
- Escalle L, Speed CW, Meekan MG, White WT, Babcock RC, Pillans RD, Huveneers C. 2015. Restricted movements and mangrove dependency of the nervous shark Carcharhinus cautus in nearshore coastal waters. Journal of Fish Biology 87(2):323–341. DOI: 10.1111/jfb.12724.
- Evans PG, Hammond PS. 2004. Monitoring cetaceans in European waters. Mammal Review 34(1‐2):131–156. DOI: 10.1046/j.0305-1838.2003.00027.x.
- FAO. 2007. Report and documentation of the expert workshop on marine protected areas and fisheries management: Review of issues and considerations. Rome, 12–14 June 2006. FAO Fisheries Report. No. 825. Rome: FAO. p. 332.
- Fürstenau J, Lindhorst S, Betzler C, Hübscher C. 2010. Submerged reef terraces of the Maldives (Indian Ocean). Geo-Marine Letters 30(5):511–515. DOI: 10.1007/s00367-009-0174-2.
- Gallagher AJ, Hammerschlag N. 2011. Global shark currency: The distribution, frequency, and economic value of shark ecotourism. Current Issues in Tourism 14(8):797–812. DOI: 10.1080/13683500.2011.585227.
- Gischler E. 2006. Sedimentation on Rasdhoo and Ari Atolls, Maldives, Indian Ocean. Facies 52(3):341–360. DOI: 10.1007/s10347-005-0031-3.
- Gischler E, Storz D, Schmitt D. 2014. Sizes, shapes, and patterns of coral reefs in the Maldives, Indian Ocean: The influence of wind, storms, and precipitation on a major tropical carbonate platform. Carbonates and Evaporites 29(1):73–87. DOI: 10.1007/s13146-013-0176-z.
- Graham RT, Roberts CM, Smart JC. 2005. Diving behaviour of whale sharks in relation to a predictable food pulse. Journal of the Royal Society Interface 3(6):109–116. DOI: 10.1098/rsif.2005.0082.
- Grüss A, Kaplan DM, Guénette S, Roberts CM, Botsford LW. 2011. Consequences of adult and juvenile movement for marine protected areas. Biological Conservation 144(2):692–702. DOI: 10.1016/j.biocon.2010.12.015.
- Harris JL, McGregor PK, Oates Y, Stevens GM. 2020. Gone with the wind: Seasonal distribution and habitat use by the reef manta ray (Mobula alfredi) in the Maldives, implications for conservation. Aquatic Conservation: Marine and Freshwater Ecosystems 30(8):1649–1664. DOI: 10.1002/aqc.3350.
- Harvey-Carroll J, Stewart JD, Carroll D, Mohamed B, Shameel I, Zareer IH, Araujo G, Rees R. 2021. The impact of injury on apparent survival of whale sharks (Rhincodon typus) in South Ari Atoll Marine Protected Area, Maldives. Scientific Reports 11(1):937. DOI: 10.1038/s41598-020-79101-8.
- Haupt PW, Lombard AT, Goodman PS, Harris JM. 2017. Accounting for spatiotemporal dynamics in conservation planning for coastal fish in KwaZulu-Natal, South Africa. Biological Conservation 209:289–303. DOI: 10.1016/j.biocon.2017.02.009.
- Heupel MR, Knip DM, Simpfendorfer CA, Dulvy NK. 2014. Sizing up the ecological role of sharks as predators. Marine Ecology Progress Series 495:291–298. DOI: 10.3354/meps10597.
- Ibarra-García EC, Ortiz M, Ríos-Jara E, Cupul-Magaña AL, Hernández-Flores Á, Rodríguez-Zaragoza FA. 2017. The functional trophic role of whale shark (Rhincodon typus) in the northern Mexican Caribbean: Network analysis and ecosystem development. Hydrobiologia 792(1):121–135. DOI: 10.1007/s10750-016-3049-3.
- Ketchum JT, Galván-Magaña F, Klimley AP. 2013. Segregation and foraging ecology of whale sharks, Rhincodon typus, in the southwestern Gulf of California. Environmental Biology of Fishes 96(6):779–795. DOI: 10.1007/s10641-012-0071-9.
- Li W, Wang Y, Norman B. 2012. A preliminary survey of whale shark Rhincodon typus catch and trade in China: An emerging crisis. Journal of Fish Biology 80(5):1608–1618. DOI: 10.1111/j.1095-8649.2012.03250.x.
- Lieber L, Hall G, Hall J, Berrow S, Johnston E, Gubili C,Sarginson J, Francis M, Duffy C, Wintner SP, Doherty PD. 2020. Spatio-temporal genetic tagging of a cosmopolitan planktivorous shark provides insight to gene flow, temporal variation and site-specific re-encounters. Scientific Reports 10(1):1–17. DOI: 10.1038/s41598-020-58086-4.
- MacKeracher T, Diedrich A, Simpfendorfer CA. 2019. Sharks, rays and marine protected areas: A critical evaluation of current perspectives. Fish and Fisheries 20(2):255–267. DOI: 10.1111/faf.12337.
- Meekan MG, Jarman SN, McLean C, Schultz MB. 2009. DNA evidence of whale sharks (Rhincodon typus) feeding on red crab (Gecarcoidea natalis) larvae at Christmas Island, Australia. Marine and Freshwater Research 60(6):607–609. DOI: 10.1071/MF08254.
- Motta PJ, Maslanka M, Hueter RE, Davis RL, De la Parra R, Mulvany SL, Habegger ML. 2010. Feeding anatomy, filter-feeding rate, and diet of whale sharks Rhincodon typus during surface ram filter feeding off the Yucatan Peninsula, Mexico. Zoology 113(4):199–212. DOI: 10.1016/j.zool.2009.12.001.
- Norse EA. 2010. Ecosystem-based spatial planning and management of marine fisheries: Why and how? Bulletin of Marine Science 86(2):179–195.
- Perry CT, Figueiredo J, Vaudo JJ, Hancock J, Rees R, Shivji M. 2018. Comparing length-measurement methods and estimating growth parameters of free-swimming whale sharks (Rhincodon typus) near the South Ari Atoll, Maldives. Marine & Freshwater Research 69(10):1487–1495. DOI: 10.1071/MF17393.
- Pierce SJ, Norman B. 2016. Rhincodon typus. The IUCN Red List of Threatened Species, e-T19488A2365291.
- Quiros AL. 2007. Tourist compliance to a Code of Conduct and the resulting effects on whale shark (Rhincodon typus) behavior in Donsol, Philippines. Fisheries Research 84(1):102–108. DOI: 10.1016/j.fishres.2006.11.017.
- Rasheed AR, Abdulla A. 2020. Evaluating stakeholder participatory processes in policy development for Marine Protected Areas. Marine Policy 112:103737. DOI: 10.1016/j.marpol.2019.103737.
- Rasheed AR, Abdulla A, Zakariyya NI. 2016. Vulnerability of different types of fishers to potential implementation of a management plan in a Marine Protected Area (MPA) in the Maldives. Marine Policy 74:195–204. DOI: 10.1016/j.marpol.2016.09.029.
- Reid JB, Evans PG, Northridge SP, editors. 2003. Atlas of cetacean distribution in north-west European waters. Joint Nature Conservation Committee. Peterborough, United Kingdom.
- Rigby CL, Simpfendorfer CA, Cornish A. 2019. A practical guide to effective design and management of MPAs for sharks and rays. Gland, Switzerland: WWF.
- Riley MJ, Hale MS, Harman A, Rees RG. 2010. Analysis of whale shark Rhincodon typus aggregations near South Ari atoll, Maldives Archipelago. Aquatic Biology 8(2):145–150. DOI: 10.3354/ab00215.
- Robinson DP, Jaidah MY, Jabado RW, Lee-Brooks K, El-Din NMN, Malki AAA, Elmeer K. 2013. Whale sharks, Rhincodon typus, aggregate around offshore platforms in Qatari waters of the Arabian Gulf to feed on fish spawn. PLoS One 8(3):e58255. DOI: 10.1371/journal.pone.0058255.
- Rohner CA, Pierce SJ, Marshall AD, Weeks SJ, Bennett MB, Richardson AJ. 2013. Trends in sightings and environmental influences on a coastal aggregation of manta rays and whale sharks. Marine Ecology Progress Series 482:153–168. DOI: 10.3354/meps10290.
- Rowat D. 2007. Occurrence of whale shark (Rhincodon typus) in the Indian Ocean: A case for regional conservation. Fisheries Research 84(1):96–101. DOI: 10.1016/j.fishres.2006.11.016.
- Rowat D, Brooks KS. 2012. A review of the biology, fisheries and conservation of the whale shark Rhincodon typus. Journal of Fish Biology 80(5):1019–1056. DOI: 10.1111/j.1095-8649.2012.03252.x.
- Sanzogni RL, Meekan MG, Meeuwig JJ. 2015. Multi-year impacts of ecotourism on whale shark (Rhincodon typus) visitation at Ningaloo Reef, Western Australia. PloS One 10(9):e0127345. DOI: 10.1371/journal.pone.0127345.
- Schmidt JV, Schmidt CL, Ozer F, Ernst RE, Feldheim KA, Ashley MV, Levine M. 2009. Low genetic differentiation across three major ocean populations of the whale shark, Rhincodon typus. PloS One 4(4):e4988. DOI: 10.1371/journal.pone.0004988.
- Sequeira A, Mellin C, Rowat D, Meekan MG, Bradshaw CJ. 2012. Ocean‐scale prediction of whale shark distribution. Diversity & Distributions 18(5):504–518. DOI: 10.1111/j.1472-4642.2011.00853.x.
- Sequeira AM, Mellin C, Delean S, Meekan MG, Bradshaw CJ. 2013. Spatial and temporal predictions of inter-decadal trends in Indian Ocean whale sharks. Marine Ecology Progress Series 478:185–195. DOI: 10.3354/meps10166.
- Sequeira AM, Mellin C, Floch L, Williams PG, Bradshaw CJ. 2014a. Inter-ocean asynchrony in whale shark occurrence patterns. Journal of Experimental Marine Biology and Ecology 450:21–29. DOI: 10.1016/j.jembe.2013.10.019.
- Sequeira AM, Mellin C, Fordham DA, Meekan MG, Bradshaw CJ. 2014b. Predicting current and future global distributions of whale sharks. Global Change Biology 20(3):778–789. DOI: 10.1111/gcb.12343.
- Sims DW, Southall EJ, Tarling GA, Metcalfe JD. 2005. Habitat‐specific normal and reverse diel vertical migration in the plankton‐feeding basking shark. Journal of Animal Ecology 74(4):755–761. DOI: 10.1111/j.1365-2656.2005.00971.x.
- Sleeman JC, Meekan MG, Wilson SG, Polovina JJ, Stevens JD, Boggs GS, Bradshaw CJ. 2010. To go or not to go with the flow: Environmental influences on whale shark movement patterns. Journal of Experimental Marine Biology and Ecology 390(2):84–98. DOI: 10.1016/j.jembe.2010.05.009.
- Speed CW, Meekan MG, Rowat D, Pierce SJ, Marshall AD, Bradshaw CJ. 2008. Scarring patterns and relative mortality rates of Indian Ocean whale sharks. Journal of Fish Biology 72(6):1488–1503. DOI: 10.1111/j.1095-8649.2008.01810.x.
- Stevens G, Fernando D, Ender I. 2015. Submission of information on mobulid species in support of the Northeast (Dubai) and Northwest (Colombo) Indian Ocean EBSA workshops. UNEP/CBD/EBSA/WS/2015/1/2, 16 March.
- Thums M, Meekan M, Stevens J, Wilson S, Polovina J. 2013. Evidence for behavioural thermoregulation by the world’s largest fish. Journal of the Royal Society Interface 10(78):20120477. DOI: 10.1098/rsif.2012.0477.
- Trujillo-Córdova JA, Palomo NC, Herrera EM, Mendoza OR. 2016. Whale shark behavior with swimmers and boats present during tourism activities in the northern Mexican Caribbean. In The 4th International Whale Shark Conference. Doha (Qatar): Hamad bin Khalifa University Press (HBKU Press), May. Vol. 2016, No. 2, p. 63.
- Webb A, Durinck J. 1992. Counting birds from ship. Manual for aeroplane and ship surveys of waterfowl and seabirds. IWRB Special Publication 19:24–37.
- West CD, Dytham C, Righton D, Pitchford JW. 2009. Preventing overexploitation of migratory fish stocks: The efficacy of marine protected areas in a stochastic environment. ICES Journal of Marine Science 66(9):1919–1930. DOI: 10.1093/icesjms/fsp159.
- Whitehead DA, Murillo-Cisneros D, Elorriaga-Verplancken FR, Hacohen-Domené A, De La Parra R, Gonzalez-Armas R, Galvan-Magaña F. 2020. Stable isotope assessment of whale sharks across two ocean basins: Gulf of California and the Mexican Caribbean. Journal of Experimental Marine Biology and Ecology 527:151359. DOI: 10.1016/j.jembe.2020.151359.
- Wilson SG, Taylor G, Pearce AF. 2001. The seasonal aggregation of whale sharks at Ningaloo Reef, Western Australia: Currents, migrations and the El Nino/Southern Oscillation. Biology of Fishes 61(1):1–11. DOI: 10.1023/A:1011069914753.
- Zimmerhackel JS, Kragt ME, Rogers AA, Ali K, Meekan MG. 2019. Evidence of increased economic benefits from shark-diving tourism in the Maldives. Marine Policy 100:21–26. DOI: 10.1016/j.marpol.2018.11.004.