
 ?Mathematical formulae have been encoded as MathML and are displayed in this HTML version using MathJax in order to improve their display. Uncheck the box to turn MathJax off. This feature requires Javascript. Click on a formula to zoom.
Abstract
Gut microbiota influences the health of host animals, and the effect of sex on gut microbiota in herbivores is less clear than that of other factors such as diet and age. In this study, we obtained data on the gut microbiota of Himalayan tahr for the first time. Eleven samples (seven females and four males) of Himalayan tahr were divided into two groups according to sex. The V3–V4 variable region of the 16S rRNA gene was amplified and sequenced; 189 genera belonging to 15 phyla were detected in the male group while 169 genera belonging to 15 phyla were found in the female group. Fecal microbiomes in tahrs were dominated by phyla Firmicutes and Bacteroidetes, which accounted for > 90% of the bacteria. The high Firmicutes/Bacteroidetes ratio (2.99) contributed to the metabolism of dietary fiber in the intestine and produced more short-chain fatty acids. A higher Firmicutes/Bacteroidetes ratio in male samples was determined, though non-significantly. In addition, bacteria associated with fiber digestion and energy absorption were higher in males than in females, which may benefit the energy metabolism of the males. Our results suggest that sex is not effective in shaping the gut microbiota, especially when the sexes inhabit the same environmental conditions.
Introduction
The gut microbiota, also known as the “second genome”, is a complex, dense and diverse microbial community (Li et al. Citation2014). Gut microbiota, potentially related to host metabolism, immunity and gastrointestinal diseases, is abundant in the intestinal tract (Boulangé et al. Citation2016; Thaiss et al. Citation2016; Wong & Yu Citation2019; Glowacki & Martens Citation2020; Hwang & Chang Citation2020). Previous studies on human gut microbiota suggested that diet and environmental factors play a very important role in shaping the human intestinal microbiota (Maurice et al. Citation2015; Hu et al. Citation2018; Youngblut et al. Citation2019). In addition, host genetics and age are other important factors that contribute to the variation of microbial composition (Aivelo et al. Citation2016; Bonder et al. Citation2016; Chen et al. Citation2018; Youngblut et al. Citation2019).
The interaction between host and gut microbiota is an important factor for animals to occupy an ecological niche and adapt to evolution (Amato Citation2016). It has been proven that different factors have different effects on intestinal microbes, among which diet is generally considered to be a very important factor (Springer et al. Citation2017; Gentile & Weir Citation2018). Moreover, studies have suggested that environmental factors may be more significant than the host genotype (Moeller & Ochman Citation2013; Ren et al. Citation2017; Springer et al. Citation2017). Interestingly, the extent to which sex plays a role in gut microbiota remains unclear, although studies suggest that sex is one of the factors affecting intestinal microbes (de la Cuesta-Zuluaga et al. Citation2019; Ma & Li Citation2019; Zhao et al. Citation2019). Of note, previous studies in mice demonstrated that compared with sex difference, genetic background is a stronger factor affecting the gut microbiota (Kovacs et al. Citation2011). Meanwhile, sex ranked 10th among 69 factors proved to be associated with changes in gut microbiota (Falony et al. Falony, et al., Citation2016). A study on humans, fish and mice showed that the composition of gut microbiota is a result of the interaction of the host’s dietary structure and sex, and that the effect of dietary changes on intestinal microbes varies significantly with gender (Bolnick et al. Citation2014). Furthermore, a study on sex-specific associations between microbiome and fat distribution suggested that the sex differences exist in gut microbiota (Min et al. Citation2019). A recent study demonstrated a certain degree of correlation in wild blue sheep between sexual dimorphism and the composition of the intestinal microbiota (Zhu et al. Citation2020).
The Himalayan tahr (Hemitragus jemlahicus) belongs to the family Bovidae in the order Artiodactyla. It is native to the Himalayas and is mainly distributed in southern Tibet of China, northern India, and Nepal (Ke et al. Citation2007; Kittur et al. Citation2010). Due to habitat loss and hunting pressure across its range, the Himalayan tahr is listed as Near Threatened on the International Union for Conservation of Nature (IUCN) Red List of Threatened Species™ and is protected strictly as a national first-class protected animal in China for its endangered status (Ke et al. Citation2007). Due to its migratory characteristics, the habitat of tahr is widely distributed, mainly between 3000 and 4000 m a.s.l. (Smith et al. Citation2010). Adapted to inhabit steep rocky mountain slopes, tahrs mainly feed on herbs, shrubs, grasses and sedges (Buffa et al. Citation1998; Smith et al. Citation2010). The male tahrs have a much larger home range than the females, and are segregated from females except during estrus (Ramsey and Forsyth Citation2018).
Studies on the effect of sex on gut microbiota mostly focus on humans and mice, and the differences in gut microbiota caused by sex difference may be related to differences in sex hormone levels, dietary structure, types of medications usually taken, body mass index or colonic transit time (Kim et al. Citation2020). Due to the scarcity of tahrs, studies on tahrs are mainly focused on behavior, ecology, conservation and evolution (Ropiquet & Hassanin Citation2005; Lovari et al. Citation2009; Kittur et al. Citation2010). In addition, studies on the effects of sex on gut microbes in herbivores are relatively scarce. Therefore, we conducted a gut microbiota analysis using samples of males and females of adult tahrs. In this study, we aimed to identify the composition and structure of the gut microbiota of Himalayan tahrs and characterize the contributions of sex in shaping the intestinal microbiota in the absence of environmental variance. The research provides important data for the diagnosis of intestinal diseases and animal intestinal health, and provides insights for the evaluation of animal conversation efficacy and management.
Materials and methods
Feces sample collection
Fecal samples from individual tahrs living in Ji’nan Wild Park (Shandong Province, China) were collected in May 2016. Tahrs are scarce, and Ji’nan Wild Park is the zoo with the largest number of tahrs in China. All individuals are healthy adults, ranging in age from 3 to 5 years old. Only captive individuals were used in this study, which live in identical environmental conditions and feed on the same foods, primarily consisting of cotton grass, alfalfa, carrots and pellet feed. Samples were divided into two groups based on sex – the male group, M (M1, M2, M3, M4) and the female group, F (F1, F2, F3, F4, F5, F6, F7) – and all samples were from different individuals. In addition, no antibiotics or other drugs were given in the three months before the samples were collected. We collected samples within half an hour after defecation of tahrs in the early morning to make sure that they were fresh. Subsequently, fecal samples were frozen on dry ice, and then frozen at −80°C for further analysis.
Ethics approval
All animal experiments in this study were performed in accordance with the recommendations of the Guide to Animal Experiments of the Ministry of Science and Technology (Beijing, China). Ethics approval for this research was obtained from the Qufu Normal University Institutional Animal Care and Use Committee (Permit Number QFNU2018-031).
DNA extraction
Genomic DNA was extracted using a QIAamp® Stool Mini Kit (Qiagen, Germany) according to the manufacturer’s instructions. Extracted DNA samples were quantified on a Nanodrop UV-Vis Spectrophotometer (Thermo Fisher Scientific) and stored at −80°C until analysis.
16S rRNA amplification and sequencing
Variable regions V3–V4 of the 16S rRNA gene were amplified from all samples with the forward primer (CCTAYGGGRBGCASCAG) and the reverse primer (GGACTACNNGGGTATCTAAT). Specific PCRamplification was performed under the following conditions: 5 µL microbial genomic DNA, 5 µL of each primer, 25 µL KAPA HiFi HotStart Ready Mix (KAPA Biosystems), and 10 µL ddH2O, for a final volume per reaction of 50 µL. The thermocycler conditions were: initial denaturation at 95°C for 10 min, 25 cycles of denaturation at 94°C for 30 s, annealing temperature at 55°C for 30s, extension at 72°C for 30 s, and an elongation step at 72°C for 5 min.
PCR products were 410 bp in size and were assessed for quality by agarose gel electrophoresis. The amplified libraries were purified with AMPure XP beads under standard manufacturer protocols. Library preparation and sequencing libraries were prepared using a TruSeq DNA PCR-free Sample Preparation Kit (Illumina, United States). Libraries were quantified by Qubit, and sequenced using the Illumina HiSeq 2500 platform (Illumina) with 250-bp paired end sequencing.
Sequence processing and analysis
Raw sequence reads were first cleaned up and then assembled through the following steps. FLASH and QIIME (v. 1.7.0) were used to remove barcodes and primer sequences (Caporaso et al. Citation2010; Magoč & Salzberg Citation2011). Chimeric sequences were removed from the data set using the UCHIME algorithm, and effective tags were obtained (Edgar et al. Citation2011). UPARSE (v. 7.0.1001) was used to analyze and identify the sequences, and sequences were clustered into operational taxonomic units (OTUs) based on 97% similarity (Edgar Citation2013). OTUs were then assigned taxonomy using the GreenGene Database with the RDP classifier algorithm (v. 2.2) (DeSantis et al. Citation2006; Wang et al. Citation2007). Measures of alpha diversity were calculated with QIIME (v. 1.7.0) including observed species, Chao1, ACE, Shannon, Simpson and coverage indices.
We performed rarefaction and rank–abundance plot analyses using R software. T-test and Wilcox test were used to check for a statistically significant difference between groups. Associations between the gut microbiota and sex difference were evaluated by principal component analysis (PCA) and principal coordinate analysis (PCoA). A dendrogram was used to represent similarity and dissimilarity of bacterial communities among samples, and was determined by the unweighted pair group method with arithmetic mean (UPGMA). Illumina sequencing data sets generated from this project have been deposited in the National Center for Biotechnology Information (NCBI) sequence read archive (SRA) under accession number PRJNA664214.
Results
Overview of sequencing data
After filtering of all non-bacterial and low abundance reads, the final data set included 822,560 high-quality reads representing 1823 OTUs across the total of 11 tahr samples. The statistical alpha diversity of microbial communities was assessed and calculated using six indices ().
Table I. Alpha diversity of gut microbiota in feces samples from Himalayan tahr
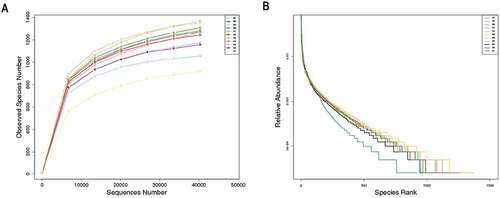
Rarefaction curves () were calculated using the vegan library in the R statistical computing language to verify the level of asymptotic saturation of available taxonomic diversity within all samples (Oksanen et al. Citation2013). Rarefaction curves of alpha diversity reached a plateau, indicating that it was sufficient to detect the overwhelming majority of microorganisms within each sample. Furthermore, we created a rank–abundance curve (), which is a common statistical technique that provides a visualization tool to understand how bacterial communities differ in number and abundances of species (Huse et al. Citation2010).
Figure 1 (A)Rarefaction curves and (B) rank abundance curves of each sample. The saturated rarefaction curves and species richness indices indicate that the dominant taxa present were captured. The rank abundance curves reveal an evenness of bacterial species in the fecal samples of tahrs
Bacterial composition and relative abundance
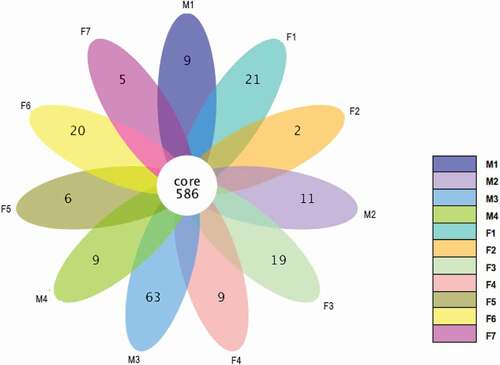
A total of 15 phyla, 32 classes, 56 orders, 88 families, 206 genera and 59 species were identified in the prokaryotic microbiota from both male and female tahrs. The Venn diagram of all samples showed that they shared 586 core OTUs (). The male group (M) in total contained 1664 unique matched OTUs, the average number in each sample was 1338 OTUs, and they shared 806 OTUs which accounted for 60.2% of all OTUs detected in the male group. The female group (F) in total contained 1712 OTUs, with an average of 1287 OTUs in each sample, and they shared 658 OTUs which accounted for 51.1% of all OTUs detected in the female group.
Figure 2. Venn diagram of OTUs
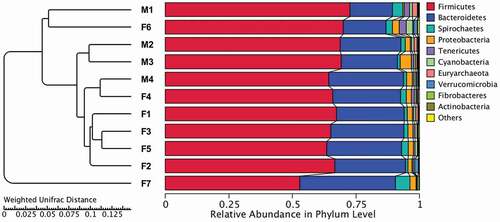
OTU analysis in the prokaryotic microbiota communities from all fecal samples detected the top 10 ranked abundance-based phyla () and genera () in tahrs. Firmicutes, Bacteroidetes, Spirochaetes, Proteobacteria and Tenericutes were the most dominant phyla in all samples, accounting for approximately 97% of all bacterial sequences. The Firmicutes/Bacteroidetes ratio was 2.99. It is worth noting that the composition and abundance of the bacterial communities based on the top 10 ranked phyla were consistent within individuals.
Table II. Relative abundance of the top 10 most abundant bacterial phyla in the tahrs
Table III. Relative abundance of the top 10 most abundant bacterial genera in the tahrs
At the genus level, the most abundant bacteria in samples were mainly Ruminococcaceae_UCG-010, Ruminococcaceae_UCG-005, Christensenellaceae_R-7_group, Rikenellaceae_RC9_gut_group, Bacteroides and Alistipes. Interestingly, the first three genera belong to Firmicutes and the rest belong to Bacteroidetes.
The relative abundances of the top 10 phyla and genera presented in the individuals and groups are depicted in . In addition, a heatmap was plotted to compare the differences within individuals based on the relative abundance of genera which were ranked in the top 35 (see ). In the analysis of individuals samples, no sex differences were observed in hierarchical clustering. Moreover, a cluster analysis of the weighted Unifrac distance matrix based on the UPGMA clustering method was conducted, and the individual samples were not segregated by sex similarity ().
Figure 3. Fecal microbial composition of tahrs at the (A) phylum and (B) genus level. M: male group; F: female group
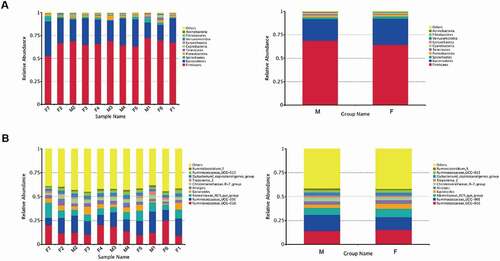
Figure 4. A heatmap of species abundance clustering. The heatmap shows the hierarchical clustering of samples based on the relative abundance of the 35 top-ranked genera of fecal microbiota in tahrs
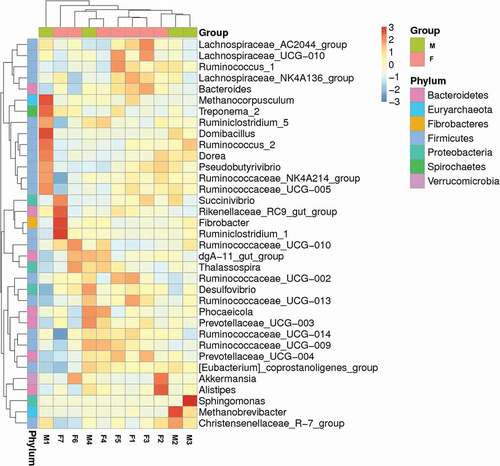
Figure 5. Cluster analysis with the weighted Unifrac distance matrix. Dendrogram branches were determined using UPGMA clustering method
Analysis of discrepancies between groups
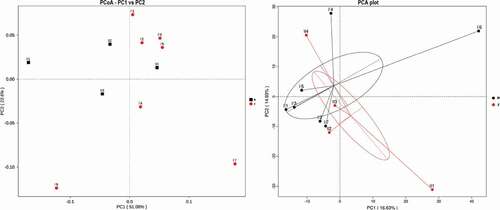
Statistically significant differences in alpha diversity (Shannon and observed species) and beta diversity between different groups were tested using T-test and Wilcox test (). Analysis of similarities (ANOSIM) (p= 0.577) and multi-response permutation procedures (MRPP) (Sig = 0.472) indicated that there were no statistically significant differences between the two groups by sex. Differences in bacterial communities were visualized using a PCoA plot, and the distance between samples represents the differences between tahrs (). Furthermore, PCA was also conducted to estimate the degree of similarity between samples in two groups (). However, we did not find significant differences between groups based on gender.
Figure 6. Comparisons of alpha diversity (Shannon and observed species index) and beta diversity (with weighted and unweighted Unifrac distance matrix) in fecal microbiota between groups by sex difference. M: male group; F: female group
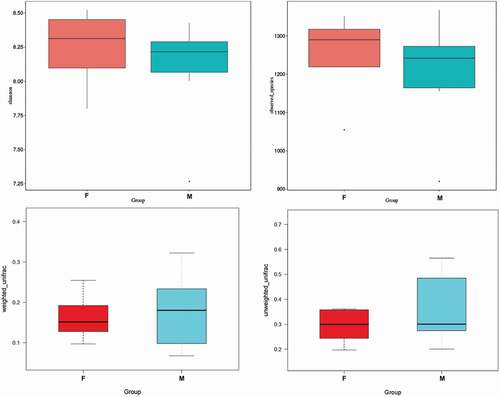
Figure 7. Principal coordinate analysis (PCoA) and principal component analysis (PCA) of bacterial community structures. Symbols represent the gut microbiota of individuals, and the different colors represent the different groups. M: male group; F: female group
Statistical significance was measured in terms of groups using the relative abundance of the main (top 10 ranked) bacterial phyla () and genera () in tahrs. The bacterial communities’ structure and composition, though non-significantly, provided insight into components and roles of the microbiota in Himalayan tahrs. We employed the MetaStat method with false discovery rate (FDR) adjustment for multiple testing to detect significantly different species at all levels between groups, from phylum to species (P< 0.05).
At the phylum level, there were no significantly different microbial species between the two groups. However, at the class level, a substantial difference in Bacilli 9belonging to phylum Firmicutes) was found between the two groups. In addition, orders Bacillales and Clostridiales showed significant differences. Interestingly, class Bacilli and orders Bacillales and Clostridiales all belong to the phylum Firmicutes, and the abundance of these species was significantly higher in the male group than in the female group.
At the genus level, Christensenellaceae_R-7_group, Ruminococcus_2, Romboutsia, Defluviitaleaceae_UCG-011, Anaerovorax, Lachnospiraceae_NK3A20_group, Bacillus, Acetitomaculum, Family_XIII_UCG-002, Anaerostipes, Solibacillus, Lachnospiraceae_UCG-002 and Erysipelotrichaceae_UCG-009 were all significantly different in terms of species richness (P< 0.05). It should be noted that the ratio of the relative abundance of significantly different species at the genus level was less than 1/1000, except for Christensenellaceae_R-7_group and Ruminococcus_2.
Discussion
The gut microbiota plays a vital role in host metabolism and the development of the immune system, and its composition is usually shaped by diet and host genetics (Bonder et al. Citation2016; Gentile & Weir Citation2018; Youngblut et al. Citation2019; Fan et al. Citation2020). In this study, we determined the structure and composition of gut microbiota in tahrs that were raised on the same diet and facing the same environmental pressures, and investigated the effect of gender difference based on male and female groups. A comparison of samples from male and female groups revealed no significant variation in alpha diversity estimates.
Taxonomic analysis based on OTUs indicated that the fecal microbiomes were dominated by members of the phyla Firmicutes and Bacteroidetes, consistent with previous studies of gut microbiota in mammals, especially in ruminants (Niu et al. Citation2015; Sun et al. Citation2016, Citation2019; Chi et al. Citation2019). Furthermore, we observed that the abundance of phyla ranked behind Firmicutes and Bacteroidetes mainly included Spirochaetes, Proteobacteria, Tenericutes, Cyanobacteria, Euryarchaeota, Verrucomicrobia, Fibrobacteres and Actinobacteria. Alpha diversity is strongly related to dietary differentiation, and ecosystem status assessment generally reveals a higher level of diversity in herbivores (Isbell et al. Citation2015; Duffy et al. Citation2017). Studies have indicated that the composition of the gut microbiota may differ between sexes and females usually have greater alpha diversity (Kim et al. Citation2020). But the effect of sex on alpha diversity in animal intestinal microorganisms did not seem to be significant (Zhu et al. Citation2020). In a recent study, Japanese subjects were divided into two groups by sex, and no significant difference of alpha diversity between groups was detected (Takagi et al. Citation2019). In this study, there was no significant difference in alpha diversity by sex group.
In the present study, the alpha diversity of male samples was higher than that of females, and the relative abundance of certain bacteria (for example, Bacilli, Christensenellaceae, Peptostreptococcaceae and Ruminococcus_2) showed significant differences between groups and accounted for a greater proportion in male samples. Because male tahrs have much larger home ranges and keep a certain distance from females except during estrus, they may benefit from a variety of microbial species and a significant difference in certain species in the intestinal bacteria.
Groups divided by gender were compared at each taxonomic level of gut microbiota to determine statistically significant differences among bacterial groups. Although there were no significant differences in the relative abundance of gut bacteria at the phylum level, significant differences were observed at class, order, family, and genus level, where bacteria were found to belong predominantly to the Firmicutes phylum and had a higher relative abundance in the male group than female group. Interestingly, the relative abundance of Firmicutes and Bacteroidetes, though non-significantly, showed an obvious difference between male and female groups, with a higher proportion of Firmicutes and a lower proportion of Bacteroidetes in male samples.
Adult male tahrs possessed a higher Firmicutes-to-Bacteroidetes ratio, which could be linked to fruit and fiber consumption, suggesting an increased efficiency of energy harvest and microbial contributions to the host energy balance (Murphy et al. Citation2010; Kong et al. Citation2014; Springer et al. Citation2017). The ratio of Firmicutes to Bacteroidetes occurs at a higher level even compared with other herbivores, and indicates that tahrs may have a stronger ability in terms of energy balances (Chi et al. Citation2019; Sun et al. Citation2019; Shi et al. Citation2021). Class Bacilli (of the phylum Firmicutes) showed a significant difference between groups, and the representative genus Bacillus was detected with a statistically significant difference. The activities of Bacilli have potential effects on host nutrition and health through the metabolism of dietary components, xenobiotics and drugs, helping to establish normal host–commensal relationships and maintain intestinal homeostasis (Jandhyala et al. Citation2015; Rowland et al. Citation2018). Species of Bacillus play an important role in the prevention and treatment of intestinal diseases, such as diarrhea and irritable bowel disease (Ilinskaya et al. Citation2017).
The relative abundance of the family Christensenellaceae and the genus Christen-senellaceae_R-7_group were significantly higher in the male group, and previous studies revealed that these species of bacteria were positively correlated with food intake, low body mass index (BMI) and lean body shape (Goodrich et al. Citation2014; Hall et al. Citation2017; Zhao et al. Citation2018). In addition, the genus Ruminococcus_2 (of the family Ruminococcaceae) showed a significant difference in favor of the male group compared to the female group. Ruminococcaceae is a predominant member of Firmicutes that may play an important role in degrading fibers and producing short-chain fatty acids (SCFAs) and is known for its ability to promote and maintain intestinal health, and it seems to be particularly important for the digestion of fiber in herbivores (Bohmig et al. Citation1997; Koh et al. Citation2016; Chi et al. Citation2019). Furthermore, studies have shown that a higher relative abundance of Planococcaceae is associated with higher efficiency in energy harvesting (Murphy et al. Citation2010; Tal et al. Citation2020). Notably, members of the family Peptostreptococcaceae were found to be significantly higher in the male group; these are usually considered symbiotic bacteria and account for a higher proportion of the gut microbiota in healthy animals (Leng et al. Citation2016; Fan et al. Citation2017).
Ruminant animals can acquire 50–70% of their calories from fiber fermentation, while the proportion may be less than 10% in humans (Bergman Citation1990). In addition, SCFAs provide 6–10% of their daily energy supply, while the SCFA contribution may be as high as 57% in folivorous primates (Popovich et al. Citation1997; Stevens & Hume Citation1998). Thus, a higher Firmicutes-to-Bacteroidetes ratio and relative abundance of Ruminococcaceae provide a potential benefit to males in terms of energy harvesting in microbial fermentation.
In another study, sex was determined to be a factor that significantly affected the overall bacterial community variation, and ranked 10th among 69 factors (Falony et al. Citation2016). Furthermore, previous studies indicated that gender difference has a low effect on microbiota composition in wild animals (Bennett et al. Citation2016; Zhu et al. Citation2020). The wild blue sheep undertakes limited seasonal aggregation: males are mostly found separately from females in summer and the sexes converge in the winter. Their gut microbiota showed significant differences between males and females, but the effect of gender on intestinal flora seemed to be negligible when they got together in winter (Zhu et al. Citation2020).
It is interesting to note that Himalayan tahrs have similar habits. The difference is that the samples used in this study were all from a wild zoo with controllable and consistent conditions, and this may be the main reason why there was no significant difference in the gut microflora between the male and female samples in this study. It should also be noted that the contribution of sex to gut microbiota variation is not clear when compared with other factors such as diet and medication, and even the genetic background of the host has a greater impact than gender difference on the intestinal microorganisms (Kovacs et al. Citation2011; Springer et al. Citation2017).
Although we found no significant difference between groups by sex, the bacterial communities at different levels were tested for significant differences. The results show that the relative abundance of bacterial species related to fiber consumption and energy harvest is higher in male samples compared with female samples. Early research showed that females tend to employ different strategies to fulfill their energy demand, mainly by an increased intake of nutrients (Richard et al. Citation2000), and tahrs seem to adopt this strategy to meet the energy demands. It is worth noting that animals that gather tend to have very similar bacterial communities (Zhu et al. Citation2020), and this might explain why we did not find significant differences between our two groups.
Data availability
The data sets generated for this study can be found in the SRA database of NCBI, SRA accession no. PRJNA664214 (https://www.ncbi.nlm.nih.gov/bioproject/PRJNA664214).
Acknowledgements
Many thanks to the zookeepers who raised the tahrs and participated in the collection of fecal samples.
Disclosure statement
No potential conflict of interest was reported by the authors.
Additional information
Funding
References
- Aivelo T, Laakkonen J, Jernvall J. 2016. Population- and individual-level dynamics of the intestinal microbiota of a small primate. Applied and Environmental Microbiology 82(12):3537–3545. DOI:10.1128/AEM.00559-16.
- Amato KR. 2016. Incorporating the gut microbiota into models of human and non‐human primate ecology and evolution. American Journal of Physical Anthropology 159:196–215. DOI:10.1002/ajpa.22908.
- Bennett G, Malone M, Sauther ML, Cuozzo FP, White BA, Nelson KE, Stumpf RM, Knight R, Leigh SR, Amato KR. 2016. Host age, social group, and habitat type influence the gut microbiota of wild ring-tailed lemurs (Lemur catta). American Journal of Primatology 78(8):883–892. DOI:10.1002/ajp.22555.
- Bergman E. 1990. Energy contributions of volatile fatty acids from the gastrointestinal tract in various species. Physiological Reviews 70(2):567–590. DOI:10.1152/physrev.1990.70.2.567.
- Bohmig GA, Krieger PM, Saemann MD, Wenhardt C, Pohanka E, Zlabinger GJ. 1997. n-butyrate downregulates the stimulatory function of peripheral blood-derived antigen-presenting cells: A potential mechanism for modulating T-cell responses by short-chain fatty acids. Immunology 92(2):234–243. DOI:10.1046/j.1365-2567.1997.00337.x.
- Bolnick DI, Snowberg LK, Hirsch PE, Lauber CL, Org E, Parks BW, Lusis AJ, Knight R, Caporaso JG, Svanback R. 2014. Individual diet has sex-dependent effects on vertebrate gut microbiota. Nature Communications 5(1):1–13. DOI:10.1038/ncomms5500.
- Bonder MJ, Kurilshikov A, Tigchelaar EF, Mujagic Z, Imhann F, Vila AV, Deelen P, Vatanen T, Schirmer M, Smeekens SP. 2016. The effect of host genetics on the gut microbiome. Nature Genetics 48(11):1407–1412. DOI:10.1038/ng.3663.
- Boulangé CL, Neves AL, Chilloux J, Nicholson JK, Dumas M-E. 2016. Impact of the gut microbiota on inflammation, obesity, and metabolic disease. Genome Medicine 8(1):1–12. DOI:10.1186/s13073-016-0303-2.
- Buffa G, Ferrari C, Lovari S 1998. The upper subalpine vegetation of Sagarmatha National Park (Khumbu Himal area, Nepal) and its relationship with Himalayan tahr, musk deer and domestic yak. An outline. Top of the World environmental research: Mount Everest–Himalayan ecosystem, pp. 167–175.
- Caporaso JG, Kuczynski J, Stombaugh J, Bittinger K, Bushman FD, Costello EK, Fierer N, Pena AG, Goodrich JK, Gordon JI. 2010. QIIME allows analysis of high-throughput community sequencing data. Nature Methods 7(5):335–336. DOI:10.1038/nmeth.f.303.
- Chen C, Huang X, Fang S, Yang H, He M, Zhao Y, Huang L. 2018. Contribution of host genetics to the variation of microbial composition of cecum lumen and feces in pigs. Frontiers in Microbiology 9. DOI:10.3389/fmicb.2018.02626.
- Chi X, Gao H, Wu G, Qin W, Song P, Wang L, Chen J, Cai Z, Zhang T. 2019. Comparison of gut microbiota diversity between wild and captive bharals (Pseudois nayaur). BMC Veterinary Research 15(1):243. DOI:10.1186/s12917-019-1993-7.
- de la Cuesta-Zuluaga J, Kelley ST, Chen Y, Escobar JS, Mueller NT, Ley RE, McDonald D, Huang S, Swafford AD, Knight R. 2019. Age-and sex-dependent patterns of gut microbial diversity in human adults. Msystems 4(4). DOI:10.1128/mSystems.00261-19.
- DeSantis TZ, Hugenholtz P, Larsen N, Rojas M, Brodie EL, Keller K, Huber T, Dalevi D, Hu P, Andersen GL. 2006. Greengenes, a chimera-checked 16S rRNA gene database and workbench compatible with ARB. Applied and Environmental Microbiology 72(7):5069–5072. DOI:10.1128/AEM.03006-05.
- Duffy JE, Godwin CM, Cardinale BJ. 2017. Biodiversity effects in the wild are common and as strong as key drivers of productivity. Nature 549(7671):261–264. DOI:10.1038/nature23886.
- Edgar RC. 2013. UPARSE: Highly accurate OTU sequences from microbial amplicon reads. Nature Methods 10(10):996–998. DOI:10.1038/nmeth.2604.
- Edgar RC, Haas BJ, Clemente JC, Quince C, Knight R. 2011. UCHIME improves sensitivity and speed of chimera detection. Bioinformatics 27(16):2194–2200. DOI:10.1093/bioinformatics/btr381.
- Falony G, Joossens M, Vieira-Silva S, Wang J, Darzi Y, Faust K, Kurilshikov A, Bonder MJ, Valles-Colomer M, and Vandeputte D. 2016. Population-level analysis of gut microbiome variation. Science 352(6285):560–564. DOI:10.1126/science.aad3503.
- Fan P, Bian B, Teng L, Nelson CD, Driver J, Elzo MA, Jeong KC. 2020. Host genetic effects upon the early gut microbiota in a bovine model with graduated spectrum of genetic variation. The ISME Journal 14(1):302–317. DOI:10.1038/s41396-019-0529-2.
- Fan P, Liu P, Song P, Chen X, Ma X. 2017. Moderate dietary protein restriction alters the composition of gut microbiota and improves ileal barrier function in adult pig model. Scientific Reports 7(1):43412. DOI:10.1038/srep43412.
- Gentile CL, Weir TL. 2018. The gut microbiota at the intersection of diet and human health. Science 362(6416):776–780. DOI:10.1126/science.aau5812.
- Glowacki RW, Martens EC. 2020. In sickness and health: Effects of gut microbial metabolites on human physiology. PLoS Pathogens 16(4):e1008370. DOI:10.1371/journal.ppat.1008370.
- Goodrich JK, Waters JL, Poole AC, Sutter JL, Koren O, Blekhman R, Beaumont M, Van Treuren W, Knight R, Bell JT. 2014. Human genetics shape the gut microbiome. Cell 159(4):789–799. DOI:10.1016/j.cell.2014.09.053.
- Hall AB, Tolonen AC, Xavier RJ. 2017. Human genetic variation and the gut microbiome in disease. Nature Reviews Genetics 18(11):690. DOI:10.1038/nrg.2017.63.
- Hu X, Liu G, Li Y, Wei Y, Lin S, Liu S, Zheng Y, Hu D. 2018. High-throughput analysis reveals seasonal variation of the gut microbiota composition within forest musk deer (Moschus berezovskii). Frontiers in Microbiology 9:1674. DOI:10.3389/fmicb.2018.01674.
- Huse SM, Welch DM, Morrison HG, Sogin ML. 2010. Ironing out the wrinkles in the rare biosphere through improved OTU clustering. Environmental Microbiology 12(7):1889–1898. DOI:10.1111/j.1462-2920.2010.02193.x.
- Hwang IY, Chang MW. 2020. Engineering commensal bacteria to rewire host–microbiome interactions. Current Opinion in Biotechnology 62:116–122. DOI:10.1016/j.copbio.2019.09.007.
- Ilinskaya ON, Ulyanova VV, Yarullina DR, Gataullin IG. 2017. Secretome of intestinal Bacilli: A natural guard against pathologies. Frontiers in Microbiology 8:1666. DOI:10.3389/fmicb.2017.01666.
- Isbell F, Craven D, Connolly J, Loreau M, Schmid B, Beierkuhnlein C, Bezemer TM, Bonin CL, Bruelheide H, De Luca E. 2015. Biodiversity increases the resistance of ecosystem productivity to climate extremes. Nature 526(7574):574–577. DOI:10.1038/nature15374.
- Jandhyala SM, Talukdar R, Subramanyam C, Vuyyuru H, Sasikala M, Reddy DN. 2015. Role of the normal gut microbiota. World Journal of Gastroenterology: WJG 21(29):8787. DOI:10.3748/wjg.v21.i29.8787.
- Ke D, Xianghao Z, Shuzhen L. 2007. Quantitative assessment on endangerment degree of rare animal and plant species in Tibet, China. Wuhan University Journal of Natural Sciences 12(4):684–688. DOI:10.1007/s11859-006-0360-2.
- Kim YS, Unno T, Kim B, Park M. 2020. Sex differences in gut microbiota. The World Journal of Men’s Health 38(1):48–60. DOI:10.5534/wjmh.190009.
- Kittur S, Sathyakumar S, Rawat GS. 2010. Assessment of spatial and habitat use overlap between Himalayan tahr and livestock in Kedarnath Wildlife Sanctuary, India. European Journal of Wildlife Research 56(2):195–204. DOI:10.1007/s10344-009-0302-3.
- Koh A, De Vadder F, Kovatcheva-Datchary P, Backhed F. 2016. From dietary fiber to host physiology: Short-chain fatty acids as key bacterial metabolites. Cell 165(6):1332–1345. DOI:10.1016/j.cell.2016.05.041.
- Kong F, Zhao J, Han S, Zeng B, Yang J, Si X, Yang B, Yang M, Xu H, Li Y. 2014. Characterization of the gut microbiota in the red panda (Ailurus fulgens). PLoS ONE 9(2):e87885. DOI:10.1371/journal.pone.0087885.
- Kovacs A, Ben-Jacob N, Tayem H, Halperin E, Iraqi FA, Gophna U. 2011. Genotype is a stronger determinant than sex of the mouse gut microbiota. Microbial Ecology 61(2):423–428. DOI:10.1007/s00248-010-9787-2.
- Leng Y, Yi M, Fan J, Bai Y, Ge Q, Yao G. 2016. Effects of acute intra-abdominal hypertension on multiple intestinal barrier functions in rats. Scientific Reports 6(1):22814. DOI:10.1038/srep22814.
- Li J, Jia H, Cai X, Zhong H, Feng Q, Sunagawa S, Arumugam M, Kultima JR, Prifti E, Nielsen T. 2014. An integrated catalog of reference genes in the human gut microbiome. Nature Biotechnology 32(8):834–841. DOI:10.1038/nbt.2942.
- Lovari S, Pellizzi B, Boesi R, Fusani L. 2009. Mating dominance amongst male Himalayan tahr: Blonds do better. Behavioural Processes 81(1):20–25. DOI:10.1016/j.beproc.2008.12.008.
- Ma Z, Li W. 2019. Microgenderome: How and why men and women differ in their microbiomes: Medical ecology and network analyses of the microgenderome (Adv. Sci. 23/2019). Advanced Science 6(23):1970140. DOI:10.1002/advs.201970140.
- Magoč T, Salzberg SL. 2011. FLASH: Fast length adjustment of short reads to improve genome assemblies. Bioinformatics 27(21):2957–2963. DOI:10.1093/bioinformatics/btr507.
- Maurice CF, Knowles SC, Ladau J, Pollard KS, Fenton A, Pedersen AB, Turnbaugh PJ. 2015. Marked seasonal variation in the wild mouse gut microbiota. The ISME Journal 9(11):2423–2434. DOI:10.1038/ismej.2015.53.
- Min Y, Ma X, Sankaran K, Ru Y, Chen L, Baiocchi M, Zhu S. 2019. Sex-specific association between gut microbiome and fat distribution. Nature Communications 10(1):1–9. DOI:10.1038/s41467-019-10440-5.
- Moeller AH, Ochman H. 2013. Factors that drive variation among gut microbial communities. Gut Microbes 4(5):403–408. DOI:10.4161/gmic.26039.
- Murphy EF, Cotter PD, Healy S, Marques TM, Osullivan O, Fouhy F, Clarke SF, Otoole PW, Quigley EM, Stanton C. 2010. Composition and energy harvesting capacity of the gut microbiota: Relationship to diet, obesity and time in mouse models. Gut 59(12):1635–1642. DOI:10.1136/gut.2010.215665.
- Niu Q, Li P, Hao S, Zhang Y, Kim SW, Li H, Ma X, Gao S, He L, Wu W. 2015. Dynamic distribution of the gut microbiota and the relationship with apparent crude fiber digestibility and growth stages in pigs. Scientific Reports 5(1):9938. DOI:10.1038/srep09938.
- Oksanen J, Blanchet FG, Kindt R, Legendre P, Minchin PR, O’hara R, Simpson GL, Solymos P, Stevens MHH, Wagner H. 2013. Package ‘vegan’. Community Ecology Package, Version 2(9):1–295.
- Popovich DG, Jenkins DJ, Kendall CW, Dierenfeld ES, Carroll RW, Tariq N, Vidgen E. 1997. The western lowland gorilla diet has implications for the health of humans and other hominoids. The Journal of Nutrition 127(10):2000–2005. DOI:10.1093/jn/127.10.2000.
- Ramsey D, Forsyth DM. 2018. Estimates of Himalayan Tahr (Hemitragus jemlahicus) abundance in New Zealand: Results from aerial surveys. Unpublished Client Report for the New Zealand Department of Conservation. Arthur Rylah Institute for Environmental Research, Department of Environment, Land, Water and Planning, Heidelberg, Victoria.
- Ren T, Boutin S, Humphries MM, Dantzer B, Gorrell JC, Coltman DW, Mcadam AG, Wu M. 2017. Seasonal, spatial, and maternal effects on gut microbiome in wild red squirrels. Microbiome 5(1):163.
- Richard AF, Dewar RE, Schwartz M, Ratsirarson J. 2000. Mass change, environmental variability and female fertility in wild Propithecus verreauxi. Journal of Human Evolution 39(4):381–391. DOI:10.1006/jhev.2000.0427.
- Ropiquet A, Hassanin A. 2005. Molecular evidence for the polyphyly of the genus Hemitragus (Mammalia, Bovidae). Molecular Phylogenetics and Evolution 36(1):154–168. DOI:10.1016/j.ympev.2005.01.002.
- Rowland I, Gibson G, Heinken A, Scott K, Swann J, Thiele I, Tuohy K. 2018. Gut microbiota functions: Metabolism of nutrients and other food components. European Journal of Nutrition 57(1):1–24. DOI:10.1007/s00394-017-1445-8.
- Shi Y, Miao Z-Y, Su J-P, Wasser SK. 2021. Shift of maternal gut microbiota of Tibetan antelope (pantholops hodgsonii) during the periparturition period. Current Microbiology 78(2):727–738. DOI:10.1007/s00284-020-02339-y.
- Smith AT, Xie Y, Hoffmann RS, Lunde D, MacKinnon J, Wilson DE, Wozencraft WC, Gemma F. 2010. A guide to the mammals of China. Princeton, USA: Princeton University Press.
- Springer A, Fichtel C, Al‐Ghalith GA, Koch F, Amato KR, Clayton JB, Knights D, Kappeler PM. 2017. Patterns of seasonality and group membership characterize the gut microbiota in a longitudinal study of wild Verreaux’s sifakas (Propithecus verreauxi). Ecology and Evolution 7(15):5732–5745. DOI:10.1002/ece3.3148.
- Stevens CE, Hume ID. 1998. Contributions of microbes in vertebrate gastrointestinal tract to production and conservation of nutrients. Physiological Reviews 78(2):393–427. DOI:10.1152/physrev.1998.78.2.393.
- Sun B, Wang X, Bernstein S, Huffman MA, Xia D-P, Gu Z, Chen R, Sheeran LK, Wagner RS, Li J. 2016. Marked variation between winter and spring gut microbiota in free-ranging Tibetan Macaques (Macaca thibetana). Scientific Reports 6:26035.
- Sun G, Zhang H, Wei Q, Zhao C, Yang X, Wu X, Xia T, Liu G, Zhang L, Gao Y. 2019. Comparative analyses of fecal microbiota in european mouflon (ovis orientalis musimon) and blue sheep (Pseudois nayaur) living at low or high altitudes. Frontiers in Microbiology 10:1735. DOI:10.3389/fmicb.2019.01735.
- Takagi T, Naito Y, Inoue R, Kashiwagi S, Uchiyama K, Mizushima K, Tsuchiya S, Dohi O, Yoshida N, Kamada K. 2019. Differences in gut microbiota associated with age, sex, and stool consistency in healthy Japanese subjects. Journal of Gastroenterology 54(1):53–63. DOI:10.1007/s00535-018-1488-5.
- Tal M, Weese JS, Gomez DE, Hesta M, Steiner JM, Verbrugghe A. 2020. Bacterial fecal microbiota is only minimally affected by a standardized weight loss plan in obese cats. BMC Veterinary Research 16(1):1–15. DOI:10.1186/s12917-020-02318-2.
- Thaiss CA, Zmora N, Levy M, Elinav E. 2016. The microbiome and innate immunity. Nature 535(7610):65–74. DOI:10.1038/nature18847.
- Wang Q, Garrity GM, Tiedje JM, Cole JR. 2007. Naive Bayesian classifier for rapid assignment of rRNA sequences into the new bacterial taxonomy. Applied and Environmental Microbiology 73(16):5261–5267. DOI:10.1128/AEM.00062-07.
- Wang S. 1998. China red data book of endangered animals: Mammalia. Beijing, CHN: Science Press.
- Wong SH, Yu J. 2019. Gut microbiota in colorectal cancer: Mechanisms of action and clinical applications. Nature Reviews Gastroenterology & Hepatology 16(11):690–704.
- Youngblut ND, Reischer GH, Walters W, Schuster N, Walzer C, Stalder G, Ley RE, Farnleitner AH. 2019. Host diet and evolutionary history explain different aspects of gut microbiome diversity among vertebrate clades. Nature Communications 10(1):1–15. DOI:10.1038/s41467-019-10191-3.
- Zhao G, Ma T, Tang W, Li D, Mishra SK, Xu Z, Wang Q, Jie H. 2019. Gut microbiome of Chinese forest musk deer examined across gender and age. BioMed Research International 2019:1–10. DOI:10.1155/2019/9291216.
- Zhao J, Yao Y, Li D, Xu H, Wu J, Wen A, Xie M, Ni Q, Zhang M, Peng G. 2018. Characterization of the gut microbiota in six geographical populations of Chinese rhesus macaques (Macaca mulatta), implying an adaptation to high-altitude environment. Microbial Ecology 76(2):565–577. DOI:10.1007/s00248-018-1146-8.
- Zhu Z, Sun Y, Zhu F, Liu Z, Pan R, Teng L, Guo S. 2020. Seasonal variation and sexual dimorphism of the microbiota in wild blue sheep (Pseudois nayaur). Frontiers in Microbiology 11:1260. DOI:10.3389/fmicb.2020.01260.