
Abstract
Implementing efforts to understand biogeographic distribution patterns and taxonomic limits within animal groups is crucial for addressing several challenges of modern zoology. Although avian phylogeography has been extensively investigated within the Western Palearctic, several families, such as shrikes, still display unresolved or neglected biogeographic patterns both between and within species, thus requiring further investigations. The Woodchat Shrike (Lanius senator) is a long-distance migratory species that exhibits three morphologically well-recognizable subspecies, whose boundaries have never been phylogenetically investigated. Here, we aimed to define the phylogeographic structure of Lanius senator throughout its breeding range and assess the genetic coherence with respect to the phenotypically described subspecies. We assembled a collection of 34 samples mainly from breeding populations of each subspecies and analysed them using four mtDNA and two nuDNA markers. We did not find clear phylogenetic structure in nuclear Ornithine Decarboxylase (ODC) and Myoglobin intron 2 (MYO), but all the four mtDNA loci (i.e., ND2, COI, cytb and CR) highlighted two main haplogroups: one including both the nominate subspecies L. s. senator and L. s. badius and a second one consisting of L. s. niloticus (the easternmost part of its range). Surprisingly, individuals phenotypically assigned to L. s. niloticus from Israel were genetically assigned to the senator/badius haplogroup. Moreover, genetic distances between haplogroups showed intermediate values between inter-intraspecies diversity usually reported for Passerines. We estimated a divergence time at ca. 890 kya (554–1.259 kya HPD). Our findings showed a mismatch in subspecies assignment using morphology and genetic information and a marked differentiation between the eastern L. s. niloticus and all other L. senator populations sampled.
Keywords:
Introduction
Understanding taxonomic boundaries by assessing genetic structure and biogeographic distributions of natural populations is essential to promote biodiversity conservation (e.g., Lohman et al. Citation2010; Huntley et al. Citation2019; Galimberti et al. Citation2021), and to include phylogenetic inference and speciation dynamics in modern zoology (Degnan & Rosenberg Citation2009; Shi & Rabosky Citation2015). In birds, a growing body of literature suggests that many recognized subspecies, which were named via often subtle variations in plumage or morphology, are either poorly circumscribed in terms of geographic distribution, or are invalid when assessed via molecular methods (e.g., White et al. Citation2013; Wojczulanis-Jakubas et al. Citation2014; Semenov et al. Citation2017).
The Western Palearctic (WP) is one of the most investigated biogeographic regions in terms of avian phylogeography, where to date 145 bird species have been the focus of molecular analyses (Pârâu & Wink Citation2021). Despite fairly good coverage in terms of analysed species (i.e., approximately 20% of the 720 WP breeding species; Pârâu & Wink Citation2021), the WP continues to present challenges related to species-complexes that have been poorly (and perhaps never) investigated, as well as unsampled areas in previous studies (e.g., Ilahiane et al. Citation2021). The second challenge is particularly important in relation to the southern areas of Europe, several of which are known glacial refugia. It is clear that these refugia played a decisive role in shaping intra and interspecific geographical variations, with phylogeographic studies identifying Iberia, Southern Italy or the Balkans as regions where populations accumulated genetic differences (e.g., Brito Citation2005; Pellegrino et al. Citation2015; Drovetski et al. Citation2018a; Albrecht et al. Citation2020). Strong intraspecific differentiation is rare in migratory WP species (Pârâu & Wink Citation2021), being instead largely confined to sedentary or short-distance (intra-Palearctic) species.
Shrikes (Passeriformes; Laniidae) are one group that has received considerable attention through phylogeographic studies, and 3 out of 8 species with a range that includes Western Palearctic regions have been investigated (Gonzalez et al. Citation2008; Olsson et al. Citation2010; Kvist et al. Citation2011; Padilla et al. Citation2015; Pârâu et al. Citation2019). Different phylogenetic studies conducted on Lanius species showed complicated biogeographic and evolutionary patterns both between and within species. In some cases, the distinction between species and subspecies remains poorly understood, and genetic studies show unclear and complex relationships among morphologically described taxa (species and subspecies, Peer et al. Citation2011; Fuchs et al. Citation2019). One case where possible confusion still exists in terms of subspecies taxonomy is the Woodchat Shrike Lanius senator. The Woodchat Shrike is a polytypic species which breeds in the Western Palearctic (), with all populations migrating long distance to winter in sub-Saharan Africa (Shirihai & Svensson Citation2018). Several subspecies have been described, based on breeding, migrating, or wintering individuals. A detailed list of taxa and synonyms proposed over time by several authors is shown in Table S1. The various subspecies designations have been based on subtle plumage differences or on morphological characteristics. Consequently, most recent taxonomic treatments recognize only three subspecies: Lanius senator senator, L. s. badius and L. s. niloticus (del Hoyo et al. Citation2008; Dickinson & Christidis Citation2014; Shirihai & Svensson Citation2018; Clements et al. Citation2021; Gill et al. Citation2021), although a few exceptions consider L. s. rutilans as a valid taxon (Cramp & Perrins Citation1993; Del Hoyo & Collar Citation2016). None of these taxonomic decisions were based on genetic data.
Figure 1. Breeding range of Lanius senator. Coloured areas delimit the distribution of subspecies L. s. senator, L. s. badius, L. s. niloticus, as shown in the legend. Black dots define the samples size for each locality (specific details on sampling sites are reported in & Figure S2). Wintering range is not shown, although we included a Genbank sequence from Gambia in the analysis. The map was made with QGIS 3.16.10 (https://qgis.org) and it was based on BirdLife international and Handbook of the Birds of the World (2020).
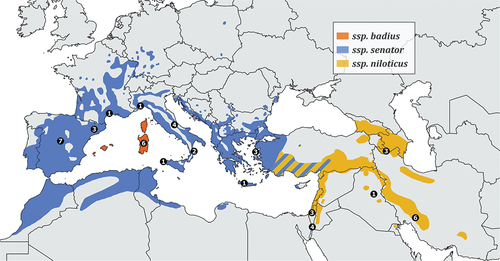
Table I. List of specimens investigated in this study with voucher/accession number, subspecies, sex, sampling locality and origin.
Lanius senator senator is widespread across the Mediterranean basin from the Iberian Peninsula to Western Turkey () and winters in Sub-Saharan Africa from Senegal to Sudan. The subspecies is characterised by a moderately large white primary patch and no or very little white at the base of the tail feathers, a characteristic visible only when examined at close range. Individuals from Eastern Greece and Western Turkey show on average more white on the wings and tail, morphologically resembling L. s. niloticus. This phenotypic intergradation has also recently been reported in the very few individuals breeding in Cyprus (less than five pairs in recent years; Peter Flint & Colin Richardson, in prep.). L. s. badius is endemic to the Balearics, Corsica and Sardinia and winters from West Africa east to Cameroon. It differs from the other subspecies in having no (or a tiny) white spot on the primaries, showing on average a darker back, and a lack of white on tail coverts and feathers. The subspecies is also generally larger with a stronger bill and shows a less marked sexual dimorphism than the other subspecies. L. s. niloticus breeds from southern Turkey eastward across the Middle East and Transcaucasia to south-eastern Iran (), and winters in the extreme south of the Arabian Peninsula, and East Africa. It differs from the other subspecies in having a larger white base on all tail feathers (up to 32 mm) that is often visible in the field, a larger white patch on primary feathers and whiter underparts. Collectively, these features give the impression of a more black-and-white bird than the other subspecies. The taxon L. s. rutilans, described from Senegal and reported as breeding in the Iberian Peninsula and North Africa was recognized as valid by comparatively few authors until recently (see Table S1), but it does not show any clear difference in plumage or morphology relative to the three broadly accepted taxa (Shirihai & Svensson Citation2018).
In some cases, the range of the above-mentioned taxa overlap. For example, while Roselaar (Citation1995) confirmed the presence of both L. s. senator and L. s. niloticus as common breeders in western or south-eastern Turkey, respectively, he also reported the presence of an admixture zone or localised areas where the taxonomic attribution of individuals is uncertain. This uncertainty generally occurs in the Anti-Taurus Mountains (southern and eastern Turkey) and in the coastal area of south-central Turkey near the Syrian border. In addition, Shirihai (Citation1996) indicated that while L. s. niloticus is the only breeding taxon in Israel, where it is also common during migration, L. s. senator is also a migrant there, albeit scarce (around 10% of the total migrating Woodchat Shrikes) and restricted to a narrow migration window (mainly from mid-April to the beginning of May). Finally, the presumed L. s. rutilans would have a partially overlapping distribution with L. s. senator in the north-east of the Iberian Peninsula.
In this study, using a multi-locus genetic approach (i.e., two nuclear and four mitochondrial markers) we investigated, for the first time, the phylogeographic structure of Lanius senator throughout most of the breeding range of the species, and inferred the genetic relationships and differentiation among populations of the three widely accepted subspecies (L. s. senator, L. s. niloticus and L. s. badius).
Materials and methods
Sample collection
We collected 34 samples of Lanius senator from different localities spread across the breeding range of the species (). The biological samples consisted of muscle tissue (N = 21), DNA extract (N = 3) from museum collections, or blood (N = 10) collected in the field by the authors (see Supplementary Information 1 for samples detail). Muscle tissues were preserved in 96–100% ethanol, while blood was preserved in ethanol or Queen’s Lysis buffer (Seutin et al. Citation1991). In both cases, samples were stored at −20°C until laboratory analysis.
In particular, we obtained samples of breeding L. senator from northern and southern Italy (including Sardinia), Armenia, Iran, north-eastern and central Spain ( and S1). We also added a few samples of migrating individuals collected on Marettimo Island (off western Sicily) and Eilat (southern Israel). These samples were included into the analysis since their taxonomic attribution in the field was certain, being based mainly on plumage features, following Svensson (Citation1992).
In order to achieve a broader assessment of geographic structure, we included in our data set Woodchat Shrike sequences from Greece, Iraq, France and Israel available on the GenBank® (www.ncbi.nlm.nih.gov/genbank) and BOLD systems (Ratnasingham & Hebert Citation2007, and S2, ). When missing, we inferred the putative subspecies based on the location and the collection date of the sample. The final dataset includes representative individuals from localities encompassing the breeding distribution of the three currently recognized subspecies (i.e., L. s. senator, L. s. badius, and L. s. niloticus). We selected four mitochondrial markers to investigate the genetic structure of the species: NADH dehydrogenase subunit 2 (ND2), cytochrome b (cytb), cytochrome c oxidase I (COI), and a fragment of the control region (CR). Additionally, for a subset of specimens, we sequenced the nuclear intron 2 of myoglobin (MYO, N = 14), and introns 6–7 of the ornithine decarboxylase (ODC, N = 16) genes (Table S2).
DNA extraction, amplification and sequencing
Total genomic DNA was isolated with the NucleoSpin Tissue kit (Macherey-Nagel, Düren, Germany), following the manufacturer’s protocols. Afterward, we amplified and sequenced the selected loci, using a combination of published primers following molecular procedures as described in Pellegrino et al. (Citation2017). Primer details and annealing temperatures are reported in Table S3. When the first round of amplification or sequencing failed, and for the amplification of nuclear loci, we performed PCRs by using the puReTaq Ready-To-Go PCR beads (Amersham Bioscience, Freiburg, Germany) in a 25 µL reaction according to the manufacturer’s given instructions.
After verifying amplicon occurrence and length through agarose gel electrophoresis, the PCR products were cleaned with ExoSAP-ITA PCR Product Cleanup Reagent (Thermo Fisher Scientific, Waltham, Massachusetts, USA). The sequencing reaction was performed with an ABI 3730xl DNA Analyzer by Macrogen Europe Inc. (Amsterdam, The Netherlands) using the same PCR primer pairs, except for ND2 H1064 which was replaced by the internal forward primer L347.
Haplotype analysis
Electropherograms were visualized with Bioedit 7.2 (Hall Citation1999), and for nuclear markers, any heterozygous site was marked as a mixed base following the nucleotide IUPAC code. Forward and reverse runs were aligned with the ClustalW algorithm (Larkin et al. Citation2007) with default settings.
All the nucleotide sequences generated in this study were submitted to GenBank accession numbers OD991799–OD992005, Table S2).
Aligned nucleotide sequences were collapsed into unique haplotypes using FaBox 1.5 (Villesen Citation2007) for each single marker and for the concatenated dataset. For each sample, the nucleotide sequences of the four analysed mitochondrial markers were concatenated to create a single dataset.
In order to investigate the frequency and geographic distribution of mtDNA haplotypes, median-joining networks, encompassing all the investigated Lanius senator populations (), were built using the median-joining algorithm implemented in PopART 1.7 (Leigh & Bryant Citation2015). Haplotype networks were generated for each single mtDNA marker (Figure S1) and for the concatenated dataset ().
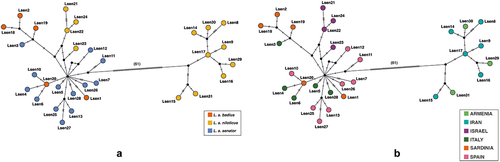
Figure 2. Haplotype median-joining networks of the concatenated mtDNA dataset. (a) shows haplotypes network based on putative subspecies designations (see inset), while (b) is based on sampling locality (see inset).
Phylogenetic analyses and molecular dating
Mitochondrial gene tree reconstruction was performed using Bayesian Inference (BI) implemented in MrBayes 3.2.7 (Ronquist et al. Citation2012), for haplotypes belonging to both the single markers and the concatenated dataset. Available sequences were retrieved for L. senator and other Lanius species from GenBank and were added to the original dataset in order to increase geographic distribution of L. senator and to root the trees (other Lanius taxa) (Table S2 and ). The best-fitting nucleotide substitution model for the individual mtDNA gene datasets were inferred using JModelTest 2.1 (Posada Citation2008), under the corrected Akaike Information Criterion (AIC), with the following results: GTR+G for ND2, HKY+I for cytb, GTR+I+G for COI, GTR+G for CR. Moreover, using PartitionFinder 2.1 (Lanfear et al. Citation2017) we assessed the best partition scheme and the best corresponding nucleotide substitution models for mtDNA concatenated dataset, based on single codon position in coding genes (HKY for ND2_pos1, GTR+G for ND2_pos2, COI_pos3, ND2_pos3, cytb_pos3, GTR+I for COI_pos1, cytb_pos1, CR, GTR+I+G for cytb_pos2, COI_pos2). In MrBayes, two independent runs were performed by setting 4 Metropolis-coupled MCMC, 3 heated and 1 cold, with temperature command equal to 0.2. A total number of 2*106 iterations were performed, with sampling every 1000 iterations; 25% of the samples were discarded as burn-in. We ensured that the standard deviation of split frequencies converged towards zero and that the potential-scale reduction factor (PSRF) was reasonably close to 1.0 for all parameters. Furthermore, we checked the outcome files in Tracer 1.7 (Rambaut et al. Citation2018) to make sure the posterior distribution of the runs converged, and that the ESS was higher than 200 for meaningful parameter estimations.
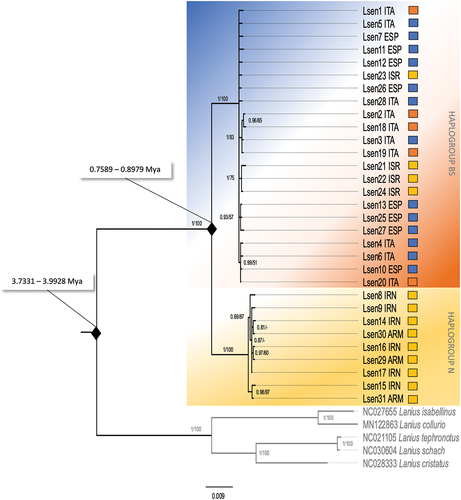
Figure 3. Bayesian Inference and Neighbor-Joining phylogenetic tree of the concatenated mtDNA haplotypes. Numbers on the nodes refer to BI posterior probabilities (left) and to bootstrap support values of the NJ analysis (right) using the p-distance substitution model. Thresholds for both BI posterior probabilities and bootstrap support values were set at ≥50%; dashes represent values below that threshold. The colours shown here mimic those used in , such that the orange-blue background corresponds to the badius/senator (BS) haplogroup, while the yellow background represents the niloticus (N) haplogroup. Squares to the right of each individual define the putative subspecies attributed to the individual, based on geography and morphology.
In addition to the BI reconstruction, we performed a Neighbor-Joining (NJ) (Saitou & Nei Citation1987) analysis for the mtDNA concatenated dataset employing Mega X (Kumar et al. Citation2018), and using uncorrected p-distance. The topology of the trees was visualized with FigTree 1.4 (Rambaut Citation2008). Sequences from different species of Lanius were added as outgroups in the mtDNA four gene dataset, GenBank ID and species details are indicated in and S2(a–d). In addition, one L. senator sequence available sequence on GenBank from Gambia was aligned in the ND2 dataset in order to investigate its position in a phylogenetic tree.
For the nuDNA markers analysis, we used PHASE 2.1 (Stephens et al. Citation2001) as implemented in DNASP 5.10 (Librado & Rozas Citation2009) to infer heterozygous sites and the corresponding alleles. Two runs were performed, one with default settings and the second with 1000 iterations and 100 of burn-in. We used a posterior probability threshold of 0.9 to determine the most probable haplotype for each nuclear sequence, and we removed the individuals that did not satisfy this threshold; no significant differences were found between the two runs.
As an alternative to concatenation, we performed a Bayesian concordance analysis (BCA) for nuclear haplotypes tree, employing BUCKy 1.4 (Larget et al. Citation2010). We first created two different gene trees, one for MYO and one for ODC intron sequences (outgroups: Lanius collaris HQ996768–FJ358081, Lanius excubitor JN614750–JN614625), running a single run in MrBayes and setting 4 chains, 1,000,000 iterations, sampling every 1000 generations. The best nucleotide substitution models inferred by JModelTest were HKY+I for both the nuclear markers. Subsequently, we summarized the generated trees, and the first 25% of the trees were discarded as burn-in. The resulting output was processed in BUCKy to create a concordance tree and to calculate the concordance factors (CF) for clades. We used four different a priori levels of discordance among loci (α), set at 0.1, 1, 10, and 100, respectively. For each setting we ran four independent runs, using four Metropolis-coupled MCMC (three heated and one cold) of 1,000,000 of generations; no significant dissimilarities were found in CFs between the settings, so we report CFs for the α value of 100 (Figure S3). Tree topology was visualized in FigTree 1.4.
Divergence time between the main clades was estimated through a Bayesian approach in BEAST 1.10.4 (Suchard et al. Citation2018) using the ND2 and cytb markers. We incorporated best fit models for each gene and applied the lineage substitution rate of 0.014 per lineage/million years for cytb and 0.029 per lineage/million years for ND2 with standard deviations of 0.001 and 0.0025, respectively (Lerner et al. Citation2011). The analyses were performed using a strict molecular clock with the coalescent algorithm. Three separate MCMC analyses were run for 100,000,000 generations with parameters sampled every 10,000 steps, with a 10% burn-in, producing 10,000 trees each. The independent runs were combined using LogCombiner v.1.6.1 (Drummond et al. Citation2012), and the trees were summarized in TreeAnnotator v.1.10.4 (Drummond et al. Citation2012) as a Maximum Clade Credibility tree after discarding 10% as burn-in. Tracer v.1.7 (Drummond et al. Citation2012) was used to analyse the convergence of the posterior distribution in the three runs and to measure the effective sample size of each parameter (all >200). Tree topologies were assessed using FigTree v.1.4.
For each haplogroup, standard genetic indices, such as haplotype diversity, polymorphic sites, and nucleotide diversity, were calculated with DNASP 5.10. We also estimated neutrality parameters Fu’s Fst and Tajima’s D test with Arlequin 3.5 (Excoffier & Lischer Citation2010). We performed 1000 simulated samples with a threshold of 0.9 to obtain these values.
Genetic distances
Orthologous ND2, COI, cytb and CR sequences, belonging to 13 Lanius species, were downloaded from GenBank. After alignment (conducted with MAFFT 7.110 (Katoh & Standley Citation2013), using the E-INS-I option), sequences showing insertions/deletions (with the only exception of CR) that were missing >1% of sites or that were overlapping in length less than 75% with the region amplified and sequenced for the Italian samples, were discarded. After this filtering, a total of 35 ND2, 290 COI, 309 cytb, and 29 CR sequences were combined with the 34 sequenced Lanius senator samples to constitute a single dataset for each mtDNA marker (see Table S4).
We calculated the uncorrected pairwise genetic distances (p-distance) per marker between and within groups (i.e., for L. senator, for the two haplogroups of L. senator, and for all species belonging to the genus Lanius except for L. senator) using MEGA X (Kumar et al. Citation2018).
Results
DNA was successfully extracted from all samples, we thus obtained 34 sequences of ND2, cytb and CR and 32 of COI for a total sequence length of 997 bp for ND2, 660 bp for COI, 965 bp for cytb and 327 bp for CR. The mtDNA sequences were concatenated to obtain 2924 bp sequences. Moreover, we sequenced MYO (693 bp) and ODC (489 bp) nuclear genes in a subsample of 14 and 16 individuals, respectively (Table S2).
All identified mtDNA haplotypes were new, except for one haplotype of COI (LsenCOI_3 corresponding to the GenBank record JQ175216 and JQ175218 sampled in Greece) and one of CR (LsenCR_1 with AY599853 and AY599855 from Italy) which were recorded as L. s. senator and L. s. badius respectively.
After phasing the sequences of heterozygous individuals, we identified a total of eight haplotypes in MYO with eight variable sites, and 10 haplotypes with nine variable sites in ODC sequences. The recognized haplotypes were new except for two haplotypes of MYO: LsenMyo_1, the most frequent haplotype identified in individuals from Spain, Italy and Israel was recovered also in three individuals from GenBank sampled in France, Israel and Greece; and LsenMyo_2 identified from Sardinia and Armenia, which corresponds to a GenBank record from Israel (Table S2).
Haplotype analyses
The haplotype median-joining networks () based on the concatenated mtDNA dataset highlighted two different clusters separated by 61 mutational steps. The first cluster, containing the largest number of haplotypes and samples, includes L. s. senator individuals from Italy and Spain, L. s. badius individuals from Sardinia and presumed L. s. niloticus from Israel. The second cluster includes all individuals from Armenia and Iran, which are all ascribed to L. s. niloticus.
Haplotype networks calculated on single markers (Figure S1) confirmed the two main clusters, with the same structure. All the haplotypes within each haplogroup differed by only one to three mutations. These single marker haplotype networks showed that individuals identified as different subspecies can share haplotypes, for instance, LsenND2_3 was shared by both L. s. badius and senator, and LsenCOI_3 included individuals attributed to all three subspecies. The most frequent haplotype, identified for ND2, was LsenND2_4 shared by six individuals from Italy, Israel and Spain and ascribed to L. s. niloticus or L. s. senator, while LsenCytb_6 was shared by three individuals from Italy that were morphologically identified as L. s. senator or L. s. badius (Figure S1).
Phylogenetic analyses and molecular dating
Neighbour-joining and Bayesian inference trees constructed using the concatenated mtDNA dataset, as well as all individual loci datasets each recovered two well supported (Bayesian posterior probability = 1.0) clades ( and S2(a–d)), which corresponded to the haplotype network results. One monophyletic clade (N) included individuals ascribed to the subspecies L. s. niloticus, from Iran and Armenia. The second clade (BS) included all individuals from Israel, Greece, Italy, Sardinia, Sicily, France and Spain, thus encompassing birds classified as belonging to the three recognized subspecies of Woodchat Shrike (L. s. senator, L. s. badius L. s. niloticus). A GenBank sequence of a Woodchat Shrike from Gambia, part of the wintering range of the subspecies L. s. senator, clustered within the BS haplogroup.
Bayesian inference trees obtained for each individual gene (Figure S2(a–d)) highlighted that some haplotypes were restricted to single geographical populations, and in particular, the cytb phylogeny identified a moderately well-supported clade (0.85 estimated Bayesian posterior probability), comprising all samples from Israel (Figure S2(c)).
The phylogenetic trees based on nuclear markers revealed poorly structured clades (Figure S3), and no clear geographical differentiation. Individuals from Armenia and Iran (identified as L. s. niloticus, clade N in the mtDNA analyses) showed the same haplotype or clustered with individuals ascribed to the other two subspecies. The Bayesian concordance analysis (BCA) showed a clade with a low concordance including only individuals from Armenia and Iran (CF = 0.018) and a clade with a relatively high concordance (CF = 0.5) grouping exclusively individuals from all other sampling areas.
Our BEAST analyses of the more variable markers cytb and ND2 yielded two similar time-calibrated trees for Lanius senator. The divergence time was estimated for the Lanius senator clade at 3.7331 million years ago (Mya) (height 95% HPD: 2.7064–4.8326) and 3.9928 Mya (height 95% HPD: 2.8463–5.1903) for ND2 and cytb respectively. The divergence time from BS and N haplogroups was estimated at 0.7589 Mya (height 95% HPD: 0.4917–1.0384) by ND2 and 0.885 (height 95% HPD: 0.5431–1.209) by cytb ().
In order to evaluate the genetic distances between and within Lanius species, we constructed four datasets, one for each mtDNA locus, encompassing all the available sequences from GenBank, BOLD systems and from this study ( and S5). The average p-distances between Lanius species (excluded L. senator) ranged from 0.072 (±0.022) in COI to 0.096 (±0.033) in cytb. Average distance between the Lanius senator haplogroups N and BS ranged from 0.017 (±0.002) in CR to 0.036 (±0.006) in ND2. Average distances within Lanius species (excluded L. senator) ranged from 0.007 (±0.005) in ND2 and 0.012 (±0.011) in cytb. Within Lanius senator, the p-distances showed the highest value for ND2 (0.015 ± 0.017), and both ND2 and CR had higher values than the p-distances within Lanius. Average p-distances estimated within the N and the BS groups were highest for cytb (0.003 ± 0.002) and lowest for CR (0.002 ± 0.002).
Table II. Genetic distances (p-distance) dataset between and within different groups: within Lanius senator, between and within L. senator haplogroups N and L. senator haplogroups BS; Lanius spp. (excluding L. senator). Distances were estimated for all the mtDNA loci dataset (Table S4). Column S(n) includes the number of considered group/species and, within brackets, the overall number of considered sequences.
Estimated genetic diversity indices calculated in each clade and in the total dataset for each analysed marker are shown in . In mtDNA genes haplotype diversity (h) ranged from 0.962 (±0.016) for cytb to 0.661 (±0.075) for CR region. The highest value of h was found in N haplogroup for ND2 (0.972 ± 0.064), and the lowest value was for CR (0.222 ± 0.166), also in N haplogroup (). A significantly negative Tajima’s D value was observed for the BS haplogroup at all mtDNA markers, and a significantly negative Fu & Li’s D was observed at each of the four mtDNA markers across all haplogroups, with the exception of CR and cytb markers for the N haplogroup (). Haplotype diversity calculated on MYO and ODC sequences were 0.831 (±0.045) and 0.613 (±0.088) respectively; Tajima’s D and Fu & Li’s D test showed negative and significative values in the MYO dataset.
Table III. Genetic diversity indices calculated on mtDNA loci, concatenated mtDNA dataset, and nuDNA loci. * (p < 0.05), ** (p < 0.01).
Discussion
Our investigation of phylogeographic variation in the Woodchat Shrike showed unexpected results when considering the current state of knowledge regarding the three recognized subspecies’ distributional ranges and plumage diagnostic features.
Mitochondrial tree reconstruction and haplotype networks showed that our samples were not divided into three clades/haplogroups, as we initially hypothesized based on the three sampled subspecies, but were instead assigned to two strongly supported clades. One clade (N) contained individuals from Iran and Armenia, which correspond to the eastern portion of the putative L. s. niloticus breeding range (). The second clade (BS) grouped all the individuals from Italy, Spain, France, Greece, as well as those from Israel and Sardinia. Individuals from Israel were originally assigned as L. s. niloticus on the basis of plumage characteristics, sampling sites (see ) and dates (see Shirihai Citation1996), while individuals from Sardinia were referred to L. s. badius based on plumage and sampling location (see ). All other individuals in this clade were identified as L. s. senator. Genetic distance between the two haplogroups ranged from 1.7% to 3.6% depending on the molecular locus; these values are in the range of interspecific and intraspecific avian variability (Ward Citation2009).
Conversely to what we found for mitochondrial markers, the nuclear markers MYO and ODC showed low variability and did not reveal any clear geographical structure. Such discordance could be due to incomplete lineage sorting, ghost speciation, or asymmetrical sexual dispersion (Toews & Brelsford Citation2012). In this context, the mito-nuclear discordance we found here matches with findings in other Mediterranean populations of Passeriformes, such as Muscicapa tyrrhenica or Certhia familiaris (Pons et al. Citation2016, Citation2019), and in general, this discordance is prevalent in different animal systems (Toews & Brelsford Citation2012). A genome-wide sequencing approach could be useful to highlight genetic variation within such species to clarify the processes underlying the lack of structuring in nuclear genes (Calderón et al. Citation2016; Ottenburghs et al. Citation2019).
Several phylogenetic studies on Lanius species (Zhang et al. Citation2007; Gonzalez et al. Citation2008; Klassert et al. Citation2008; Fuchs et al. Citation2011; Olsson et al. Citation2013; Pârâu et al. Citation2019; Gill et al. Citation2021) have revealed a complex biogeographic history and that genetic data are often inconsistent with morphological characteristics, as already found in other avian species (e.g., Motacilla spp. Li et al. Citation2016; Drovetski et al. Citation2018b; Harris et al. Citation2018; Emberiza striolata Schweizer et al. Citation2017).
In the case of L. senator, we recovered two haplogroups within the breeding range of the species a widely distributed western haplogroup and a narrowly distributed eastern one. These distributions could support diversification of the two clades in two different areas, the Southern Caucasus in the case of L. s. niloticus and Iberia, Greece and Italy for Lanius s. senator and L. s. badius. The estimated origin of ca. 0.85 Mya for these two clades occurred during the Mid-Pleistocene Climate Transition (1.2–0.7 Mya), a shift in paleoclimatic periodicity from 41- to 100-kyr cycles, which led to major changes in global ice volume, sea level, and ocean temperature (Ruddiman et al. Citation1989), as well as an increase in aridity in Africa and the Arabian Peninsula (deMenocal Citation2004). The subsequent habitat reductions and changes could have divided and separated populations both in the wintering and in breeding areas, thereby resulting in genetic diversification. A similar divergence time between clades and a western versus eastern Palearctic distribution has been found in different bird species adapted to arid climates such as Galerida spp. (Guillaumet et al. Citation2008) and Chlamydotis spp. (Korrida & Schweizer Citation2013). Fuchs et al. (Citation2019) calculated the probability of the ancestral area for each Lanius species. Given their results, Africa (75%) and Europe (15%) were identified as ancestral areas for L. senator, which clustered in a clade of African origin. Therefore, the current distribution of L. senator is probably a consequence of an expansion from Africa, which may have begun with the colonization of the Arabian Peninsula. This colonization could have been facilitated by either the African-Eurasian connection in the Sinai area at the northwest end of the Red Sea, or at the south-eastern end of the Red Sea, where the Arabian Plate and the Nubian Shield were closer than at present (Bosworth et al. Citation2005). This latter connection has been implicated in colonization patterns for different terrestrial vertebrate lineages (Pook et al. Citation2009; Portik & Papenfuss Citation2015) including birds (Voelker et al. Citation2016). Considering the distribution of the individuals clustered in the N haplogroup, the Caucasian glacial refugium might have played an important role in preserving the observed genetic differences, as already shown for several avian species (Perktaş et al. Citation2015; Drovetski et al. Citation2018a; Pavia et al. Citation2021).
Surprisingly, in the western clade our mtDNA and nuDNA data did not allow us to genetically distinguish between the two putative subspecies L. s. senator and L. s. badius. These taxa display both an allopatric distribution and distinctive characteristics, to include bill size and shape, wing formula and plumage features; moreover, they overwinter in putatively different ranges (Small & Walbridge Citation2005). The morphological differentiation between the two taxa could have occurred very recently such that they are not yet distinguishable through molecular markers (or at least those we analysed). The differentiation could be due to refugial isolation during the Last Glacial Maximum or evolutionary diversification mediated by insular isolation. Differently from Lanius senator, well-defined Mediterranean lineages were found in other migratory birds to include Muscicapa tyrrhenica, Curruca sarda and the Curruca cantillans complex (Pons et al. Citation2016; Zuccon et al. Citation2020; Nespoli et al. Citation2021), as well as several mammals, butterflies, and reptiles (Grill et al. Citation2007).
The discordance between genetics and morphology could be due to an early stage of divergence with gene flow, or different selective conditions in the species range or sexual selection. Morphological and behavioural traits could play a decisive role in taxa differentiations (Slabbekoorn & Smith Citation2002) and for this reason they should be investigated and considered along with molecular markers. Moreover, our results showed also that this lack of genetic distinction also concerns the putative subspecies L. s. rutilans, which some authors recognize as valid (Table S1). However, all the Iberian individuals, including those from the described range for rutilans are part of the BS haplogroup, where there is no Iberian-distributed substructure.
Negative and significant values of Tajima’s D and Fu & Li’s D test in our results indicate a population expansion, and these results could be affected by the wide distribution of the utilized samples that comprise much of the breeding range, or these values could be indicative of a past population expansion, which is common in migrating species during post-glacial expansion (Fahey et al. Citation2012). The current status of L. senator (Near threatened, BirdLife International Citation2021) makes it even more urgent to deepen our general knowledge of the genetic characteristics of the different populations. In fact, declining local populations could increase the risk of genetic consequence due to their small size (Pertoldi et al. Citation2012).
Lastly, we want to draw attention to the morphological identification of L. s. niloticus which is often reported on Italian islands during spring migration (Brichetti & Fracasso Citation2007). Moreover, some of the individuals from Israel used in this study, identified as L. s. niloticus, clustered with L. s. badius/senator. Overall, our study showed that morphological characteristics alone can no longer be considered decisive for identifying Lanius senator subspecies with certainty and lays the groundwork for the development of a new diagnostic set of characters. In fact, our results point out the weakness of the presumably distinctive morphological characteristics between L. s. niloticus and L. s. senator indicated in literature (Svensson Citation1992; Demongin Citation2016).
In this respect, the subspecies breeding distributions should be investigated thoroughly, particularly in the taxonomically uncertain ranges in Turkey (Roselaar Citation1995), where Woodchat Shrike morphology is characterized by a gradient from west to east (i.e., eastern L. s. senator tend to resemble L. s. niloticus; Shirihai & Svensson Citation2018). Future work will be focused on determining whether the two subspecies hybridize (and if so, the extent of the contact zones) and to establish diagnostically reliable morphological characteristics using breeding individuals sampled outside the contact zones.
Although the present work has brought new insights into the phylogeographical aspects of Lanius senator, a second step will have to focus on sampling wintering areas and adding individuals from the Maghreb (north Africa) and Balearic Islands in order to have a more complete framework.
A final consideration concerns the conservation implications of Woodchat Shrike in a context of populations decline in different parts of its range (e.g., Italy; Brichetti & Grattini Citation2017) and the recent downgrade of its conservation status, which was changed from Least Concern to Near Threatened (BirdLife International Citation2021). The phylogeographic data highlighted two distinct and unique clades that both deserve particular attention in conservation efforts. New genetic data including samples from the Balearic Islands and across the wintering range could help to understand whether L. s. badius can be considered a valid subspecies or an Evolutionarily Significant Unit (ESU) (Ryder Citation1986) characterized by distinctive behavioural and phenotypic traits that may deserve conservation attention.
Supplemental Material
Download MS Excel (282.7 KB)Supplemental Material
Download MS Excel (26.4 KB)Supplemental Material
Download MS Excel (16.8 KB)Supplemental Material
Download MS Excel (90.5 KB)Supplemental Material
Download MS Excel (17.3 KB)Supplemental Material Figures
Download PDF (4.1 MB)Acknowledgements
We are grateful to the curators and directors of the following Museums and Collections for providing samples: Isabel Rey and Beatriz Alvarez Dorda (Museo Nacional de Ciencias Naturales, Madrid, Spain); Lars Erik Johannessen (Natural History Museum of Olso, Norway); Javier Quesada (Natural Science Museum of Barcelona, Barcelona, Spain), Sargis A. Aghayan (Laboratory of Zoology, Research Institute of Biology, Yerevan State University, Yerevan, Armenia). We wish to thank ISPRA (Dr. Lorenzo Serra), Regione Sardegna, Calabria and Abruzzo to give the permits to collect the biological samples. We also thank Andrea Romano for providing helpful comments. Finally, we thank for the field support Gianluca Congi, Gloria Ramello and Elisa Mancuso. This is publication number 1662 of the Biodiversity Research and Teaching Collections at Texas A&M University, publication number 12 of the W.I.N.E.S. collaborative research group and number 17 of the ZooDiversity Lab (University of Piemonte Orientale).
Disclosure statement
No potential conflict of interest was reported by the author(s).
Data availability statement
All specimen data are accessible on GenBank (Accession numbers OD991865-OD992005).
Supplementary material
Supplemental data for this article can be accessed online at https://doi.org/10.1080/24750263.2022.2099989.
References
- Albrecht F, Hering J, Fuchs E, Illera JC, Ihlow F, Shannon TJ, Collinson JM, Wink M, Martens J, Päckert M. 2020. Phylogeny of the Eurasian wren Nannus troglodytes (Aves: Passeriformes: Troglodytidae) reveals deep and complex diversification patterns of Ibero-Maghrebian and Cyrenaican populations. PLoS One 15:1–27. DOI: 10.1371/journal.pone.0230151.
- BirdLife International. 2021. European red list of birds. Luxembourg: Publications Office of the European Union.
- BirdLife International & Handbook of the Birds of the World. 2020. Bird species distribution maps of the world. Available: http://datazone.birdlife.org/species/requestdis.
- Bosworth W, Huchon P, McClay K. 2005. The Red Sea and Gulf of Aden Basins. Journal of African Earth Science 43:334–378.
- Brichetti P, Fracasso G. 2007. Ornitologia Italiana vol. 4 Apodidae-Prunellidae. Bologna, Italy: Oasi Alberto Perdisa.
- Brichetti P, and Grattini N. 2017. Distribuzione e consistenza delle popolazioni di Averla capirossa Lanius senator nidificanti in Italia settentrionale nel periodo 1980-2016. Alula XXIV 29–40.
- Brito PH. 2005. The influence of Pleistocene glacial refugia on tawny owl genetic diversity and phylogeography in Western Europe. Molecular Ecology 14:3077–3094. DOI: 10.1111/j.1365-294X.2005.02663.x.
- Calderón L, Campagna L, Wilke T, Lormee H, Eraud C, Dunn JC, Rocha G, Zehtindjiev P, Bakaloudis DE, Metzger B, Cecere JG, Marx M, Quillfeldt P. 2016. Genomic evidence of demographic fluctuations and lack of genetic structure across flyways in a long distance migrant, the European turtle dove. BMC Evolutionary Biology 16:1–11. DOI: 10.1186/s12862-016-0817-7.
- Clements JF, Schulenberg TS, Iliff MJ, Billerman SM, Fredericks TA, Gerbracht JA, Lepage D, Sullivan BL, Wood CL. 2021. The eBird/clements checklist of birds of the world: v2021.
- Cramp S, Perrins CM. 1993. Handbook of the birds of Europe, the Middle East and North Africa, vol. VII, flycatchers to shrikes. Oxford, UK: Oxford University Press.
- Degnan JH, Rosenberg NA. 2009. Gene tree discordance, phylogenetic inference and the multispecies coalescent. Trends in Ecology & Evolution 24:332–340. DOI: 10.1016/j.tree.2009.01.009.
- del Hoyo J, Elliott A, Christie D, editors. 2008. Handbook of the birds of the world, Vol. 13, Penduline-tits to shrikes. Barcelona: Lynx Edicions.
- Del Hoyo J, Collar N. 2016. HBW and BirdLife international illustrated checklist of the birds of the world. Volume 2: Passerines. Barcelona: Lynx Edicions.
- deMenocal PB. 2004. African climate change and faunal evolution during the Pliocene-Pleistocene. Earth and Planetary Science Letters 220:3–24. DOI: 10.1016/S0012-821X(04)00003-2.
- Demongin L. 2016. Identification guide to birds in the hand. Cambridge: Cambridge University Press.
- Dickinson E, Christidis L, eds. 2014. The Howard and Moore complete checklist of the birds of the world. 4th ed., Vol. 2 Passerines. London: Aves Press.
- Drovetski SV, Fadeev IV, Raković M, Lopes RJ, Boano G, Pavia M, Koblik EA, Lohman YV, Red’kin YA, Aghayan SA, Reis S, Drovetskaya SS, and Voelker G. 2018a. A test of the European Pleistocene refugial paradigm, using a Western Palaearctic endemic bird species. Proceedings of the Royal Society B 285(1889): 20181606.
- Drovetski SV, Reeves AB, Red’kin YA, Fadeev IV, Koblik EA, Sotnikov VN, Voelker G. 2018b. Multi-locus reassessment of a striking discord between mtDNA gene trees and taxonomy across two congeneric species complexes. Molecular Phylogenetics and Evolution 120:43–52. DOI: 10.1016/j.ympev.2017.11.023.
- Drummond AJ, Suchard MA, Xie D, Rambaut A. 2012. Bayesian phylogenetics with BEAUti and the BEAST 1.7. Molecular Biology and Evolution 29:1969–1973. DOI: 10.1093/molbev/mss075.
- Excoffier L, Lischer HEL. 2010. Arlequin suite ver 3.5: A new series of programs to perform population genetics analyses under Linux and Windows. Molecular Ecology Resources 10:564–567. DOI: 10.1111/j.1755-0998.2010.02847.x.
- Fahey AL, Ricklefs RE, Latta SC, DeWoody JA. 2012. Comparative historical demography of migratory and nonmigratory birds from the Caribbean Island of Hispaniola. Evolutionary Biology 39:400–414. DOI: 10.1007/s11692-012-9164-9.
- Fuchs J, Crowe TM, Bowie RCK. 2011. Phylogeography of the fiscal shrike (Lanius collaris): A novel pattern of genetic structure across the arid zones and savannas of Africa. Journal of Biogeography 38:2210–2222. DOI: 10.1111/j.1365-2699.2011.02545.x.
- Fuchs J, Alstrom P, Yosef Y, Olsson U. 2019. Miocene diversification of an open‐habitat predatorial passerine radiation, the shrikes (Aves: Passeriformes: Laniidae). Zoologica Scripta 48:571–588. DOI: 10.1111/zsc.12363.
- Galimberti A, Assandri G, Maggioni D, Ramazzotti F, Baroni D, Bazzi G, Chiandetti I, Corso A, Ferri V, Galuppi M, Ilahiane L, La Porta G, Laddaga L, Landi F, Mastropasqua F, Ramellini S, Santinelli R, Soldato G, Surdo S, Casiraghi M. 2021. Italian odonates in the Pandora’s box: A comprehensive DNA barcoding inventory shows taxonomic warnings at the Holarctic scale. Molecular Ecology Resources 21:183–200. DOI: 10.1111/1755-0998.13235.
- Gill F, Donsker D, Rasmussen P, editors. 2021. IOC world bird list (v11.2).
- Gonzalez J, Wink M, Garcia-del-Rey E, Delgado Castro G. 2008. Evidence from DNA nucleotide sequences and ISSR profiles indicates paraphyly in subspecies of the Southern Grey Shrike (Lanius meridionalis). Journal of Ornithology 149:495–506. DOI: 10.1007/s10336-008-0293-y.
- Grill A, Casula P, Lecis R, Menken S. 2007. Endemism in Sardinia. In: Weiss S, Ferrand N, editors. Phylogeography of Southern European Refugia: Evolutionary perspectives on the origins and conservation of European biodiversity. Netherlands, Dordrecht: Springer. pp. 273–296.
- Guillaumet A, Crochet PA, Pons JM. 2008. Climate-driven diversification in two widespread Galerida larks. BMC Evolutionary Biology 8:1–22. DOI: 10.1186/1471-2148-8-32.
- Hall T. 1999. BioEdit: A user-friendly biological sequence alignment editor and analysis program for Windows 95/98/NT. Nucleic Acids Symposium Series 41:95–98.
- Harris RB, Alström P, Ödeen A, Leaché AD. 2018. Discordance between genomic divergence and phenotypic variation in a rapidly evolving avian genus (Motacilla). Molecular Phylogenetics and Evolution 120:183–195. DOI: 10.1016/j.ympev.2017.11.020.
- Huntley JW, Keith KD, Castellanos AA, Musher LJ, Voelker G. 2019. Underestimated and cryptic diversification patterns across Afro-tropical lowland forests. Journal of Biogeography 46:381–391. DOI: 10.1111/jbi.13505.
- Ilahiane L, Boano G, Pavia M, Pellegrino I, Grussu M, Voelker G, Galimberti A. 2021. Completing the genetic puzzle of the reed warbler complex: Insights from Italy. Bird Study 67:440–447. DOI: 10.1080/00063657.2021.1927980.
- Katoh K, Standley D. 2013. MAFFT multiple sequence alignment software version 7: Improvements in performance and usability. Molecular Biology and Evolution 30:772–780. DOI: 10.1093/molbev/mst010.
- Klassert TE, Hernández MÁ, Campos F, Infante O, Almeida T. 2008. Mitochondrial DNA points to Lanius meridionalis as a polyphyletic species. Molecular Phylogenetics and Evolution 47:1227–1231. DOI: 10.1016/j.ympev.2008.03.012.
- Korrida A, Schweizer M. 2013. Diversification across the Palaearctic desert belt throughout the Pleistocene: Phylogeographic history of the Houbara-Macqueen’s bustard complex (Otididae: Chlamydotis) as revealed by mitochondrial DNA. Journal of Zoological Systematics and Evolutionary Research 52:65–74. DOI: 10.1111/jzs.12036.
- Kumar S, Stecher G, Li M, Knyaz C, Tamura K. 2018. MEGA X: Molecular evolutionary genetics analysis across computing platforms. Molecular Biology and Evolution 35:1547–1549. DOI: 10.1093/molbev/msy096.
- Kvist L, Giralt D, Valera F, Hoi H, Kristin A, Darchiashvili G, Lovaszi P. 2011. Population decline is accompanied by loss of genetic diversity in the Lesser Grey Shrike Lanius minor. Ibis 153:98–109. DOI: 10.1111/j.1474-919X.2010.01091.x.
- Lanfear R, Frandsen PB, A.m W, Senfeld T, Calcott B. 2017. PartitionFinder 2: New methods for selecting partitioned models of evolution for molecular and morphological phylogenetic analyses. Molecular Biology and Evolution 34:772–773. DOI: 10.1093/molbev/msw260.
- Larget B, Kotha S, Dewey C, Ané C. 2010. BUCKy: Gene tree/species tree reconciliation with Bayesian concordance analysis. Bioinformatics 26:2910–2911. DOI: 10.1093/bioinformatics/btq539.
- Larkin MA, Blackshields G, Brown NP, Chenna R, Mcgettigan PA, McWilliam H, Valentin F, Wallace IM, Wilm A, Lopez R, Thompson JD, Gibson TJ, Higgins DG. 2007. Clustal W and Clustal X version 2.0. Bioinformatics 23:2947–2948. DOI: 10.1093/bioinformatics/btm404.
- Leigh J, Bryant D. 2015. PopART: Full-feature software for haplotype network construction. Methods in Ecology and Evolution 6:1110–1116. DOI: 10.1111/2041-210X.12410.
- Lerner HRL, Meyer M, James HF, Hofreiter M, Fleischer RC. 2011. Multilocus resolution of phylogeny and timescale in the extant adaptive radiation of Hawaiian honeycreepers. Current Biology 21:1838–1844. DOI: 10.1016/j.cub.2011.09.039.
- Li X, Dong F, Lei F, Alström P, Zhang R, Ödeen A, Fjeldså J, Ericson PGP, Zou F, and Yang X. 2016. Shaped by uneven Pleistocene climate: Mitochondrial phylogeographic pattern and population history of white wagtail Motacilla alba (Aves: Passeriformes). Journal of Avian Biology 47:263–274. DOI: 10.1111/jav.00826.
- Librado P, Rozas J. 2009. DnaSP v5: A software for comprehensive analysis of DNA polymorphism data. Bioinformatics 25:1451–1452. DOI: 10.1093/bioinformatics/btp187.
- Lohman DJ, Ingram KK, Prawiradilaga DM, Winker K, Sheldon FH, Moyle RG, Ng PKL, Ong PS, Wang LK, Braile TM, Astuti D, Meier R. 2010. Cryptic genetic diversity in “widespread” Southeast Asian bird species suggests that Philippine avian endemism is gravely underestimated. Biological Conservation 143:1885–1890. DOI: 10.1016/j.biocon.2010.04.042.
- Nespoli D, Pellegrino I, Galaverni M, Caniglia R, Sunyer J, Mengoni C, Randi E, Galimberti A, Rubolini D, Spina F, Gargallo G, Brambilla M. 2021. Disentangling the taxonomic status and phylogeographic structure of Marmora’s (Curruca sarda) and Balearic Warbler (Curruca balearica): A genetic multi-marker approach. Journal of Ornithology 162:909–918. DOI: 10.1007/s10336-021-01885-x.
- Olsson U, Alström P, Svensson L, Aliabadian M, Sundberg P. 2010. The Lanius excubitor (Aves, Passeriformes) conundrum—Taxonomic dilemma when molecular and non-molecular data tell different stories. Molecular Phylogenetics and Evolution 55:347–357. DOI: 10.1016/j.ympev.2009.11.010.
- Olsson U, Irestedt M, Sangster G, Ericson PGP, Alström P. 2013. Molecular phylogenetics and evolution systematic revision of the avian family Cisticolidae based on a multi-locus phylogeny of all genera. Molecular Phylogenetics and Evolution 66:790–799. DOI: 10.1016/j.ympev.2012.11.004.
- Ottenburghs J, Lavretsky P, Peters JL, Kawakami T, and Kraus RHS. 2019. Population genomics and phylogeography. In: Kraus R, editor. Avian genomics in ecology and evolution. Cham: Springer. pp. 237–265.
- Padilla DP, Spurgin LG, Fairfield EA, Illera JC, Richardson DS. 2015. Population history, gene flow, and bottlenecks in island populations of a secondary seed disperser, the southern grey shrike (Lanius meridionalis koenigi). Ecology and Evolution 5:36–45. DOI: 10.1002/ece3.1334.
- Pârâu L, Frias-Soler R, Wink M. 2019. High genetic diversity among breeding Red-Backed Shrikes Lanius collurio in the Western Palearctic. Diversity 11:31. DOI: 10.3390/d11030031.
- Pârâu LG, Wink M. 2021. Common patterns in the molecular phylogeography of western palearctic birds: A comprehensive review. Journal of Ornithol. DOI: 10.1007/s10336-021-01893-x.
- Pavia M, Drovetski SV, Boano G, Conway KW, Pellegrino I, Voelker G. 2021. Elevation of two subspecies of Dunnock Prunella modularis to species rank. Bulletin of the British Ornithologists’ Club 141:199–210. DOI: 10.25226/bboc.v141i2.2021.a10.
- Peer BD, McIntosh CE, Kuehn MJ, Rothstein SI, Fleischer RC. 2011. Complex biogeographic history of Lanius shrikes and its implications for the evolution of defenses against avian brood parasitism. The Condor 113:385–394. DOI: 10.1525/cond.2011.100066.
- Pellegrino I, Negri A, Boano G, Cucco M, Kristensen TN, Pertoldi C, Randi E, Šálek M, Mucci N. 2015. Evidence for strong genetic structure in European populations of the little owl Athene noctua. Journal of Avian Biology 46:462–475. DOI: 10.1111/jav.00679.
- Pellegrino I, Cucco M, Harvey JA, Liberatore F, Pavia M, Voelker G, Boano G. 2017. So similar and yet so different: Taxonomic status of Pallid Swift Apus pallidus and Common Swift Apus apus. Bird Study 64. DOI: 10.1080/00063657.2017.1359235.
- Perktaş U, Gür H, Ada E. 2015. Historical demography of the Eurasian green woodpecker: Integrating phylogeography and ecological niche modelling to test glacial refugia hypothesis. Folia Zoologica 64:284–295. DOI: 10.25225/fozo.v64.i3.a9.2015.
- Pertoldi C, Pellegrino I, Cucco M, Mucci N, Randi E, Terp Laursen J, Sunde P, Loeschcke V, Kristensen TN. 2012. Genetic consequences of population decline in the Danish population of the little owl (Athene noctua). Evolutionary Ecological Research 14:921–932.
- Pons J-M, Thibault J-C, Aymí R, Grussu M, Muntaner J, Olioso G, Sunyer JR, Touihri M, and Fuchs J. 2016. The role of western Mediterranean islands in the evolutionary diversification of the spotted flycatcher Muscicapa striata, a long-distance migratory passerine species. Journal of Avian Biology 47:386–398. DOI: 10.1111/jav.00859.
- Pons JM, Cibois A, Fournier J, Fuchs J, Olioso G, Thibault JC. 2019. Gene flow and genetic divergence among mainland and insular populations across the south-western range of the Eurasian treecreeper (Certhia familiaris, Aves). Biological Journal of the Linnean Society 126:447–461. DOI: 10.1093/biolinnean/bly200.
- Pook CE, Joger U, Stümpel N, Wüster W. 2009. When continents collide: Phylogeny, historical biogeography and systematics of the medically important viper genus Echis (Squamata: Serpentes: Viperidae). Molecular Phylogenetics and Evolution 53:792–807. DOI: 10.1016/j.ympev.2009.08.002.
- Portik DM, Papenfuss TJ. 2015. Historical biogeography resolves the origins of endemic Arabian toad lineages (Anura: Bufonidae): Evidence for ancient vicariance and dispersal events with the Horn of Africa and South Asia. BMC Evolutionary Biology 15:1–19. DOI: 10.1186/s12862-015-0417-y.
- Posada D. 2008. jModelTest: Phylogenetic model averaging. Molecular Biology and Evolution (25):1253–1256. DOI: 10.1093/molbev/msn083.
- Rambaut A. 2008. FigTree: Tree figure drawing tool version 1.3. 1 2006–2009. Institution of Evolutionary Biological University Edinburgh. Available: http//tree.bio.ed.ac.uk.
- Rambaut A, Drummond A, Xie D, Baele G, Suchard M. 2018. Posterior summarisation in Bayesian phylogenetics using Tracer 1.7. System Biology. 67:901–904.
- Ratnasingham, S, and Hebert, PD. 2007. BOLD: The Barcode of Life Data System (http://www.Barcodinglife.org). Molecular Ecology Notes 7:355–364. DOI:10.1111/j.1471-8286.2007.01678.x.
- Ronquist FM, Teslenko P, van der Mark DL, Ayres A, Darling S, Höhna B, Larget LL, Suchard MA, Huelsenbeck JP. 2012. MRBAYES 3.2: Efficient Bayesian phylogenetic inference and model selection across a large model space. Systematic Biology 61:539–542. DOI: 10.1093/sysbio/sys029.
- Roselaar CS. 1995. Songbirds of Turkey. An atlas of biodiversity of Turkish passerine birds. Haarlem, NL: Pica Press.
- Ruddiman WF, Raymo ME, Martinson DG, Clement BM, Backman J. 1989. Stable isotope record, calcium carbonate concentrations, and sea surface temperature reconstructions of sediment cores from the North Atlantic. PANGAEA. DOI: 10.1594/PANGAEA.701229.
- Ryder OA. 1986. Species conservation and systematics: The dilemma of subspecies. Trends in Ecology & Evolution 1:9–10. DOI: 10.1016/0169-5347(86)90059-5.
- Saitou N, Nei M. 1987. The neighbor-joining method: A new method for reconstructing phylogenetic trees. Molecular Biology and Evolution 4:406–425. DOI: 10.1093/oxfordjournals.molbev.a040454.
- Schweizer M, Shirihai H, Schmaljohann H, Kirwan GM. 2017. Phylogeography of the house bunting complex: Discordance between species limits and genetic markers. Journal of Ornithology 159:47–61. DOI: 10.1007/s10336-017-1501-4.
- Semenov GA, Scordato ESC, Khaydarov DR, Smith CCR, Kane NC, Safran RJ. 2017. Effects of assortative mate choice on the genomic and morphological structure of a hybrid zone between two bird subspecies. Molecular Ecology 26(26):6430–6444. DOI: 10.1111/mec.14376.
- Seutin G, White BN, Boag PT. 1991. Preservation of avian blood and tissue samples for DNA analysis. Canadian Journal of Zoology 69:82–90. DOI: 10.1139/z91-013.
- Shi JJ, Rabosky DL. 2015. Speciation dynamics during the global radiation of extant bats. Evolution 69:1528–1545. DOI: 10.1111/evo.12681.
- Shirihai H. 1996. The birds of Israel. London, UK: Academic Press.
- Shirihai H, Svensson L. 2018. Handbook of Western Palearctic birds. London, UK: Helm, Bloomsbury.
- Slabbekoorn H, and Smith TB. 2002. Bird song, ecology and speciation. Philosophical Transactions of the Royal Society of London. Series B: Biological Sciences 357:493–503. DOI:10.1098/rstb.2001.1056.
- Small BJ, Walbridge G. 2005. From the Rarities Committee’s files: A review of the identification of ‘Balearic’ Woodchat Shrike, and details of three British records. BR Birds 98:34–42.
- Stephens, M, Smith, NJ, and Donnelly, P. 2001. A new statistical method for haplotype reconstruction from population data. American Journal of Human Genetics 68:978–989. DOI:10.1086/319501.
- Suchard MA, Lemey P, Baele G, Ayres DL, Drummond AJ, Rambaut A. 2018. Bayesian phylogenetic and phylodynamic data integration using BEAST 1.10. Virus Evolution 4:1–5. DOI: 10.1093/ve/vey016.
- Svensson L. 1992. Identification guide to European Passerines. Stockholm: British Trust for Ornithology.
- Toews DPL, Brelsford A. 2012. The biogeography of mitochondrial and nuclear discordance in animals. Molecular Ecology 21:3907–3930. DOI: 10.1111/j.1365-294X.2012.05664.x.
- Villesen P. 2007. FaBox: An online toolbox for fasta sequences. Molecular Ecology Notes 7:965–968. DOI: 10.1111/j.1471-8286.2007.01821.x.
- Voelker G, Huntley JW, Peñalba JV, and Bowie RCK. 2016. Resolving taxonomic uncertainty and historical biogeographic patterns in Muscicapa flycatchers and their allies. Molecular Phylogenetics and Evolution 94:618–625. DOI: 10.1016/j.ympev.2015.09.026.
- Ward RD. 2009. DNA barcode divergence among species and genera of birds and fishes. Molecular Ecology Resources 9:1077–1085. DOI: 10.1111/j.1755-0998.2009.02541.x.
- White CM, Sonsthagen SA, Sage GK, Anderson C, Talbot SL. 2013. Genetic relationships among some subspecies of the Peregrine Falcon (Falco peregrinus L.), inferred from mitochondrial DNA control-region sequences. The Auk 130:78–87. DOI: 10.1525/auk.2012.11173.
- Wojczulanis-Jakubas K, Kilikowska A, A. Harding AM, Jakubas D, Karnovsky NJ, Steen H, Strøm H, Welcker J, Gavrilo M, Lifjeld JT, Johnsen A. 2014. Weak population genetic differentiation in the most numerous Arctic seabird, the little auk. Polar Biology 37:621–630. DOI: 10.1007/s00300-014-1462-5.
- Zhang W, Lei FM, Liang G, Yin ZH, Zhao HF, Wang HJ, Krištín A. 2007. Taxonomic status of eight Asian shrike species (Lanius): Phylogenetic analysis based on Cty b and CoI gene sequences. Acta Ornithologica 42:173–180. DOI: 10.3161/068.042.0212.
- Zuccon D, Pons J, Boano G, Chiozzi G, Gamauf A, Mengoni C, Nespoli D, Olioso G, Pavia M, Pellegrino I, Raković M, Randi E, Rguibi Idrissi H, Touihri M, Unsöld M, Vitulano S, Brambilla M. 2020. Type specimens matter: New insights on the systematics, taxonomy and nomenclature of the subalpine warbler (Sylvia cantillans) complex. Zoological Journal of the Linnean Society 169:1–28.