
Abstract
Seasonal food availability for benthic feeders in Antarctica can influence the level of excreted metabolites, which may then be a source of N and P for autotrophs. In this study, we examined the effects of starvation of Waldeckia obesa and Glyptonotus antarcticus on the excretion of both N and P, and the chemical composition of their bodies. N-NH4+ dominated in the pool of excreted nitrogen (93% and 77% of inorganic nitrogen, and 76% and 67% of total nitrogen, for W. obesa and G. antarcticus, respectively). Reactive phosphorus dominated in the pool of excreted phosphorus (72% and 65% of total phosphorus for G. antarcticus and W. obesa, respectively). The excretion of N-NH4+ (in µmol N h−1 100 g−1) dropped from 3,687 (W. obesa) and 1,336 (G. antarcticus) in the first day to about 0.6 after 10 days of starvation (for both species). Phosphorus excretion was generally lower than that of nitrogen (on average 0.046 and 0.017 µmol P h−1 100 g−1 for G. antarcticus and W. obesa, respectively), but no clear trend appeared with N as a result of starvation. The greatest decrease in nitrogen and protein content in W. obesa was recorded on the 3rd day of starvation (nitrogen: from 1.30% to 0.93%; protein: 8.15% to 5.80%) and in G. antarcticus on the 5th day of starvation (nitrogen: from 2.22% to 1.43%; protein: from 13.86% to 8.94%). Conclusions: (i) nitrogen and phosphorus compounds released by crustaceans may be a supplementary source of biogenic salts for autotrophs, (ii) nitrates constituting approx. 20% nitrogen may be used by phytoplankton in the period of new production, (iii) starvation reduces the excretion of N and P and the content of nitrogen and protein in crustaceans.
1. Introduction
Global climate change is affecting the Antarctic Peninsula ecosystem, where warming in the second half of the twentieth century was greater than in other regions of Antarctica. Clear consequences of this have been observed in the terrestrial ecosystem, such as a growth in ice-free areas, expansion of native plants and invasions of alien species (Znój et al. Citation2017; Galera et al. Citation2018; Convey & Peck Citation2019; Chwedorzewska et al. Citation2020). Changes are occurring in the marine ecosystem: e.g. increases in temperature and acidification of the waters, changes in ice conditions, increases in the flow of meltwater, forced animal migrations in search of safe suitable habitats and food, and colonization of new areas (Henley et al. Citation2019; Potocka et al. Citation2019). Forced migrations can extend regular periods of restricted access to food, especially for benthic organisms, with food from the Australian pelagic zone reaching them mainly in the short summer (Clarke Citation1983; Obermüller et al. Citation2010). Of great significance are changes in the food web, where the key species of Antarctic krill (Euphausia sp.) depends to a great degree on the phytoplankton biomass (Atkinson et al. Citation2019) that relies directly on the stability of the water and light column and on the availability of biogenic elements. These inter-relationships are still poorly understood (Saba et al. Citation2014). In addition, the environmental and oceanographic changes taking place also generate further changes in primary production patterns (Pinkerton et al. Citation2021).
Despite the fact that the waters of the Southern Ocean are considered rich in biogenic salts (e.g. Nędzarek Citation2008; Polukhin et al. Citation2021), it should be borne in mind that changes in environmental conditions may in the future also result in a change of factors limiting primary production (Pinkerton et al. Citation2021). For example, Elser et al. (Citation2007) indicate that reduced nitrogen availability may limit the photosynthesis of algae in many aquatic ecosystems.
One source of biogenic elements is the excretion of nitrogen and phosphorus compounds by aquatic organisms (Elser et al. Citation2007; Nędzarek Citation2008; Vanni et al. Citation2017; Stepanowska & Nędzarek Citation2020). Various studies have shown that aquatic invertebrates can significantly affect the abundance of N and P in the ecosystem through such excretion. Some researchers postulate that closely related species or species fulfilling similar functional roles in the ecosystem show similarities in their contribution to the process of supplying the environment with nitrogen and phosphorus, with others suggesting significant differences in this contribution (Alves et al. Citation2010; Vanni et al. Citation2017; Balik et al. Citation2018).
In the Antarctic ecosystem, high variability in trophic conditions is an important factor shaping the metabolism of organisms (Obermüller et al. Citation2010). The seasonality of food access means that many organisms (including benthic necrophages), especially during winter, must endure long periods of starvation (Clarke Citation1983, Citation1988). They are adapted to food deprivation and their tolerance increases with age – for example, krill larvae can survive from a few days to a few weeks without food while adults for more than 200 days (Siegel Citation2016). Starvation is associated with changes in body chemistry, such as a reduction in lipid or protein content (Chapelle et al. Citation1994; Comoglio et al. Citation2005; Watts et al. Citation2014; Stepanowska & Nędzarek Citation2020). To our knowledge, the effect of starvation of Antarctic benthic crustaceans on the magnitude of excreted metabolites which may provide a source of N and P for autotrophs has not been well described.
Researchers usually examine the excretion of ammonium nitrogen and phosphates, as these are forms easily assimilated by first-order producers (e.g. Alcaraz et al. Citation2010; Comoglio et al. Citation2005; Ikeda Citation2013; Balik et al. Citation2018). The possibility of enriching the ecosystem with oxidized forms of inorganic nitrogen (nitrates and nitrites) is often neglected. Although the uptake of nitrates, rather than the reduced form, by autotrophs is less energy efficient, the oxidized form may constitute an important part of the nitrogen nutrition of microplankton in the case of ammonium deficiency/utilization (Priddle et al. Citation1995; Whitehouse et al. Citation1999). Therefore, when the concentration of ammoniacal nitrogen is reduced to a lower effective level, the availability of nitrates may positively affect primary production, a growing trend in many areas of the Southern Ocean (Pinkerton et al. Citation2021).
The aim of this research (simulating environmental conditions with low levels of trophic resources) was (i) to assess the capabilities of two scavenger species of benthic invertebrates: amphipod Waldeckia obesa and isopod Glyptonotus antarcticus to supply the Antarctic ecosystem with excretions of nitrogen (including oxidized forms of inorganic nitrogen) and phosphorus, (ii) evaluation of the impact of long-term starvation on this process, (ii) assessing the change in body chemical composition of these crustaceans.
2. Material and methods
2.1. Study area
The research was carried out at the H. Arctowski Polish Antarctic Station (), located on the west coast of Admiralty Bay, the largest bay of King George Island (West Antarctica). The shoreline of the bay is about 83.4 km, the area is about 122.08 km2, and the water volume is estimated at 24.24 km3. The water depth varies from shallow water to 530 m deep, with an average depth of ca. 200 m (Rakusa-Suszczewski Citation1995). The drainage basin of Admiralty Bay covers an area of ca. 361 km2. To the south, the bay is open to the influence of sea currents from the Bransfield Strait (Sailing directions for Antarctica Citation1985; Battke Citation1990).
Figure 1. Location of Admiralty Bay (AB) and Polish Antarctic Station “Arctowski” (AS).
2.2. Crustacea
The Southern Ocean has a high abundance of benthic species. The shallow sublittoral zone is particularly densely inhabited by macrozoobenthos (Jażdżewska & Siciński Citation2017). Researchers such as De Broyer et al. (Citation2004) also confirm a great number and diversity, and hence their importance, in the Antarctic bathyal and abyssal zones.
Two species of invertebrates were tested in this experiment: the amphipod Waldeckia obesa and isopod Glyptonotus antarcticus, both common in the marine benthic environment of Antarctica from the littoral to abyssal zones. Both species are necrophages and predators and exhibit cannibalistic behavior. The composition of their diet is determined more by the availability of the food than by its type. Both species are adapted to long periods of starvation throughout the year (Dearborn Citation1967; Jażdżewski et al. Citation1982; Presler Citation1986; De Broyer et al. Citation2004; Janecki and Rakusa-Suszczewski Citation2005, Citation2006; Jażdżewska & Siciński Citation2017).
2.3. Starvation
The amphipod (W. obesa) and isopod (G. antarcticus) in this study were caught from Admiralty Bay using a grab dredge. Individuals with similar body weight were selected for experimental studies. The mean weight of the W. obesa was 0.38 ± 0.05 g, and the G. antarcticus 23 ± 5 g.
The experiment was carried out in open tanks. A constant ratio of sea water to crustacean biomass was used, at 10 dm3 of water for every 100 ± 5 g of crustacean weight. The sea water was taken from Admiralty Bay and had an average salinity of 34.6 ± 0.4 PSU, pH 8.2 ± 0.1 and oxygenation of 98–100%. The average concentrations of the determined forms of nitrogen and phosphorus (as in point 2.4.) were as follows: 0.009 ± 0.005 mg N-NO2− dm−3, 0.362 ± 0.058 mg N-NO3− dm−3, 0.021 ± 0.007 mg N-NH4+ dm−3, 0.580 ± 0.041 mg N dm3 for total nitrogen (TN), and 0.080 ± 0.015 mg P dm−3 and 0.087 ± 0.014 mg P dm−3 for total reactive phosphorus (TRP) and total phosphorus (TP), respectively. These values were determined in fresh sea water each time before the water changes in the tanks and were taken into account in the calculated values of nitrogen and phosphorus excretion by the crustaceans.
The water in the tanks was constantly aerated, and the temperature was kept at 0 ± 0.5°C (isothermal laboratory with an air temperature of 0 ± 0.5°C and a day/night lighting cycle of 6 h/18 h).
In the unfed crustaceans, the tank water was replaced with fresh water after 1, 2, 3, 4, 5, 10, 15, 25, 35, 45 days, and for W. obesa additionally after 55 and 65 days. Each 24 hours after the water change, the concentrations of individual forms of nitrogen and phosphorus were determined, and their excretion calculated in µmol N or P h−1 100 g−1 of crustacean weight.
2.4. Water quality tests
The concentrations of N-NO2−, N-NO3−, N-NH4+, total nitrogen (TN), total reactive phosphorus (TRP) and total phosphorus (TP) in the seawater, were determined using standard colorimetric techniques recommended by Standard Methods (APHA Citation1999). The absorbance measurements were performed using a CARL ZEISS UV-VIS SPECOL-1100 spectro-photometer. Total organic nitrogen (TON) was calculated according to the formula TON = TN - TIN, where TIN is the sum of N-NO2−, N-NO3− and N-NH4+. Total organic phosphorus (TOP) was calculated according to the formula TOP = TP - TRP. The pH of the water was also measured using a HI 9025 pH meter from HANNA Instruments (USA), the salinity with a FL197 conductometer from WTW GmbH (Germany), and the oxygenation of the water with an Oxi 197 oxygen meter from WTW GmbH (Germany).
Table I. Ranges of nitrogen and phosphorus excretion (in µmol N or P h−1 100 g−1) during experimental starvation G. antarcticus (GA) and W. obesa (WO); the shares (in %) of ammoniacal nitrogen in total nitrogen (TN) and in total inorganic nitrogen (TIN) and total reacting phosphorus (TRP) in total phosphorus (TP) and the Redfield ratio (TIN: TRP) and summary of one-way ANOVA results (F and P); (TON - total organic nitrogen; TOP - total organic phosphorus).
2.5. Analysis of body chemical composition
Before starting each experiment, and also after 1, 2, 3, 4, 5 and 65 days for W. obesa and after 1, 3, 5 and 50 days for G. antarcticus, we analyzed the chemical composition of the crustaceans, i.e. the percentage content of:
nitrogen and total protein – by Kjeldahl method (PN-A-04018: Az3: 2002),
dry mass – by drying samples at 105°C for 12 hours (PN-A-86783: 1962),
ash – by roasting samples at 550°C for 10 hours (PN-EN ISO 936: 2000).
2.6. Statistical analysis
The data obtained were subjected to statistical analysis involving 1-way analysis of variance (ANOVA) and Tukey HSD. The minimum significance level was set at 0.05. The analysis was performed using STATISTICA (ver. 13.3) for Windows (TIBCO Software Inc.).
3. Results
3.1. Excretion of nitrogen
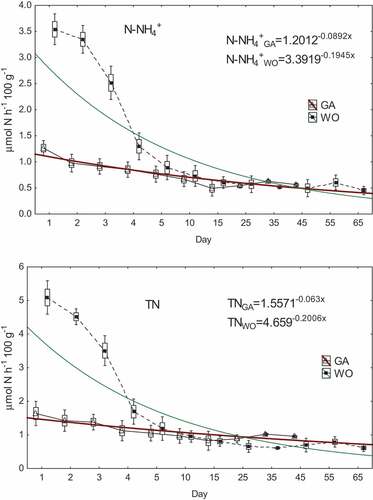
The tested W. obesa excreted significantly (P < 0.05) more nitrogen than G. antarcticus (). For example, the mean TN excretions calculated for the entire starvation period in µmol N h−1 100 g−1, were 1.760 for W. obesa and 1.127 for G. antarcticus. Generally, ammoniacal nitrogen dominated in the nitrogen pool and on average it accounted for 76% and 67% of TN, respectively, for W. obesa and G. antarcticus. At the same time, W. obesa, compared to G. antarcticus, excreted more (P < 0.05) ammoniacal nitrogen (1.5x), inorganic nitrogen (1.4x) and organic nitrogen (2.8x). In contrast, significantly higher (P < 0.05) values of nitrites (approx. 4.6x) and nitrates (approx. 2.9x) were recorded for G. antarcticus than for W. obesa (). However, these were low values and, in total, did not exceed 30% TN for G. antarcticus or 15% TN for W. obesa (Appendix 1).
Starvation was associated with a tendency for a decrease in excreted N-NH4+, TON, TIN and TN, from maximum values in the first day down to a relatively constant level after about 10–15 days of starvation (; Appendix 2). For example (in µmol N h−1 100 g−1) for N-NH4+ from 3.687 to ca. 0.567 for W. obesa, and from 1.336 to ca. 0.579 for G. antarcticus (). During this time, excretions (in µmol N h−1 100 g−1) of TN, TIN and TON decreased to 0.732, 0.626 and 0.106 for W. obesa, and to 0.931, 0.808 and 0.125 for G. antarcticus (; Appendix 2). These trends can be described by exponential functions and the following formulas were determined for the excretion of TN by W. obesa and G. antarcticus: TNWO = 4.659−0.2006x and TNGA = 1.5571−0.063x ().
Figure 2. Variability of ammoniacal nitrogen (N-NH4+) and total nitrogen (TN) excretion during G. antarcticus (GA) and W. obesa (WO) starvation (triangle and black square - mean; rectangle - mean ± standard error whiskers - mean ± SD).
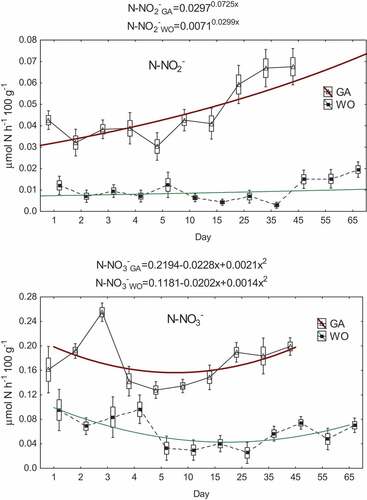
The oxidized forms of nitrogen did not show similar trends of changes to the other forms of nitrogen (). In the case of N-NO2 there was a generally weak tendency of the value increase with time (a particularly clear increase was noted after the 15th day of G. antarcticus starvation and the 35th day of W. obesa starvation). On the other hand, sine wave variability was demonstrated for N-NO3− with a minimum between 4 and 15 days of starvation for G. antarcticus and 5–25 days of starvation for W. obesa ().
Figure 3. Variability of the concentration of nitrite nitrogen (N-NO2−) and nitrate nitrogen (N-NO3−) in water per 100 g of weight of starved crustaceans per hour (GA - G. antarcticus; WO - W. obesa; triangle and black square - mean; rectangle - mean ± standard error; whiskers - mean ± SD).
3.2. Excretion of phosphorus
Overall, the excretion of phosphorus by the tested crustaceans was lower than that of nitrogen. For example, TP excretions averaged 0.046 µmol P h−1 100 g−1 for G. antarcticus and 0.017 µmol P h−1 100 g−1 for W. obesa (). At the same time, TRP was more prevalent than TOP and on average was 72% of TP (for G. antarcticus) and 65% of TP (for W. obesa). Phosphorus excretion was higher (P < 0.05) in G. antarcticus compared to W. obesa (average 2.9 times higher for TRP, 2.2 times higher for TOP and 2.7 times higher for TP – taking into account the mean values given in ). Nevertheless, the calculated Redfield ratio (TIN:TRP) was higher (P < 0.05) for W. obesa than for G. antarcticus (mean values 138 and 31, respectively) ().
After the first 2 days of starvation, G. antarcticus decreased in TP excretion (approx. 1.6x) from 0.062 to 0.067 µmol P h−1 100 g−1 to an average level of approx. 0.041 µmol P h−1 100 g−1 in the remaining days of the experiment (). At the same time, in these time intervals there was also an approximate 3x reduction in TOP excretion, from 0.023 to 0.036 µmol P h−1 100 g−1 to an average of 0.01 µmol P h−1 100 g−1 (Appendix 2). In the case of TRP, there was a slightly reduced excretion from an average level of 0.036 µmol P h−1 100 g−1 in the first two days to approx. 0.028 µmol P h−1 100 g−1 between 25 and 45 days ().
Figure 4. Variability of total reactive phosphorus (TRP) and total phosphorus (TP) excretion during G. antarcticus (GA) and W. obesa (WO) starvation (triangle and black square - mean; rectangle - mean ± standard error; whiskers - mean ± SD).
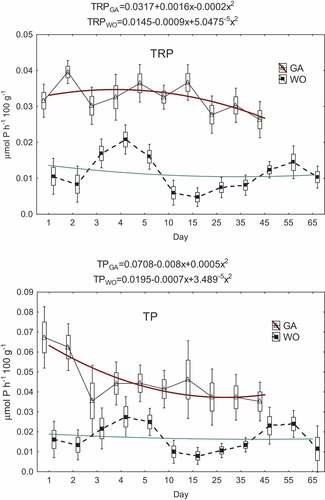
In W. obesa, the variability of phosphorus excretion was sinusoidal, with two maxima at 3–5 and 45–55 days of starvation; during this time the mean excretions (in µmol P h−1 100 g−1) of TP, TRP and TOP were respectively 0.024, 0.016 and 0.009 and were 1.8x, 2x and 1.5x higher than the minima (; Appendix 2).
The variation in phosphorus excretion can be described by a polynomial and, for example, the following formulas were determined for total phosphorus excretion by W. obesa and G. antarcticus: TPWO = 0.0143–0.0009 + 5.1134−5x2 and TPGA = 0.0708–0.008x+0.0005x2 ().
Table II. Changes in the chemical composition (in %) of W. obesa (WO) and G. antarcticus (GA) during starvation (x ± SD).
3.3. Effects of starvation on metabolism
Weeks of starvation had different effects on the content of dry matter, nitrogen, protein and ash in both W. obesa and G. antarcticus ().
The content of nitrogen and protein in both decreased in the first starvation period, reaching minimum values on the 3rd and 5th day, for W. obesa and G. antarcticus, respectively. After 65 days of starvation, the content of these indices in W. obesa was significantly higher (p < 0.01) compared to the first 5 days of starvation. In contrast, the nitrogen and protein content in G. antarcticus after 50 days of starvation was significantly higher (P < 0.01) than on the 5th day of starvation, but was still lower than before starvation ().
Dry matter content in W. obesa, after the period of initial stability, decreased highly statistically significantly (P < 0.01) on the 3rd day of starvation, and reached a minimum on the 4th day. Thereafter, an increase in dry matter content was recorded up to a maximum on day 65 of starvation. On the other hand, in G. antarcticus, dry matter content showed a clear decreasing trend from the 5th day of starvation, and then a highly significant (P < 0.01) increase in the value on the 50th day in relation to the minimum value ().
The ash content in both tested species gradually increased until the 5th day of starvation, and then decreased significantly (P < 0.01) in the last days of the experiment. Nevertheless, the ash content was significantly higher at that time than before starving the crustaceans ().
4. Discussion
4.1. Excretion of N and P
In general, the amounts of N and P excreted by the tested invertebrates were similar to previous studies, which also showed a high share of ammonium nitrogen in total nitrogen (e.g. Robertson et al. Citation2001; Obermüller et al. Citation2010). The reduced form of nitrogen also prevailed over the oxidized forms of nitrogen, as in the research on N and P excretion by Antarctic fish by Stepanowska and Nędzarek (Citation2020). At the same time, the maximum values of ammoniacal nitrogen recorded in the first 2 days of the experiment corresponded to the excretions observed in fed animals (e.g. Boyce Citation1999; Robertson et al. Citation2001; Obermüller et al. Citation2010).
According to Boyce (Citation1999), organic nitrogen, defined by the concentration of urea, constitutes 10–20% of total nitrogen excreted by Antarctic marine organisms. In our research, we also showed similar values - the share of TON in TN was on average 12.5% (for G. antarcticus) and 22% (for W. obesa).
The demonstrated differences in N and P excretion between the tested invertebrates are in line with the observations by Alves et al. (Citation2010) and Balik et al. (Citation2018). They showed that the excretion of N and P by various species, despite having similar functions in the ecosystem, can differ significantly due to differences in key functional characteristics, e.g. diet specialization, varying degrees of aggressiveness and cannibalism, metabolic rate, body size. More aggressive and cannibalistic species may consume more protein and, as a result, excrete more nitrogen. Smaller animals, due to their faster metabolism, should also generally have a higher nitrogen excretion rate. Balik et al. (Citation2018) also emphasize that consumer-driven nutrient recycling is a complex interaction of ecology and physiology. The complexity of these interactions is also confirmed by the differences in nutrient excretion demonstrated in our study: higher N excretion by W. obesa (1.6x for TN) compared to G. antarcticus, and, on the contrary, P excretion was higher in G. antarcticus (2.7x for TP) than in W. obesa. Similar differences between N and P excretions depending on the weight of invertebrates were shown by Balik et al. (Citation2018), arguing that organisms that are smaller but with a higher metabolism may have a higher requirement for P and thus excrete less P.
4.2. Effect of starvation on excretion
Numerous studies of the influence of starvation on the metabolism of marine organisms (e.g. Chapelle et al. Citation1994; Comoglio et al. Citation2005; Obermüller et al. Citation2010; Lehette et al. Citation2012; Stepanowska & Nędzarek Citation2020), and those carried out on benthic animals inhabiting the Antarctic sea (e.g. Robertson et al. Citation2001; Rakusa-Suszczewski et al. Citation2010; Janecki & Rakusa-Suszczewski Citation2004, Citation2005, Citation2006), have shown that their metabolism slows down over time, but that the pattern of metabolic response may be different. In the case of W. obesa, 10-day hunger reduces the metabolic rate by 36% and 30-day hunger by 66% compared to well-nourished individuals (Janecki & Rakusa-Suszczewski Citation2005). In contrast, the metabolism of G. antarcticus decreases by 30% after 14 days, and by 70% after 42 days of starvation (Janecki & Rakusa-Suszczewski Citation2006). This is accompanied by a decrease in N excretion, as was shown in this research for the example of ammoniacal nitrogen, TON and TN. Higher reduction of N excretion in W. obesa (<85%) than in G. antarcticus (<40%) can probably be explained by the higher metabolism of W. obesa (as postulated by, e.g. Balik et al. Citation2018) and higher resistance of G. antarcticus to food deficiency (Janecki & Rakusa-Suszczewski Citation2006).
In the case of phosphorus, the effect of starvation on the amount of its excretion was not as high as in the case of nitrogen. This observation is consistent with Obermüller et al. (Citation2010). They argue that due to the differentiation of energy reactions depending on the availability and/or type of food, the same general relationships cannot be drawn for N and P excretion.
A more pronounced effect of starvation on P excretion was demonstrated in G. antarcticus (especially for TP, whose excretion after 10 days decreased by approx. 40% and remained at that level for the next 35 days). Presumably, this could be the result of the excretion of undigested food during the first 2 days of starvation, analogous to what was observed in starving Antarctic fish (Stepanowska & Nędzarek Citation2020).
4.3. Potential importance of N and P excretion by crustaceans for autotrophs
Despite the fact that the waters of the Southern Ocean are generally rich in nutrients, high spatial variation in biomass and primary production is observed with the simultaneous seasonal succession of autotrophs and high dynamics of various forms of nitrogen available to them (Bode et al. Citation2002; Lehette et al. Citation2012). Contrary to nitrate nitrogen, the proportion of ammoniacal nitrogen dissolved in water in total nitrogen is relatively small, and according to Goeyens et al. (Citation1998) averages 1.3–1.7% with a maximum at 7.55%. Thus, the available ammonium nitrogen may be a potential limiting factor in phytoplankton production (Priddle et al. Citation1995; Goeyens et al. Citation1998; Whitehouse et al. Citation1999). This takes place during the new production period (spring/early summer) when phytoplankton use up nitrate nitrogen. As the biomass grows, the phytoplankton nutrition changes to ammonium nitrogen and dissolved organic nitrogen (period of regenerated production) (Bode et al. Citation2002).
Based on this general outline of the complicated and not fully understood process of using biogenic salts by autotrophs, it can be assumed that metabolites excreted by benthic organisms may contribute significant N and P loads to primary production. This is indirectly confirmed by Sturz et al. (Citation2003) who observed higher loads of biogenic salts in the bottom layer, the source of which, in addition to the microbial decomposition of sinking detritus, are metabolites excreted by animals staying near the bottom. Therefore, in view of the naturally low concentration of ammoniacal nitrogen in the Southern Ocean, even a small inflow of ammoniacal nitrogen excreted by benthic animals may result in the enrichment of the ecosystem with available nitrogen in autotrophs (Bode et al. Citation2002). In general, the inflow of oxidized nitrogen forms into the environment (in these studies they accounted for approx. 20% TN; Appendix 2) may be of less importance for autotrophs. In the period of new production (see Bode et al. Citation2002) this nitrogen load may be supplemented by nitrates taken up by the phytoplankton in the spring time.
Relating these considerations to the Admiralty Bay ecosystem (considered a model for Antarctic studies), it should be pointed out that N and P concentrations in bay waters have increased in the bottom layer. Lipski (Citation1987) recorded about 4.8 µmol dm−3 NO3–N, about 0.03 µmol dm−3 NO2–N and about 0.55 µmol dm−3 TRP in this layer. This increase in concentration also may be partly due to the excretion of N and P by zoobenthos. The total biomass of the benthic fauna inhabiting the entire bottom surface of Admiralty Bay was estimated at ca. 67,000 tonnes, the mean density at ca. 6500 individuals per m−2 (maximum densities can reach over 36,000 individuals per m−2) (Jażdżewski et al. Citation1986). The mean wet weight of the zoobenthos is 700 g m−2, with 500–900 g m−2 falling within its 95% confidence limits (Jażdżewski et al. Citation1986; Jażdżewski & Siciński Citation1993). Based on these data, it is possible to estimate with some approximation the N and P loads that may be introduced into the ecosystem by the equivalent biomass of 700 g m−2 of G. antarcticus or W. obesa, which are the important zoobenthic species of Admiralty Bay (Siciński et al. Citation2011). Considering the average excretion of nitrate nitrogen and TRP by G. antarcticus and W. obesa, it can be estimated that these species can provide 1.21 and 0.4 µmol N h−1 m−2 and 0.22 and 0.08 µmol P h−1 m−2, respectively. Even if the calculated values are overestimated, the excretion of N and P by zoobenthos cannot be neglected in the balance of nutrients in this ecosystem because this source can influence primary production, among other things, by changing the N:P ratio.
Research by Redfield (Citation1958) indicates that the nitrogen to phosphorus ratios in plankton (N:P = 16) and in ocean waters (N:P = 15) were similar, and reflect the phytoplankton demand for these nutrients. Klausmeier et al. (Citation2004) argue, however, that the value of N:P = 16 should be viewed as a weighted average of the relative abundance of species, with various N:P ratios exceeding even 120. The relative abundance of species depends on the ecological conditions in which they grow and compete. At the same time, competitive equilibrium selects high N:P ratios, and exponential growth selects low N:P values. The N:P ratios in our research were higher (on average 2 times higher for G. antarcticus and 9 times higher for W. obesa) than postulated by Redfield (Citation1958) for the standard for ocean waters. At the same time, high differences (P < 0.05) between the tested species (the maximum values of the TIN:TRP ratio were 48 for G. antarcticus and 562 for W. obesa), perhaps, as concluded by Klausmeier et al. (Citation2004), positively affect the competitive balance while maintaining high biodiversity. On the other hand, such an N:P ratio indicates that the primary production may be limited by the availability of phosphorus. As shown by Nędzarek (Citation2008) in the waters of Admiralty Bay, primary production may be simultaneously limited by the availability of nitrogen and phosphorus (N:P = 12). However, in the light of a high inflow of ammoniacal nitrogen and organic nitrogen, this balance may be disturbed to the disadvantage of phosphorus. For example, Nędzarek et al. (Citation2015), when examining the distribution of Antarctic fish remains, noted a 4 times greater available ammonia nitrogen for autotrophs compared to the value characteristic for Admiralty Bay water estimated by Nędzarek (Citation2008), at 15%.
4.4. Effect of starvation on invertebrates
The seasonality of Antarctic marine ecosystems means that the relationship between nutrition and metabolism is of particular interest as many polar organisms must survive long periods without food, leading to multidirectional changes in their body chemistry (Clarke Citation1983, Citation1988; Ritar et al. Citation2003; Comoglio et al. Citation2005; Watts et al. Citation2014; Stepanowska & Nędzarek Citation2020), also shown in the subject’s amphipods and isopods. For example, a similar reduction in nitrogen and protein content in W. obesa starved for 64 days was observed by Chapelle et al. (Citation1994).
Ritar et al. (Citation2003) suggest that the utilization of metabolic reserves in crustaceans may proceed in an orderly fashion, from the oxidation of lipid reserves to protein catabolism and the subsequent breakdown of membrane phospholipids before death. Such a response pattern to hunger may explain the relatively low reduction of nitrogen and protein (partially also low phosphorus excretions) in the studied crustaceans.
It can also be assumed that the increase in protein content in W. obesa and G. antarcticus observed at the end of the long-term starvation resulted from changes in the dry weight of crustaceans, and not the loss of tissue proteins. A similar phenomenon was observed by Friedrich and Stepanowska (Citation2001) during a 12-week starvation of Cyprinus carpio. The increase in protein concentration with simultaneously changing percentage of dry matter content was observed already in the fourth week of C. carpio starvation. A similar phenomenon was also observed during the 52-day starvation of Antarctic fish Notothenia coriiceps (Stepanowska et al. Citation2006)
The reported dry matter reduction in the crustaceans should be considered as the body’s natural response to hunger. Reduced food supply leading to hunger leads to the use of internal resources, resulting in a change in the weight of the whole body (McCue Citation2010). Various species, including marine crustaceans, can survive starvation for long periods (even >6 months) without marked changes in total body weight (Watts et al. Citation2014). As tissue reserves are used up during starvation, these organisms simultaneously take up water to maintain body volume (Comoglio et al. Citation2005). This mechanism could have influenced the obtained results (“apparent” increases) in the content of nitrogen, protein, ash and dry weight of the tested crustaceans after the end of the experiment.
5. Summary
The metabolic products excreted by the tested crustaceans may be a supplemental source of nitrogen and phosphorus for autotrophs. They generally contained more nitrogen than phosphorus. Ammoniacal nitrogen dominates the pool of nitrogen compounds and its excretion was higher in W. obesa than in G. antarcticus. TRP dominated in the pool of phosphorus compounds, and its excretion was higher in G. antarcticus than in W. obesa. Despite the low share of oxidized nitrogen forms in total nitrogen, they can supplement the nitrates taken up by phytoplankton in spring, during the new production period. High values of the Redfield coefficient significantly above 16 indicate that metabolites excreted by crustaceans may influence the direction of limiting the primary production by the availability of phosphorus.
The recorded decrease in excretion with the time of starvation is exponential for nitrogen and sinusoidal for phosphorus. The higher decrease in nitrogen excretion in W. obesa and in phosphorus in G. antarcticus may have been due to the differences in the metabolism of the studied species.
Despite the separate reactions of crustaceans to hunger, the greatest decreases in nitrogen and protein content in W. obesa and G. antarcticus occurred in the first days of starvation. On the other hand, the “apparent” increase in these body components after 65 and 50 days of starvation confirms the adaptation of amphipods and isopods to prolonged periods of hunger.
Supplemental Material
Download MS Word (12.3 KB)Supplemental Material
Download MS Word (92 KB)Supplemental Material
Download MS Word (21.4 KB)Acknowledgements
Data presented in this study were collected during the 29th Polish Antarctic Expedition at Henryk Arctowski Station (King George Island, South Shetlands). The authors thank Professor Stanisław Rakusa-Suszczewski for establishing such a great station, and the members of the 29th expedition for their support and friendship during our work at Henryk Arctowski Polish Antarctic Station. Particular thanks are addressed to the anonymous referees for their most helpful comments on the manuscript.
Disclosure statement
No potential conflict of interest was reported by the author(s).
Supplementary material
Supplemental data for this article can be accessed online at https://doi.org/10.1080/24750263.2022.2107721
Additional information
Funding
References
- Alcaraz M, Almeda R, Kalbet A, Saiz E, Duarte CM, Lasternas S, Agustí S, Santiago R, Movilla J, Alonso A. 2010. The role of Arctic zooplankton in biogeochemical cycles: Respiration and excretion of ammonia and phosphate during summer. Polar Biology 33:1719–1731. DOI: 10.1007/s00300-010-0789-9.
- Alves JM, Caliman A, Guariento RD, Figueiredo-Barros MP, Carneiro LS, Farjalla VF, Bozelli RL, Esteves FA. 2010. Stoichiometry of benthic invertebrate nutrient recycling: Interspecific variation and the role of body mass. Aquatic Ecology 44(2):421–430. DOI: 10.1007/s10452-009-9302-3.
- APHA. 1999. Standard Methods for examination of water and wastewater. 20th ed. Washington, USA: American Public Health Association.
- Atkinson A, Hil SL, Pakhomov EA, Siegel V, Reiss CS, Loeb VJ, Steinberg DK, Schmidt K, Tarling GA, Gerrish L, Sailley SF. 2019. Krill (Euphausia superba) distribution contracts southward during rapid regional warming. Nature Climate Change 9:142–147. DOI: 10.1038/s41558-018-0370-z.
- Balik JA, Taylor BW, Washko SE, Wissinger SA. 2018. High interspecific variation in nutrient excretion within a guild of closely related caddisfly species. Ecosphere 9(5):e02205. DOI: 10.1002/ecs2.2205.
- Battke Z. 1990. Admiralty Bay. King George Island. Skala 1:50000. Warsaw: Printed by E. Romer, State Cartographical Publishing House.
- Bode A, Castro CG, Doval MD, Varela M. 2002. New and regenerated production and ammonium regeneration in the western Bransfield Strait region (Antarctica) during phytoplankton bloom conditions in summer. Deep-Sea Research Part II: Topical Studies in Oceanography 49:787–804.
- Boyce SJ. 1999. Nitrogenous excretion in the Antarctic plunderfish. Journal of Fish Biology 54:72–81. DOI: 10.1111/j.1095-8649.1999.tb00613.x.
- Chapelle G, Peck LS, Clarkeb A. 1994. Effects of feeding and starvation on the metabolic rate of the necrophagous Antarctic amphipod Waldeckia obesa (Chevreux, 1905). Journal of Experimental Marine Biology and Ecology 183:63–66. DOI: 10.1016/0022-0981(94)90157-0.
- Chwedorzewska KJ, Korczak-Abshire M, Znój A. 2020. Is Antarctica under treat of alien species invasion? Global Change Biology 26:1942–1943. DOI: 10.1111/gcb.15013.
- Clarke A. 1983. Life in cold water: The physiological ecology of polar marine ectotherms. Oceanography and Marine Biology: An Annual Review 21:341–353.
- Clarke A. 1988. Seasonality in the Antarctic marine environment. Comparative Biochemistry and Physiology Part B: Comparative Biochemistry 3:461–473.
- Comoglio L, Smolko L, Amin O. 2005. Effects of starvation on oxygen consumption, ammonia excretion and biochemical composition of the hepatopancreas on adult males of the False Southern King crab Paralomis granulosa (Crustacea, Decapoda). Comparative Biochemistry and Physiology Part B: Biochemistry and Molecular Biology 140:411–416. DOI: 10.1016/j.cbpc.2004.11.003.
- Convey P, Peck LS. 2019. Antarctic environmental change and biological responses. Science Advances 11:1–16. DOI: 10.1126/sciadv.aaz0888.
- De Broyer C, Nyssen F, Dauby P. 2004. The crustacean scavenger guild in Antarctic shelf, bathyal and abyssal communities. Deep Sea Research Part II: Topical Studies in Oceanography 51:1733–1752. DOI: 10.1016/j.dsr2.2004.06.032.
- Dearborn JH. 1967. Food and reproduction of Glyptonotus antarcticus (Crustacea: Isopoda) at McMurdo Sound, Antarctica. Transactions of the Royal Society of New Zealand: Zoology 8(15):163–168.
- Elser JJ, Bracken MES, Cleland EE, Gruner DS, Harpole WS, Hillebrand H, Ngai JT, Seabloom EW, Shurin JB, Smith JE. 2007. Global analysis of nitrogen and phosphorus limitation of primary producers in freshwater, marine and terrestrial ecosystems. Ecology Letters 10:1135–1142. DOI: 10.1111/j.1461-0248.2007.01113.x.
- Friedrich M, Stepanowska K. 2001. Effect of starvation on nutritive value of carp (Cyprinus carpio L.) and selected biochemical components of its blood. Acta Ichthyologica et Piscatoria 31(2):29–36. DOI: 10.3750/AIP2001.31.2.03.
- Galera H, Chwedorzewska KJ, Korczak-Abshire M, Wódkiewicz M. 2018. What affects the probability of biological invasions in Antarctica? Using an expanded conceptual framework to anticipate the risk of alien species expansion. Biodiversity and Conservation 27(8):1789–1809. DOI: 10.1007/S10531-018-1547-5.
- Goeyens L, Semeneh M, Baumann MEM, Elskens M, Shopova D, Dehairs F. 1998. Phytoplanktonic nutrient utilisation and nutrient signature in the Southern Ocean. Journal of Marine Systems 17:143–157. DOI: 10.1016/S0924-7963(98)00035-9.
- Henley SF, Schofield OM, Hendry KR, Schloss IR, Steinberg DK, Moffat C, Peck LS, Costa DP, Bakker DC, Hughes C, Rozema PD. 2019. Variability and change in the west Antarctic Peninsula marine system: Research priorities and opportunities. Progress in Oceanography 173:208–237. DOI: 10.1016/j.pocean.2019.03.003.
- Ikeda T. 2013. Metabolism and chemical composition of marine pelagic amphipods: Synthesis toward a global bathymetric model. Journal of Oceanography 69(3):339–355. DOI: 10.1007/s10872-013-0177-5.
- Janecki T, Rakusa-Suszczewski S. 2004. The effect of glutamic acid (Glu) and kynurenic acid (Kyn) on the metabolism of the Antarctic amphipod Abyssorchomene plebs. Journal of Crustacean Biology 24(1):81–83. DOI: 10.1651/C-2390.
- Janecki T, Rakusa-Suszczewski S. 2005. The influence of starvation and amino acids on metabolism of the Antarctic amphipod Waldeckia obesa. 2004. Journal of Crustacean Biology 25(2):196–202. DOI: 10.1651/C-2522.
- Janecki T, Rakusa-Suszczewski S. 2006. Biology and metabolism of Glyptonotus antarcticus (Eights) (Crustacea: Isopoda) from Admiralty Bay, King George Island, Antarctica. Polar Biosciences 19:29–42.
- Jażdżewska MA, Siciński J. 2017. Assemblages and habitat preferences of soft bottom Antarctic Amphipoda: Admiralty Bay case study. Polar Biology 40:1845–1869. DOI: 10.1007/s00300-017-2107-2.
- Jażdżewski K, De Broyer C, Teodorczyk W, Konopacka A. 1982. Survey and distributional patterns of the amphipod fauna of Admiralty Bay, King George Island, South Shetland Island. Polish Polar Research 12:461–472.
- Jażdżewski K, Jurasz W, Kitel W, Presler P, Siciński J. 1986. Abundance and biomass estimates of the benthic fauna in Admiralty Bay, King George Island, South Shetland Islands. Polar Biology 6:5–16. DOI: 10.1007/BF00446235.
- Jażdżewski K, Siciński J. 1993. 12. Zoobenthos. 12.1. General remarks. In: Rakusa-Suszczewski S, editor. The maritime coastal ecosystem of Admiralty Bay. Warsaw: Department of Antarctic Biology, Polish Academy of Sciences. pp. 83–95.
- Klausmeier CA, Lichtman E, Daufresne T, Levin SA. 2004. Optimal nitrogen-to-phosphorus stoichiometry of phytoplankton. Nature 429:171–175. DOI: 10.1038/nature02454.
- Lehette P, Tovar-Sánchez A, Duarte CM, Hernández-León S. 2012. Krill excretion and its effect on primary production. Marine Ecology Progress Series 459:29–38. DOI: 10.3354/meps09746.
- Lipski M. 1987. Variations of physical conditions, nutrients and chlorophyll a contents in Admiralty Bay (King George Island, South Shetland Islands, 1979). Polish Polar Research 8:307–332.
- McCue MD. 2010. Starvation physiology: Reviewing the different strategies animals use to survive a common challenge. Comparative Biochemistry and Physiology - Part A: Molecular & Integrative Physiology 156:1–18. DOI: 10.1016/j.cbpa.2010.01.002.
- Nędzarek A. 2008. Sources, diversity and circulation of biogenic compounds in Admiralty Bay (King George Island, Antarctica). Antarctic Science 20(2):135–145. DOI: 10.1017/S0954102007000909.
- Nędzarek A, Tórz A, Rakusa-Suszczewski S, Bonisławska M. 2015. Nitrogen and phosphorus release during fish decomposition and implications for the ecosystem of maritime Antarctica. Polar Biology 38:733–740. DOI: 10.1007/s00300-014-1612-9.
- Obermüller BE, Morley SA, Barnes DKA, Peck LS. 2010. Seasonal physiology and ecology of Antarctic marine predators and scavengers. Marine Ecology Progress Series 415:109–126. DOI: 10.3354/meps08735.
- Pinkerton MH, Boyd PW, Deppeler S, Hayward A, Höfer J, Moreau S. 2021. Evidence for the impact of climate change on primary producers in the Southern Ocean. Frontiers in Ecology and Evolution 9:592027. DOI: 10.3389/fevo.2021.592027.
- Polukhin AA, Morozov EG, Tichchenko PP, Frey DI, Artemiev VA, Borisenko GV, Vidnichuk AV, Marina EN, Medvedev EV, Popov OS, Seliverstovo AM, Chultsova AL. 2021. Water structure in the Bransfield Strait (Antarctica) in January 2020: Hydrophysical, optical and hydrochemical features. Oceanology 6(5):632–644. DOI: 10.1134/S0001437021050106.
- Potocka M, Kidawa A, Panasiuk A, Bielecka L, Wawrzynek-Borejko J, Patuła W, Wójcik KA, Plenzler J, Janecki T, Bialik RJ. 2019. The effect of glacier recession on benthic and pelagic communities: Case study in Herve Cove, Antarctica. Journal of Marine Science and Engineering 7:285. DOI: 10.3390/jmse7090285.
- Presler P. 1986. Necrophagous invertebrates of the Admiralty Bay of King George Island (South Shetland Islands, Antarctica). Polish Polar Research 7:25–61.
- Priddle J, Leakey R, Symon C, Whitehouse M, Robins D, Cripps G, Murphy E, Owens N. 1995. Nutrient cycling by Antarctic marine microbial plankton. Marine Ecology Progress Series 116:181–198. DOI: 10.3354/meps116181.
- Rakusa-Suszczewski S. 1995. The hydrography of Admiralty Bay and its inlets, coves and lagoons (King George Island, Antarctica). Polish Polar Research 16:61–70.
- Rakusa-Suszczewski S, Janecki T, Domanov MM. 2010. Starvation and chemoreception in Antarctic benthic invertebrates. Biology Bulletin 37(1):56–62. DOI: 10.1134/S1062359010010085.
- Redfield AC. 1958. The biological control of chemical factors in the environment. American Scientist 46:205–221.
- Ritar AJ, Dunstan GA, Crear BJ, Brown MR. 2003. Biochemical composition during growth and starvation of early larval stages of cultured spiny lobster (Jasus edwardsii) phyllosoma. Comparative Biochemistry and Physiology Part A: Molecular & Integrative Physiology 136:353–370. DOI: 10.1016/S1095-6433(03)00167-3.
- Robertson RF, El-Haj AJ, Clarke A, Peck LS, Taylor EW. 2001. The effects of temperature on metabolic rate and protein synthesis following a meal in the isopod Glyptonotus antarcticus Eights (1852). Polar Biology 24:677–686. DOI: 10.1007/s003000100268.
- Saba GK, Fraser WR, Saba VS, Iannuzzi RA, Coleman KE, Doney SC, Ducklow HW, Martinson DG, Miles TN, Patterson-Fraser DL, Stammerjohn SE, Steinberg DK, Schofield OM. 2014. Winter and spring controls on the summer food web of the coastal West Antarctic Peninsula. Nature Communications 5:4318. DOI: 10.1038/ncomms5318.
- Sailing directions (planning guide) and enroute for Antarctica. 1985. 1st ed. Pub. 200. Published by the Defense Mapping Agency Hydrographic. Topographic Center. p. 129.
- Siciński J, Jażdżewski K, de Broyer C, Presler P, Ligowski R, Nonato EF, Corbisier TN, Petti MAV, Brito TAS, Lavrado H, Błażewicz-Paszkowycz M, Pabis K, Jażdżewska A, Campos LS. 2011. Admiralty Bay benthos diversity - A census of a complex polar ecosystem. Deep Sea Research Part II: Topical Studies in Oceanography 58(1–2):30–48. DOI: 10.1016/j.dsr2.2010.09.005.
- Siegel V. 2016. Biology and ecology of Antarctic Krill. London: Springer. p. 441. DOI: 10.1007/978-3-319-29279-3.
- Stepanowska K, Nędzarek A, Rakusa-Suszczewski S. 2006. Effects of starvation on the biochemical composition of blood and body tissue in the Antarctic fish Notothenia coriiceps (Richardson, 1844) and excreted metabolic products. Polar Biosciences 20:46–54.
- Stepanowska K, Nędzarek A. 2020. Changes in the body chemical composition and the excretion of nitrogen and phosphorus during long-term starvation of Antarctic fish Notothenia coriiceps and Notothenia rossii. The European Zoological Journal 87(1):571–579. DOI: 10.1080/24750263.2020.1822451.
- Sturz AA, Gray SC, Dykes K, King A, Radtke J. 2003. Seasonal changes of dissolved nutrients within and around Port Foster Deception Island, Antarctica. Deep Sea Research Part II: Topical Studies in Oceanography 50:1685–1705. DOI: 10.1016/S0967-0645(03)00086-9.
- Vanni MJ, McIntyre PB, Allen D, Arnott DL, Benstead JP, Berg DJ, Brabrand A, Brosse S, Bukaveckas PA, Caliman A, Capps K. 2017. A global database of nitrogen and phosphorus excretion rates of aquatic animals. Ecology 98(5):1475. DOI: 10.1002/ecy.1792.
- Watts AJR, McGill RAA, Albalat A, Neil DM. 2014. Biophysical and biochemical changes occur in Nephrops norvegicus during starvation. Journal of Experimental Marine Biology and Ecology 457:81–89. DOI: 10.1016/j.jembe.2014.03.020.
- Whitehouse MJ, Priddle J, Brandon MA, Swanson C. 1999. A comparison of chlorophyll/nutrient dynamics at two survey sites near South Georgia, and the potential role of planktonic nitrogen recycled by land-based predators. Limnology and Oceanography 44(6):1498–1508. DOI: 10.4319/lo.1999.44.6.1498.
- Znój A, Chwedorzewska KJ, Androsiuk P, Cuba‐Diaz M, Giełwanowska I, Koc J, Korczak‐Abshire M, Grzesiak J, Zmarz A. 2017. Rapid environmental changes in the Western Antarctic Peninsula region due to climate change and human activity. Applied Ecology and Environmental Research 15:525–539. DOI: 10.15666/AEER/1504_525539.