
Abstract
Cheyletus, including Cheyletus malaccensis and Cheyletus eruditus and other species, is a predatory mite at genus level. Some studies have reported distribution rates of Cheyletus in dust samples, but their results are inconsistent. The aim of this meta analysis was to comprehensively evaluate the distribution rates of Cheyletus in dust samples. Articles concerning the distribution rates of Cheyletus species in dust samples were searched and screened in electronic databases. The pooled distribution rate with 95% confidence interval (95% CI) were calculated. Thirteen articles were included in this meta-analysis. A total of 15 studies reported the rates of Cheyletus in all mites from dust and the pooled rate was 2.62% (95% CI: 2.32%–2.92%). A total of three studies reported the rates of dust samples with Cheyletus in all dust samples and their pooled rate was 19.82% (95% CI: 5.10%–34.54%). Heterogeneities existed within included studies and source of heterogeneities could not be found though subgroup analyses by species, publication year, sample size of all mites were conducted. There is a low rate of Cheyletus in all mites from dust and a low rate of dust samples with Cheyletus in all dust samples.
1 Background
Domestic mites, including house dust mites and storage mites, belong to the subphylum Chelicerata, class Arachnida, subclass Acari, superorder Acariformes, order Sarcoptiformes, suborder Oribatida, and cohort Astigmatina (Krantz & Walter Citation2009). Domestic mites can cause allergy in more than 10% of the general population, and 90% of individuals suffering from allergic asthma are sensitive to domestic mites (Li et al. Citation2018). The major house dust mites, including Dermatophagoides pteronyssinus, Dermatophagoides farinae, Blomia tropicalis, and Euroglyphus maynei, account for 80% of the total allergenic species, with storage mites making up the remainder (Zhou et al. Citation2018).
Storage mites, including families Glycyphagidae, Cheyletidae and others, occur widely in stored products like grains, foodstuffs, and Chinese medicinal herbs. They are also found in mattresses, pillows, and upholstery from houses (Cui Citation2014). Cheyletus is at genus level and belongs to Cheyletidae. Cheyletus includes a variety of species such as Cheyletus malaccensis, Cheyletus eruditus and other. Unlike house dust mites, few reports are available on Cheyletus regarding on allergy (Poza Guedes et al. Citation2016). As for distribution rate in all mites from dust samples, a report from Brazil showed Cheyletus malaccensis had a lower rate (7.1%) compared with Dermatophagoides Pteronyssinus (39.8%) (Dutra et al. Citation2018).
Although a few studies have reported rates of Cheyletus in dust samples (Colloff Citation1987; Fernández-Caldas et al. Citation1993; Ree et al. Citation1997; Chew et al. Citation1999; Silva da Ezequiel et al. Citation2001; Sharma et al. Citation2011; Kosik-Bogacka et al. Citation2012; Heikal Citation2015; Zeytun et al. Citation2015; Soleimani-Ahmadi et al. Citation2017; Dutra et al. Citation2018; Gill and Dhaliwal Citation2018; Shafique et al. Citation2018), their results are different and inconsistent. A report from Soleimani-Ahmadi showed that the rate of Cheyletus malaccensis in all mites from dust was 8.25% (Soleimani-Ahmadi et al. Citation2017). However, the rate of Cheyletus malaccensis changed to 0.03% in another report from (Silva da Ezequiel et al. Citation2001). In order to comprehensively overview the rates of Cheyletus in dust samples, this meta analysis paper was performed.
2 Material and methods
This meta-analysis was conducted according to the guidelines of the PRISMA statement (Moher et al. Citation2010)
2.1 Search strategy
We systematically searched articles published in electronic databases including Pubmed, Sciencedirect, Cochrane Library. The last search data was on March 27, 2022. Search terms were as follows: (“Cheyletus” or “Cheyletidae”) and (“dust” or “dust sample” or “dust samples“ or “house” or “houses” or “home” or “homes” or “prevalence”). Titles and abstracts from articles identified by electronic searches were examined. A full-text paper was obtained wherever possible. Cited references of identified articles were examined to select other relevant articles. Two reviewers independently searched the articles. Any disagreements between the two reviewers were resolved by consensus.
2.2 Selection criteria
Inclusion criteria of articles were as follows: 1) articles were designed to evaluate the distribution rates of Cheyletus in dust samples; 2) detailed data, concerning sample size of Cheyletus and sample size of all mites, or sample size of dust samples with Cheyletus and sample size of all dust samples, could be extracted or calculated from articles; 3) articles were published after January 1, 1980; 4) articles were written in English.
Exclusion criteria of articles were as follows: 1) reviews, meta-analyses, letters, or case reports; 2) duplicate of previous publication.
2.3 Data extraction
The following data were extracted from eligible articles: first author, publication year, country where research was conducted, species of Cheyletus, sample size of Cheyletus and sample size of all mites from dust, sample size of dust samples with Cheyletus and sample size of all dust samples. Two reviewers independently extracted data. Any disagreements between the two reviewers were resolved by consensus.
2.4 Statistical analysis
The pooled distribution rates with 95% confidence intervals (95% CI) were calculated and forest plots were drawn. A Cochrane-Q test of heterogeneity was performed using the inconsistency index. The value of I2 > 50% and P value < 0.05 indicated the existence of significant heterogeneity among studies. If heterogeneity was detected, the random effect model was used; otherwise, the fixed effect model was used. Sensitivity analysis was conducted to assess the stability of analysis. Subgroup analyses by species of Cheyletus, publication year, sample size of all mites were also performed. Statistical analyses were conducted using STATA software version 12.0 (College Station, TX, USA).
3 Results
3.1 Characteristics of included studies
As shown in , a total of 49 articles were identified through database searching. After screening the titles and abstracts, 20 full-text articles were obtained for further assessment. Of these, seven manuscripts were then excluded (one manuscript without dust samples (Palyvos et al. Citation2008), two manuscripts with Cheyletidae but not Cheyletus (Feldman-Muhsam et al. Citation1985; Yu et al. Citation2015), four manuscripts without useful or detailed data (Terho et al. Citation1982; Wassenaar Citation1988; Baqueiro et al. Citation2006; Caplin et al. Citation2009). Overall, 13 articles were included in this meta-analysis (Colloff Citation1987; Fernández-Caldas et al. Citation1993; Ree et al. Citation1997; Chew et al. Citation1999; Silva da Ezequiel et al. Citation2001; Sharma et al. Citation2011; Kosik-Bogacka et al. Citation2012; Heikal Citation2015; Zeytun et al. Citation2015; Soleimani-Ahmadi et al. Citation2017; Dutra et al. Citation2018; Gill and Dhaliwal Citation2018; Shafique et al. Citation2018).
Figure 1. Flow diagram of article selection.
The countries where researches were conducted included Brazil, Pakistan, Italy, Iran, Egypt, Turkey, Poland, India, Singapore, Korea, the United States and Britain. The publication year was from 1987 to 2018. Species of Cheyletus included Cheyletus malaccensis, Cheyletus eruditus, Cheyletus fortis and Cheyletus trouessarti. There were 6 articles without stating specific name of Cheyletus species in their manuscripts (Fernández-Caldas et al. Citation1993; Sharma et al. Citation2011; Kosik-Bogacka et al. Citation2012; Zeytun et al. Citation2015; Soleimani-Ahmadi et al. Citation2017; Gill and Dhaliwal Citation2018; Shafique et al. Citation2018). Article by Heikal reported both sample size of mites from dust and sample size of dust samples with Cheyletus (Heikal, Citation2015). The characteristics of all studies were shown in .
Table I. Characteristics of included studies.
3.2 Distribution rates of Cheyletus in dust samples
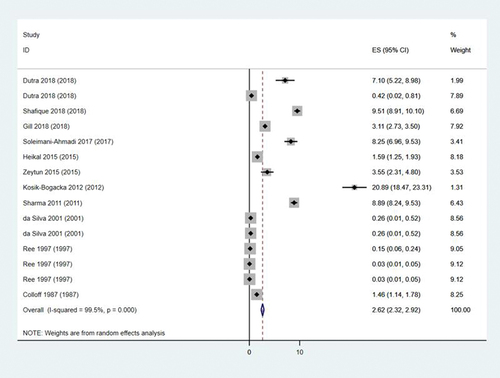
A total of 15 studies reported the rates of Cheyletus in all mites from dust (). The rates ranged from 0.03% (95% CI: 0.01%–0.03%) to 20.89% (95% CI: 18.47%–23.31%). The pooled rate was 2.62% (95% CI: 2.32%–2.92%). The heterogeneity found within the studies was high (I2 = 99.5%, P < 0.001).
Figure 2. Forest plot of rates of Cheyletus in all mites from dust. ES is abbreviation of effect size and means distribution rate (%).
A total of 3 studies reported the rates of dust samples with Cheyletus in all dust samples (). The rates ranged from 6.94% (95% CI: 2.79%–11.10%) to 32.00% (95% CI: 19.07%–44.93%). The pooled rate was 19.82% (95% CI: 5.10%–34.54%). The heterogeneity found within the studies was high (I2 = 91.7%, P < 0.001).
Figure 3. Forest plot rates of dust samples with Cheyletus in all dust samples. ES is abbreviation of effect size and means distribution rate (%).
3.3 Subgroup analysis for the distribution rates of Cheyletus in all mites
The results of subgroup analysis for the distribution rates of Cheyletus in all mites were presented in . Subgroup analysis by species showed there were five studies concerning Cheyletus malaccensis and their pooled rate was 2.94% (95% CI: 1.78%–4.11%). Three studies reported Cheyletus eruditus and the pooled rate was 0.63% (95% CI: 0.01%–1.54%). Other species of Cheyletus such as Cheyletus fortis and Cheyletus trouessarti were not included in subgroup analysis because each species only had one study investigated. Studies without stating specific name of species were also not included in subgroup analysis.
Table II. Results of subgroup analysis of distribution rates.
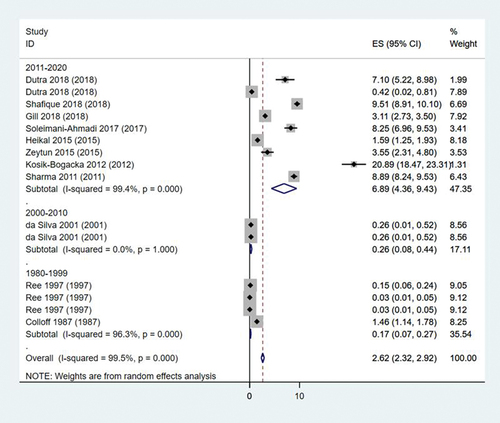
As shown on , subgroup analysis by publication year was performed. The number of studies concerning year from 2011 to 2020, year from 2000 to 2010, and year from 1980 to 1999 were respectively 9, 2 and 4. Their pooled rates were, respectively, 6.89% (95% CI: 4.36%–9.43%), 0.26% (95% CI: 0.08%–0.44%), 0.17% (95% CI: 0.07%–0.27%).
Figure 4. Forest plot of subgroup analysis by year of publication. ES is abbreviation of effect size and means distribution rate (%).
A subgroup analysis using the sample size of all mites was also performed. The number of studies concerning sample size less than 1000, sample size from 1000 to 3000, sample size larger than 3000 were respectively 3, 4 and 8. Their pooled rates were, respectively, 3.60% (95% CI: 0.01%–7.22%), 6.73% (95% CI: 4.13%–9.33%), 2.59% (95% CI: 2.25%–2.93%).
Almost all heterogeneities within subgroups were still high except the heterogeneity of year from 2000 to 2010 decreased (I2 = 0.0%, P = 1.00).
3.4 Sensitivity analysis for the distribution rates of Cheyletus in all mites
Sensitivity analysis () showed four studies with sample size larger than 3000 of all mites could affect the pooled rates apparently (Ree et al. Citation1997; Sharma et al. Citation2011; Shafique et al. Citation2018). Omitting two studies reported by (Ree et al. Citation1997) could increase the pooled rates. Whereas, omitting two studies reported by (Sharma et al. Citation2011; Shafique et al. Citation2018) could decrease the pooled rates.
Figure 5. Sensitivity analysis by omitting studies one by one.

4. Discussion
This paper comprehensively assessed the distribution rates of Cheyletus in dust samples for the first time. All dust samples were from living houses and kindergartens. The instruments to collect dust sample and identify Cheyletus species were vacuum cleaner and microscope. Our paper estimated that the pooled rate of Cheyletus in all mites was a low rate. For Cheyletus malaccensis and Cheyletus eruditus, their pooled rates were low. More studies are needed to confirm rates of other Cheyletus species such as Cheyletus fortis and Cheyletus trouessarti. This paper also demonstrated that pooled rate of dust samples with Cheyletus in all dust samples was also a low rate.
Subgroup analysis by publication year showed that distribution rates could increase with year, which might be related to the development of detection capability for Cheyletus species. Subgroup analysis by sample size of all mites showed sample size from 1000 to 3000 had the highest rate and sample size larger than 3000 had the lowest rate. More studies should be conducted to confirm the result of subgroup analysis by sample size of all mites.
Although subgroup analysis by species, publication year and sample size of all mites were performed, significant heterogeneities still exited in almost all subgroups. Although sensitivity analysis showed four studies (Ree et al. Citation1997; Sharma et al. Citation2011; Shafique et al. Citation2018) could affect the pooled rates, heterogeneities did not decrease when omitting any one of them (data not shown). It is mentioned that factors such as source of dust sample, humidity, and temperature should be considered in future.
There were several limitations in this paper. First, significant heterogeneities existed within included studies and source of heterogeneities could not be found. Second, humidity and temperature, two important factors that could affect distribution rates, were not extracted and considered. Third, the number of included studies were relatively small. It is necessary to enroll more studies and adopt standardization of data extraction in future.
Overall, there is a low prevalence rate of Cheyletus in all mites from dust and a low distribution rate of dust samples with Cheyletus in all dust samples.
Disclosure statement
No potential conflict of interest was reported by the author(s).
References
- Baqueiro T, Carvalho FM, Rios CF, Dos Santos NM, Alcântara-Neves NM. 2006. Dust mite species and allergen concentrations in beds of individuals belonging to different urban socioeconomic groups in Brazil. Journal of Asthma 43(2):101–105. DOI: 10.1080/02770900500497958.
- Caplin J, Capriles-Hulett A, Iraola V, Pinto H, Sánchez-Borges M, de Los Santos G, Fernández-Caldas E. 2009. Allergic sensitization to domestic mites in Corpus Christi, Texas. Allergy and Asthma Proceedings 30(2):166–170. DOI: 10.2500/aap.2009.30.3209.
- Chew FT, Zhang L, Ho TM, Lee BW. 1999. House dust mite fauna of tropical Singapore. Clinical & Experimental Allergy 29(2):201–206. DOI: 10.1046/j.1365-2222.1999.00493.x.
- Colloff MJ. 1987. Mites from house dust in Glasgow. Medical and Veterinary Entomology 1(2):163–168. DOI: 10.1111/j.1365-2915.1987.tb00338.x.
- Cui Y. 2014. When mites attack: Domestic mites are not just allergens. Parasites & Vectors 7(1):411. DOI: 10.1186/1756-3305-7-411.
- Dutra MS, Roncada C, da Silva GL, Ferla NJ, Pitrez PM. 2018. Mite fauna assessment in houses of two distinct socioeconomic groups from Southern Brazil. Journal of Medical Entomology 55(3):620–625. DOI: 10.1093/jme/tjx239.
- Feldman-Muhsam B, Mumcuoglu Y, Osterovich T. 1985. A survey of house dust mites (Acari: Pyroglyphidae and Cheyletidae) in Israel. Journal of Medical Entomology 22(6):663–669. DOI: 10.1093/jmedent/22.6.663.
- Fernández-Caldas E, Puerta L, Mercado D, Lockey RF, Caraballo LR. 1993. Mite fauna, Der p I, Der f I and Blomia tropicalis allergen levels in a tropical environment. Clinical & Experimental Allergy 23(4):292–297. DOI: 10.1111/j.1365-2222.1993.tb00325.x.
- Gill NK, Dhaliwal AK. 2018. Seasonal variation of allergenic acarofauna from the homes of allergic rhinitis and asthmatic patients. Journal of Medical Entomology 55(2):262–268. DOI: 10.1093/jme/tjx206.
- Heikal HM. 2015. Studies on the occurrence, identification and control of house dust mites at rural houses of shebin el-kom locality, Egypt. Pakistan Journal of Biological Sciences 18(4):179–184. DOI: 10.3923/pjbs.2015.179.184.
- Kosik-Bogacka DI, Kalisinska E, Henszel L, Kuzna-Grygiel W. 2012. Seasonal dynamics of house dust mites in dust samples collected from sleeping places in north-western Poland. Zoonoses and Public Health 59(1):8–15. DOI: 10.1111/j.1863-2378.2011.01409.x.
- Krantz GW, Walter DE. 2009. A manual of acarology. 3rd ed. USA: Texas Tech University Press. pp. 565–657.
- Li L, Qian J, Zhou Y, Cui Y. 2018. Domestic mite-induced allergy: Causes, diagnosis, and future prospects. International Journal of Immunopathology and Pharmacology 32:2058738418804095. DOI: 10.1177/2058738418804095.
- Moher D, Liberati A, Tetzlaff J, Altman DG. 2010. Preferred reporting items for systematic reviews and meta-analyses: The PRISMA statement. International Journal of Surgery 8(5):336–341. DOI: 10.1016/j.ijsu.2010.02.007.
- Palyvos NE, Emmanouel NG, Saitanis CJ. 2008. Mites associated with stored products in Greece. Experimental and Applied Acarology 44(3):213–226. DOI: 10.1007/s10493-008-9145-y.
- Poza Guedes P, Sánchez Machín I, Matheu V, Iraola V, González Pérez R. 2016. Role of Predatory Mites in Persistent Nonoccupational Allergic Rhinitis. Canadian Respiratory Journal 2016:5782317. DOI: 10.1155/2016/5782317.
- Ree HI, Jeon SH, Lee IY, Hong CS, Lee DK. 1997. Fauna and geographical distribution of house dust mites in Korea. The Korean Journal of Parasitology 35(1):9–17. DOI: 10.3347/kjp.1997.35.1.9.
- Shafique RH, Akhter S, Abbas S, Ismail M. 2018. Sensitivity to house dust mite allergens and prevalence of allergy-causing house dust mite species in Pothwar, Pakistan. Experimental and Applied Acarology 74(4):415–426. DOI: 10.1007/s10493-018-0243-1.
- Sharma D, Dutta BK, Singh AB. 2011. Dust mites population in indoor houses of suspected allergic patients of South Assam, India. ISRN Allergy 2011:576849. DOI: 10.5402/2011/576849.
- Silva da Ezequiel O, Gazêta GS, Amorim M, Serra-Freire NM. 2001. Evaluation of the acarofauna of the domiciliary ecosystem in Juiz de Fora, State of Minas Gerais, Brazil. Memórias Do Instituto Oswaldo Cruz 96(7):911–916. DOI: 10.1590/S0074-02762001000700005.
- Soleimani-Ahmadi M, Zare M, Abtahi SM, Khazeni A. 2017. Species identification and prevalence of house dust mites as respiratory allergen in kindergartens of the Bandar Abbas City. Iranian Journal of Allergy, Asthma, and Immunology 16(2):133–139.
- Terho EO, Leskinen L, Husman K, Kärenlampi L. 1982. Occurrence of storage mites in finnish farming environments. Allergy 37(1):15–19. DOI: 10.1111/j.1398-9995.1982.tb04112.x.
- Wassenaar DP. 1988. Effectiveness of vacuum cleaning and wet cleaning in reducing house-dust mites, fungi and mite allergen in a cotton carpet: A case study. Experimental & Applied Acarology 4(1):53–62. DOI: 10.1007/BF01213841.
- Yu JM, Luo QH, Sun JL, Shi CL, Yin J, Zhou YL, Tang R, Zhang H, Yu Z, Chen M. 2015. Diversity of house dust mite Species in xishuangbanna dai, a tropical rainforest region in Southwest China. BioMed Research International 2015:421716. DOI: 10.1155/2015/421716.
- Zeytun E, Doğan S, Aykut M, Özçiçek F, Ünver E, Özçiçek A. 2015. House dust mites in Erzincan Province. Turkish Journal of Parasitology 39(2):124–130. DOI: 10.5152/tpd.2015.3759.
- Zhou Y, Jia H, Zhou X, Cui Y, Qian J. 2018. Epidemiology of spider mite sensitivity: A meta-analysis and systematic review. Clinical and Translational Allergy 8(1):21. DOI: 10.1186/s13601-018-0209-8.