
 ?Mathematical formulae have been encoded as MathML and are displayed in this HTML version using MathJax in order to improve their display. Uncheck the box to turn MathJax off. This feature requires Javascript. Click on a formula to zoom.
Abstract
Increasing human-wild boar conflicts in South Korea have led to a demand for effective management strategies. Absolute abundance, rather than relative indices, is needed for the long-term monitoring and population control of wild boars. Indirect methods for density estimation have become increasingly popular because they are cost-effective and do not have the risk of capture probability bias. We compared three indirect methods, including the non-invasive capture-recapture model (NICRM), random encounter model (REM), and fecal standing crop (FSC), in two different sites characterized by specific habitats (urban and agricultural environments). NICRM and REM reflected population fluctuation and hunting intensity assumptions at both sites; however, FSC did not reflect the latter. While using NICRM, efforts are needed for achieving a low genotyping error rate; this model would achieve more reliable results in low-density areas. REM with accurate parameter information (i.e., daily range, detection zone, and camera placement) could be the most effective density estimation method for long-term monitoring in South Korean environments. Conversely, FSC may not be recommended because of many factors, such as decomposition rate, rainfall, biased distribution of feces that might affect pellet groups. Additionally, the density estimates from this study can provide information for developing effective management strategies in South Korean environments.
Introduction
The wild boar (Sus scrofa L.) is one of the most widely distributed large mammals and the main game species in South Korea (SK). Human-wild boar conflicts have risen due to crop damage, appearance in the downtown area, vehicle collisions, and transmission of the African swine fever virus to domestic swine (Massei & Genov Citation2004; Lee & Lee Citation2019; Han et al. Citation2022).
Intensive hunting is the main method used to control wild boar populations in SK. Government managers usually preferred absolute numbers (i.e., density) to assess the effects of interventions (i.e., culling and hunting) and set the number of annual hunting quotas that were removed from the population.
Fecundity capacity (i.e., age of first reproduction and litter size) in many mammals is density-dependent (Guthery & Shaw Citation2013); thus, density is one of the crucial considerations in wildlife management. However, it is difficult to ascertain the number of wild boars directly because of their nocturnal activity patterns, social structures, and preferences for densely vegetated habitats (Boitani et al. Citation1994; Cahill et al. Citation2003; Ebert et al. Citation2010). Moreover, large-scale distance sampling is infeasible due to inadequate rural road conditions in SK environments.
To date, many researchers and managers have often used hunting or culling statistics as relative abundance indices to understand population trends. Although hunting bags are good population trend indices when cull effort is considered (Massei et al. Citation2014), effective management plans and long-term monitoring of wild boars often require precise information about the size of the local population (Miller et al. Citation2005; Engeman et al. Citation2013).
The capture-mark-recapture (CMR) method is a traditional direct method for density estimation. Capturing a wild boar is time-consuming, costly, and labor-intensive. Capture-recapture modeling requires an equal capture probability for each individual and a sufficient sample size (White Citation1982); however, sex, age, social status, and degree of experience frequently have a biased capture probability among individuals (Baber & Coblentz Citation1986). These limitations have led researchers to prefer alternative indirect methods for density estimation (Alves et al. Citation2013; Fryxell et al. Citation2014).
Non-invasive DNA-based methods have been applied to detect rare and elusive animals and estimate population size (Beja‐Pereira et al. Citation2009; Ebert et al. Citation2012). For example, Iberian lynx (Lynx pardinus) and Canada lynx (Lynx canadensis) have been detected in fecal and hair DNA samples from Europe and the USA, respectively (McDaniel et al. Citation2000; Palomares et al. Citation2002; Waits & Paetkau Citation2005). The population size of brown bears (Ursus arctos) was estimated using a non-invasive capture-recapture model (NICRM) with a closed population model using hair samples (Solberg et al. Citation2006).
In recent years, NICRMs have been preferred by researchers because they are less expensive than traditional methods, and are preferred for ethical considerations because they are conducted without capturing individuals (McDaniel et al. Citation2000; Solberg et al. Citation2006). These approaches can facilitate large-scale surveys and reduce individual heterogeneities; thus, they may also be beneficial for density estimation of abundant species such as wild boars and deer (Fickel & Hohmann Citation2006; Ebert et al. Citation2010, Citation2012; Goode et al. Citation2014). Moreover, feces and hair collected from wild boars yield sufficient amounts of DNA for genotyping and reliable density estimates (Ebert et al. Citation2010, Citation2012).
Camera traps are an indirect method that is becoming increasingly popular for detecting cryptic and elusive species, monitoring animal behavior, and estimating the density of target species worldwide (Engeman et al. Citation2013; Cusack et al. Citation2015; Massei et al. Citation2018). Although camera trapping has relatively high initial costs, it can reduce labor costs, is a non-invasive quantitative method, and incurs minimal environmental disturbance (Henschel & Ray Citation2003; Silveira et al. Citation2003; Rowcliffe et al. Citation2008). A recent study has shown that the photographic rate of wild boar and other social animals correlated well with population density when group size is accounted for (Rovero & Marshall Citation2009; Ferretti et al. Citation2023). However, to obtain the absolute abundance, this method is restricted to species with unique individual markings for the CMR method (Trolle & Kéry Citation2003). Rowcliffe et al. (Citation2008) developed a novel method (random encounter model; REM) to estimate density using camera traps without the need for individual recognition, which validates deer populations of known sizes. REMs have provided reliable density estimates for multiple ungulate species including wild boars (Pfeffer et al. Citation2018; Palencia et al. Citation2022).
Fecal count techniques are among the most cost-effective indirect methods for density estimation and are performed following two different methodologies: fecal standing crop (FSC) and fecal accumulation rate (FAR) (Putman Citation1984; Campbell et al. Citation2004; Alves et al. Citation2013). The FSC method counts the number of feces and measures their decomposition rate. In contrast, FAR measures the rate of feces accumulation between two visits (clearing at the first visit and counting the number of feces at the second visit) (Plhal et al. Citation2014; Fattorini & Ferretti Citation2020). In a short survey period, FSC count is more precise than FAR because FAR may suffer a higher number of zero counts than FSC. On the other hand, FSC assumes the knowledge of both decomposition rate and defecation rate, whereas FAR only assumes the latter (Campbell et al. Citation2004).
In SK, the government monitors the wild boar population using relative indices (e.g., rubbing trees, feces, and footprints) from track surveys (National Institute of Biological Resources Citation2017). Thus, more reliable density estimates are required to establish harvest regimes and assess the effectiveness of population control in the future. The results from different methods for density estimation of wild boar vary depending on the environment (Acevedo et al. Citation2008; Engeman et al. Citation2013; Massei et al. Citation2018). Nevertheless, no studies have been conducted to estimate the density of wild boars and to determine which methods are suitable for South Korean populations.
Due to their large litter sizes, the density of this species can fluctuate significantly throughout the year (Plhal et al. Citation2014). Wild boars inhabiting SK mainly give birth from spring to summer (Lee Citation2022) and human intervention (i.e., hunting and culling) to reduce crop damage and wild boar-human interactions in downtown areas are implemented in fall-winter seasons. Moreover, harsh climates can also cause high mortality of juveniles in winter. Based on these, we assumed that (i) population size of wild boar in SK was the highest in the early fall and lowest in spring (population fluctuation assumption). In addition, intensive hunting of wild boars is carried out in rural areas all year round but is banned in urban environments where wild boars are hunted only when they appear in downtown areas. Hence, we assumed that (ii) the density was higher in urban areas than in agricultural areas (hunting intensity assumption).
The aims of the present study were to (1) assess whether wild boar density estimates obtained through three indirect methods (NICRM, REM, and FSC) could reflect the population fluctuation assumption, (2) assess whether these methods could reflect the hunting intensity assumption, and (3) ascertain the density estimates in SK environments for future effective management plans.
Methods
Study area
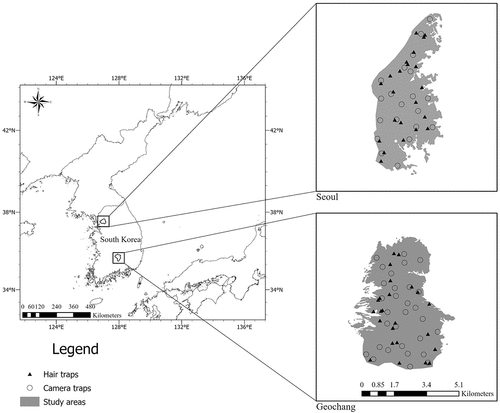
The present study was conducted in two different sites, each one characterized by a specific habitat. The first area (37° 36ʹ N, 126° 08 E, 6.7 km2) is a part of the city of Seoul and it is an urban habitat surrounding a highly developed environment. Seoul is the capital of South Korea, and forests are located around the city. The second area (35° 44ʹ N, 127° 59 ʹ E, 12.4 km2) is in Geochang and is a typical forest-agricultural environment (). Both areas have similar climatic conditions and consist of mixed forests, such as red pine (Pinus densiflora), sawtooth oak (Quercus acutissima), and Mongolian oak (Q. mongolica). The mean precipitation is 991 and 1,242 mm in Seoul and Geochang, respectively. Rainfall is maximum in summer and minimum in winter, and the annual temperature ranges from −18.0°C to 36.6°C in Seoul, and −12.8°C to 34.6°C in Geochang between winter and summer, respectively. The study area was based on forest composition, which was as similar as possible to the whole habitats to represent each site. In Seoul, hunting is allowed only when wild boars appear in downtown areas, while in Geochang, hunting and culling run all year round to reduce crop damage. Detailed information about the study area is provided by Lee and Lee (Citation2019).
Figure 1. Map of the study areas in South Korea and locations of hair traps (Seoul, n = 22; Geochang, n = 24; closed triangles) and camera traps (Seoul, n = 20; Geochang, n = 34; open circles). Note that gray areas (right) are enlarged study areas at each site. The 1,080 randomly located transects used to perform FSC are not shown to avoid overplotting.
NICRM
Wild boar hairs were used to estimate density at both sites. Wild boars wallow in mud and subsequently rub their bodies against trees. These “rubbing trees” are used as hair trap stations. We selected 46 rubbing trees (Seoul, n = 22; Geochang, n = 24; ) and collected only hairs with fresh roots over three consecutive periods (Period 1: March–June in 2017; Period 2: September–December in 2017; Period 3: March–June in 2018), which consisted of three sessions each for capture-recapture analysis. We removed all the hairs attached to the rubbing trees prior to each collection period and then collected hairs three to four times per week until the end of sessions. Hair samples were preserved in 1.5-μL microtubes and stored at −20°C until DNA extraction.
For DNA extraction, we cut 2 cm sections from hair follicles and mixed them with 10% Chelex resin (Bio-Rad, USA) in 1.5 m microtubes. The tubes were then placed in a heat block at 99°C for 20 min and cooled on ice for 2 min. After centrifuging at 14,000 rpm for 5 min, the supernatant was collected using a micropipette for repeated polymerase chain reaction (PCR) analysis.
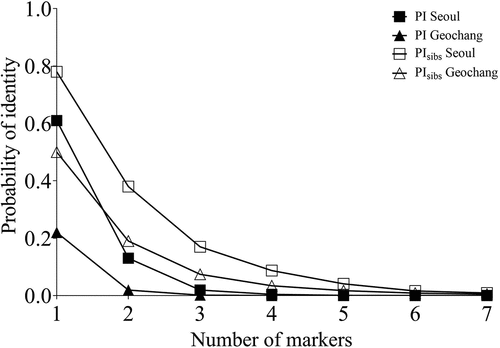
Kolodziej et al. (Citation2012) reported that at least four microsatellite markers are needed for the individual identification of wild boars. Ebert et al. (Citation2012) successfully identified wild boars using six markers. Individual identification was performed using eight markers based on previous studies () (ISAG/FAO Citation2004; Choi Citation2015). Amplification reactions were performed in duplicate using AccuPower® Gold Multiplex PCR Premix (Bioneer Corporation, South Korea). Each 20-μL reaction solution contained 1 μL of each primer, 2 μL of DNA template, and 16 μL of distilled water. PCR was conducted according to the manufacturer’s instructions: an initial denaturation step for 7 min at 94°C, followed by 21 cycles of 30 s at 94°C, 30 s at 50°C, and 30 s at 70°C, then an additional 25 cycles of 30 s at 94°C, 30 s at 55°C, and 30 s at 72°C, and a final elongation for 10 min at 72°C. We amplified all the sample DNA with SW830 and S0090 markers together three times as a preliminary experiment and filtered hairs that succeeded in obtaining sufficient target DNA amplification at least twice. Amplification PCR products were run on an ABI 3730 Sequencer (Applied Biosystems, Germany) with a Genescan 350 ROX size ladder, and we analyzed allele length using Gene marker ver. 3.0 software (Softgenetics, USA). Amplification was performed three times with four sets of eight markers () for all samples and filtered samples with the same allele length at least twice.
After genotyping, we checked microsatellite null alleles at a locus using Micro-Checker software (Van Oosterhout et al. Citation2004) and calculated the expected heterogeneity (Hexp), observed heterogeneity (Hobs), probability of identity (PI), and probability of identity of siblings (PIsibs) using GenAlEx (Peakall & Smouse Citation2012).
We identified individuals and generated encounter histories using GENECAP (Willberg & Dreher Citation2004). Since each survey period was short, we assumed that the wild boar population was closed. Full likelihood p (the probability of first capture) and c (the probability of recapture) models in MARK program (White & Burnham Citation1999) were used to estimate closed population sizes. We set three candidate models with varying assumptions of capture probability. The models consisted of M0 (constant p), Mt (varying p over time), and Mb (varying behavioral response). Selecting a single model tends to be problematic in a closed population when the parameter is in the multinomial coefficient (White & Burnham Citation1999). Thus, we estimated population size by computing model averages and calculated densities by dividing the population size by the study area extent.
REM
For the REM, we generated 20 and 34 points randomly using ArcGIS version 10. 5 (ESRI Inc., USA) in Seoul and Geochang, respectively. A total of 54 Spypoint solar trail cams (Spypoint Inc., Canada) were deployed, one at each point. We installed cameras on each random point with a 1.5 m height. Cameras were set to take pictures 24 h per day with multishot mode (6 photos per detection). We checked the cameras every two months, downloaded images from the SD memory cards, and changed batteries regardless of battery capacity. When the cameras did not operate, we analyzed the capture rate by excluding the number of days of failure. For an effective comparison with the other methods, we divided the survey period the same as the NICRM. Density estimates were obtained using the REM equation (Rowcliffe et al. Citation2008).
where D is the density as the number of individuals·km−2; y is the number of independent photographic events; t is the total number of camera capture dates (days); v is the average speed of wild boar movement per day (km·day−1); r and θ are the radius (as km) and angle (as radians) of the camera trap detection zone, respectively; g is the mean group size (mean number of individuals of each event). We obtained the average speed of wild boar’s parameter (v) from a study by Lee (Citation2020) that GPS-tracked 10 wild boars in Seoul. We calculated the total distance of each individual moved during tracking, divided by total tracking days, and averaged for the 10 wild boars, obtaining a mean speed of 1.2 km·day −1. We measured the detection distance and angle of a model camera by walking towards and away from the camera and across its field of view repeatedly, obtaining values of 8 m (detection distance) and 40° (angle). We recorded group size (number of individuals) when wild boars were captured as a group, and excluded the events that repeatedly captured wild boars foraging in front of cameras. We obtained the density estimates and 95% CI (confidence intervals) with 1,000 iterations using remBoot R package (Caravaggi Citation2017).
FSC
We set a total of 1,080 strip transects (100 m long and 2 m wide) for each period at each site. For effective comparisons, the periods were the same as those of the NICRM. Each transect was separated from one another by at least 20 m and evenly distributed in the study area. We counted all the feces along each transect and considered one pellet group as a single count. Because the accuracy error of the GPS machine (Garmin Montana 650, USA) was 3–5 m, we reset the transects every period. We calculated the density of each study area using the equation (Plhal et al. Citation2014), and 95% CI of the mean number of feces using the boot function in R software (R Core Team Citation2022) with 1,000 iterations.
where D is the density for the study area, MFT is the mean number of feces per each transect, DP is the decomposition period (days), DDR is the daily defecation rate (number of feces per individual·day−1), TA is the area of the transect (km2). To obtain the decomposition period, we collected 30 fresh fecal samples at each study site and placed them at the observation point located in Geochang study area, checking the days until they decomposed to the extent that they were naturally undetected by the researcher. After that, we averaged the decomposition periods of all the samples, obtaining 101 days. For the daily defecation rate of wild boars, we observed five wild boars (juveniles, n = 1; subadults, n = 2 and adults, n = 2) individually in a boar farm (at least 5 × 5 m breeding pens). We gathered information on one wild boar at a time and counted the feces for three consecutive days, clearing the feces every day. We obtained a mean daily defecation rate of 3.9 feces per individual·day−1.
Results
NICRMs
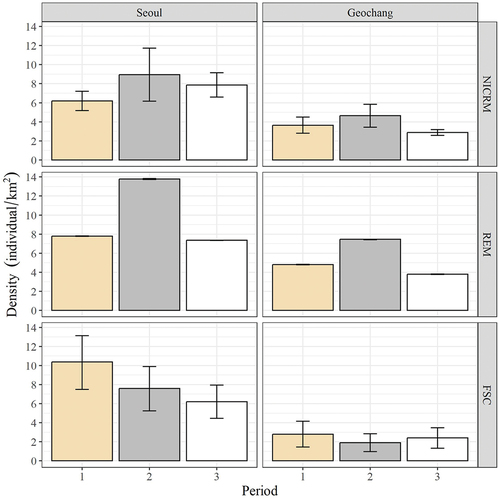
A total of 816 wild boar hairs were collected, 327 of which were successfully amplified and genotyped (Seoul, n = 173; Geochang, n = 154; ). Because the S005 marker was detected as a null allele, wild boars were identified using seven microsatellite markers. The number of alleles of the markers used in this study ranged from 2 to 9, and the means were 5.4 and 6.1 for Seoul and Geochang, respectively (). The PI and PIsibs at the two sites were lower than 0.01; thus, the identification in this study was significant () (Waits et al. Citation2001). In Periods 1, 2, and 3, the density estimates were 6.19, 8.94, and 7.87 individuals (ind.)/km2, respectively, in Seoul and 3.65, 4.64, and 2.88 ind./km2 in Geochang, respectively (). Precision of the density estimates varied between 5.43% and 11.86% ().
Table I. Number of hair samples used for the estimation of wild boar densities by period and session in Seoul and Geochang from 2017 to 2018.
Table II. Number of alleles and results of observed and expected heterogeneity in seven markers used for estimating wild boar densities at the two study sites.
Table III. Results of candidate models from non-invasive capture-recapture analysis for estimating wild boar densities at two study sites from 2017 to 2018. Mavg. represents the model average.
Figure 2. Relationship between PI (closed square and triangle lines for Seoul and Geochang, respectively) and PIsibs (open square and triangle lines for Seoul and Geochang, respectively) with the number of markers used for density estimation of wild boars. PI and PIsibs represent the probability of identity and the probability of identity of siblings, respectively.
REMs
Of the 54 cameras used in this study, four were stolen, and one was damaged due to rain during Period 2 in Geochang. Thus, 49 cameras (Seoul, n = 20; Geochang, n=29) were used to estimate wild boar densities at the two study sites. The total number of independent captured events was 558 (Seoul, n = 319; Geochang, n = 239). The density estimates were 7.80, 13.78, and 7.35 ind./km2 for Periods 1, 2, and 3 in Seoul, and 4.81, 7.45, and 3.79 ind./km2 in Geochang, respectively (). Precision of the density estimates varied between 0.35% and 0.77% ().
Table IV. The results of the random encounter model (REM) for estimating wild boar densities at the two study sites from 2017 to 2018.
FSC
In total, 1,080 transects were investigated. For Periods 1, 2, and 3, the density estimates were 10.37, 7.55, and 6.20 ind./km2 in Seoul and 2.78, 1.90, and 2.40 ind./km2 in Geochang, respectively (). Precision of the density estimates varied between 13.41% and 26.67% ().
Table V. The results of fecal standing crop (FSC) for estimating wild boar densities at the two study sites from 2017 to 2018.
Total comparisons
The density estimates in Seoul (urban site) were higher than those in Geochang (agricultural site) for all methods. The density fluctuation patterns of NICRM and REM were similar at each site; however, those of FSC were not ().
Figure 3. Total comparisons of the three indirect methods of density estimates at the two study sites. Vertical and horizontal panels represent the study sites and density estimation methods, respectively. Error bars represent 95% confidence intervals of density estimates. Note that 95% confidence intervals in REM method were too narrow to present the figure. Period 1: March–June in 2017, Period 2: September–December in 2017, Period 3: March–June in 2018.
Discussion
We compared three indirect methods for estimating the density of wild boar in two different habitats. The density estimates in Seoul (urban site) were higher than those in Geochang (agricultural site) for all methods, suggesting that all of them correctly reflected the hunting intensity assumption. However, the density fluctuation patterns differed among the three methods.
NICRM and REM generally reflected the population fluctuation assumption at both sites. According to the hunting bag statistics at the two sites, in 2017 and 2018, 98 and 49 wild boars were hunted in Seoul (Seoul Metropolitan Government, unpublished) and 768 and 575 in Geochang (Geochang County, unpublished), respectively. Although we do not have the reference density estimates at the two sites, we can assume that the population size at both sites decreased between 2017 and 2018. Nonetheless, the density trend of period 3 using NICRM in Seoul increased. One possible explanation for this phenomenon could be an overestimation due to genotyping errors. The NICRM using wild boar hairs from rubbing trees could reduce the heterogeneity of the behavior bias compared to the alternative method of collecting hairs from barbed wire, which can cause different behavioral responses by wild boars depending on age, experience, and group status (Ebert et al. Citation2009). However, non-invasive genetic sampling has potential weaknesses, such as a low success rate, contamination concerns, and high microsatellite genotyping error rates (Waits & Leberg Citation2000; Creel et al. Citation2003; Waits & Paetkau Citation2005). Genotyping errors could lead to an overestimated population size (Fickel & Hohmann Citation2006). In our study, we succeeded in only 40% of microsatellite genotyping from the total genetic analysis. Therefore, the potentially high genotyping error could have caused an overestimation of the density in Period 3 in Seoul.
The REM met both our assumptions (i.e., population fluctuation and hunting intensity); however, this method may also have the potential of overestimating densities. ENETWILD‐consortium et al. (Citation2019) contended that density estimation by REM in places where artificial feeding takes place was unreliable because of the lack of random activity patterns of behavior. Animal movement is influenced not only by food preferences but also by landscape features and a multitude of additional intrinsic and extrinsic factors; thus, a high encounter rate from biased distribution of animals can lead to the overestimation of population density (Cusack et al. Citation2015; Palencia et al. Citation2022). In fact, in our photo analysis, we had many cases that repeatedly captured wild boars foraging in front of the cameras. The detection zone could also affect the density estimates. The detection zone can vary according to deployment location due to landscape structure, which causes the results to over- or under-estimation (Palencia et al. Citation2022). We only measured the detection zone parameters for the representative model camera. Applying the detection zone value uniformly across all cameras may lead to an overestimation of population density, contributing to the cause of the narrow confidence intervals observed, and is a limitation of our study. In addition, this limitation in our study underlines the need for individualized measurement of detection zones for each camera in further studies. Our GPS tracking data came from the wild boars inhabiting Seoul, which is characterized by highly developed cities. The wild boar movement could be restricted by artificial structures, which could lead to an underestimation of day range and overestimation of densities. Massei et al. (Citation2018) suggested that deploying a minimum of nine cameras/km2 for at least 9 days was needed to obtain precise estimates of density by using REM. We ran fewer cameras than the recommendation but operated for approximately four months, which can facilitate meeting the two assumptions in this study.
The FSC reflected the hunting intensity assumption, but did not meet the population fluctuation assumption at both sites. Moreover, the density estimates were significantly different from those of the other two methods. The decomposition rate, which is an important parameter in FSC, is greatly influenced by vegetation type, air temperature, humidity, precipitation, and dung beetle activity (Massei et al. Citation1998; Laing et al. Citation2003; Plhal et al. Citation2014). Therefore, correcting and standardizing the decomposition rate is difficult when applying FSC. We recorded the decomposition rate at the observation point using the feces collected at the two study sites. The shade effect, the humidity of forests, and the rain fallen were not considered for the estimation, which may have biased our decomposition rate. The defecation rate also varies depending on diet. We tested captive individuals of different ages, which were artificially fed, and their defecation rates likely differed from those of wild boars due to differences in their diets. Despite these limitations, the defecation rate and decomposition rate used for FSC in our study were not considerably different from previous studies (Plhal et al. Citation2014; Ferretti et al. Citation2015). Deer defecate more frequently (see Ferretti et al. Citation2015 for reviews) and have non-specific spatial preferences for defecation compared to wild boars (Campbell et al. Citation2004; Alves et al. Citation2013; Soofi et al. Citation2017). However, wild boar feces are unevenly distributed owing to differences in habitat selections for forage and hiding and their highly aggregated distribution patterns (Ferretti et al. Citation2015; Fattorini & Ferretti Citation2020). For instance, Musial et al. (Citation1999) reported that defecation in pigs usually occurs during food intake, and Plhal et al. (Citation2014) found that wild boars prefer certain areas for defecation. It is therefore possible that, due to the biased feces distribution, FSC was an unreliable method for density estimation in South Korean environments.
Density estimations using NICRM and REM succeeded in reflecting population fluctuation and hunting intensity assumptions in the present study. Our findings indicate that the application of NICRM for density estimation yields more reliable results in small populations or low-density areas. In the case of using REM, accurate parameter information (i.e., daily range, detection zone, and camera placement) is required to avoid under- or overestimation. From the perspective of the survey budget, the genetic sampling method (i.e., NICRM) that needs repeated genotyping experiments for low genotyping error is a high-cost study compared to other methods. Although FSC is the most cost-effective method, its results were the least reliable under our population fluctuation assumption. Consequently, provided that parameters are accurately determined, REM may represent the most effective and reliable approach for estimating densities and conducting long-term monitoring of wild boars in various habitats in SK. From an applied perspective, wild boar density estimates from this study also suggest that effective management strategies are needed to reduce human-wild boar conflicts in SK. There were over 600 wild boar appearances in Seoul in 2016 (Seoul Metropolitan Government, unpublished). Urban areas provide anthropogenic food resources and green patches as resting areas for wild boars (Castillo-Contreras et al. Citation2018), and their population density is higher than in agricultural areas, according to our findings. Therefore, increasing hunting efforts is essential for reducing appearances in downtown areas. In contrast, density estimates in Geochang have shown low- or moderate densities compared to the previous European studies (Hebeisen et al. Citation2008; Ebert et al. Citation2012; ENETWILD‐consortium et al. Citation2019; Fattorini & Ferretti Citation2020); thus, the present level of hunting intensity should be maintained, and further, the density of wild boar will depend on the level of crop damage in agricultural areas.
The study was conducted in relatively small areas, considering the home range of wild boars, and was based on two unverified underlying assumptions, which is a limitation of our study. To address these concerns, further research involving large-scale and long-term monitoring, along with precise measurements of model parameters, is essential for ensuring accurate and effective indirect methods for estimating population size.
Author contributions
S.-M.L., E.S., and T.-Y.C.: conceptualization; S.-M.L. and E.S.: DNA experiment design; S.-M.L.: methodology, fieldwork, data curation, and writing of the original draft; S.-M.L., E.S., and T.-Y.C.: review and editing of the manuscript. All the authors have read and agreed to the published version of the manuscript.
Acknowledgments
We are grateful to the local hunters for searching the rubbing trees of wild boars.
Disclosure statement
No potential conflict of interest was reported by the author(s).
Data availability statement
The datasets used and analyzed in this study are available from the corresponding author upon reasonable request.
Additional information
Funding
References
- Acevedo P, Ruiz-Fons F, Vicente J, Reyes-García AR, Alzaga V, Gortázar C. 2008. Estimating red deer abundance in a wide range of management situations in Mediterranean habitats. Journal of Zoology 276(1):37–47. DOI: 10.1111/j.1469-7998.2008.00464.x.
- Alves J, da Silva AA, Soares AM, Fonseca C. 2013. Pellet group count methods to estimate red deer densities: Precision, potential accuracy and efficiency. Mammalian Biology 78(2):134–141. DOI: 10.1016/j.mambio.2012.08.003.
- Baber DW, Coblentz BE. 1986. Density, home range, habitat use, and reproduction in feral pigs on Santa Catalina Island. Journal of Mammalogy 67(3):512–525. DOI: 10.2307/1381283.
- Beja‐Pereira A, Oliveira R, Alves PC, Schwartz MK, Luikart G. 2009. Advancing ecological understandings through technological transformations in noninvasive genetics. Molecular Ecology Resources 9(5):1279–1301. DOI: 10.1111/j.1755-0998.2009.02699.x.
- Boitani L, Mattei L, Nonis D, Corsi F. 1994. Spatial and activity patterns of wild boars in Tuscany, Italy. Journal of Mammalogy 75(3):600–612. DOI: 10.2307/1382507.
- Cahill S, Llimona F, Gràcia J. 2003. Spacing and nocturnal activity of wild boar Sus scrofa in a Mediterranean Metropolitan park. Wildlife Biology 9(s1):3–13. DOI: 10.2981/wlb.2003.058.
- Campbell D, Swanson G, Sales J. 2004. Methodological insights: Comparing the precision and cost‐effectiveness of faecal pellet group count methods. Journal of Applied Ecology 41(6):1185–1196. DOI: 10.1111/j.0021-8901.2004.00964.x.
- Caravaggi A. 2017. remBoot: An R package for random encounter modelling. The Journal of Open Source Software 2(10):176. DOI: 10.21105/joss.00176.
- Castillo-Contreras R, Carvalho J, Serrano E, Mentaberre G, Fernández-Aguilar X, Colom A, González-Crespo C, Lavín S, López-Olvera JR. 2018. Urban wild boars prefer fragmented areas with food resources near natural corridors. Science of the Total Environment 615:282–288. DOI: 10.1016/j.scitotenv.2017.09.277.
- Choi SK 2015. Molecular genetic diversity of two Artiodactyl species: Wild boar (Sus scrofa) in Asia and long-tailed goral (Naemorhedus caudatus) in South Korea. Ph.D. Thesis, Seoul National University.
- Creel S, Spong G, Sands JL, Rotella J, Zeigle J, Joe L, Murphy KM, Smith D. 2003. Population size estimation in Yellowstone wolves with error‐prone noninvasive microsatellite genotypes. Molecular Ecology 12(7):2003–2009. DOI: 10.1046/j.1365-294X.2003.01868.x.
- Cusack JJ, Swanson A, Coulson T, Packer C, Carbone C, Dickman AJ, Kosmala M, Lintott C, Rowcliffe JM. 2015. Applying a random encounter model to estimate lion density from camera traps in Serengeti National Park, Tanzania. The Journal of Wildlife Management 79(6):1014–1021. DOI: 10.1002/jwmg.902.
- Ebert C, Huckschlag D, Schulz HK, Hohmann U. 2010. Can hair traps sample wild boar (Sus scrofa) randomly for the purpose of non-invasive population estimation? European Journal of Wildlife Research 56(4):583–590. DOI: 10.1007/s10344-009-0351-7.
- Ebert C, Knauer F, Spielberger B, Thiele B, Hohmann U. 2012. Estimating wild boar Sus scrofa population size using faecal DNA and capture-recapture modelling. Wildlife Biology 18(2):142–152. DOI: 10.2981/11-002.
- Ebert C, Kolodziej K, Schikora TF, Schulz HK, Hohmann U. 2009. Is non-invasive genetic population estimation via faeces sampling feasible for abundant mammals with low defecation rates? A pilot study on free ranging wild boar (Sus scrofa) in south-west Germany. Acta Silvatica et Lignaria Hungarica 5(1):167–177. DOI: 10.37045/aslh-2009-0014.
- Engeman R, Massei G, Sage M, Gentle MN. 2013. Monitoring wild pig populations: A review of methods. Environmental Science and Pollution Research 20(11):8077–8091. DOI: 10.1007/s11356-013-2002-5.
- Fattorini N, Ferretti F. 2020. Estimating wild boar density and rooting activity in a Mediterranean protected area. Mammalian Biology 100(3):241–251. DOI: 10.1007/s42991-020-00030-0.
- Ferretti F, Lazzeri L, Fattorini N. 2023. A test of motion‐sensitive cameras to index ungulate densities: Group size matters. The Journal of Wildlife Management 87(3):e22356. DOI: 10.1002/jwmg.22356.
- Ferretti F, Storer K, Coats J, Massei G. 2015. Temporal and spatial patterns of defecation in wild boar. Wildlife Society Bulletin 39(1):65–69. DOI: 10.1002/wsb.494.
- Fickel J, Hohmann U. 2006. A methodological approach for non-invasive sampling for population size estimates in wild boars (Sus scrofa). European Journal of Wildlife Research 52(1):28–33. DOI: 10.1007/s10344-005-0003-5.
- Fryxell JM, Sinclair AR, Caughley G. 2014. Wildlife ecology, conservation, and management. Hoboken, New Jersey: John Wiley & Sons.
- Goode MJ, Beaver JT, Muller LI, Clark JD, van Manen FT, Harper CA, Basinger PS. 2014. Capture—Recapture of white-tailed deer using DNA from fecal pellet groups. Wildlife Biology 20(5):270–278. DOI: 10.2981/wlb.00050.
- Guthery FS, Shaw JH. 2013. Density dependence: Applications in wildlife management. The Journal of Wildlife Management 77(1):33–38. DOI: 10.1002/jwmg.450.
- Han JH, Yoo DS, Park SI, Kim ET. 2022. Understanding the transmission of African swine fever in wild boars of South Korea: A simulation study for parameter estimation. Transboundary and Emerging Diseases 69(4):e1101–e1112. DOI: 10.1111/tbed.14403.
- Hebeisen C, Fattebert J, Baubet E, Fischer C. 2008. Estimating wild boar (Sus scrofa) abundance and density using capture–resights in Canton of Geneva, Switzerland. European Journal of Wildlife Research 54(3):391–401. DOI: 10.1007/s10344-007-0156-5.
- Henschel P, Ray J. 2003. Leopards in African Rainforests-Survey and Monitoring Techniques. New York: Wildlife Conservation Society.
- ISAG/FAO. 2004. Secondary guidelines for development of national farm animal genetic resources management plans. Measurement of domestic animal diversity (MoDAD): Recommended Microsatellite markers. Available: https://www.fao.org/3/aq569e/aq569e.pdf. Accessed May 2019 22.
- Kolodziej K, Theissinger K, Brün J, Schulz HK, Schulz R. 2012. Determination of the minimum number of microsatellite markers for individual genotyping in wild boar (Sus scrofa) using a test with close relatives. European Journal of Wildlife Research 58(3):621–628. DOI: 10.1007/s10344-011-0588-9.
- Laing SE, Buckland ST, Burn RW, Lambie D, Amphlett A. 2003. Dung and nest surveys: Estimating decay rates. Journal of Applied Ecology 40(6):1102–1111. DOI: 10.1111/j.1365-2664.2003.00861.x.
- Lee SM 2020. Diet, space use, demographics, and seed dispersal of the wild boar (Sus scrofa): Implications for management in South Korea. Ph.D. Thesis, Seoul National University.
- Lee SM. 2022. Reproductive performance and sex ratio adjustment of the wild boar (Sus scrofa) in South Korea. Scientific Reports 12(1):21774. DOI: 10.1038/s41598-022-25626-z.
- Lee SM, Lee EJ. 2019. Diet of the wild boar (Sus scrofa): Implications for management in forest-agricultural and urban environments in South Korea. PeerJ 7:e7835. DOI: 10.7717/peerj.7835.
- Massei G, Bacon P, Genov PV. 1998. Fallow deer and wild boar pellet group disappearance in a Mediterranean area. The Journal of Wildlife Management 62(3):1086–1094. DOI: 10.2307/3802561.
- Massei G, Coats J, Lambert MS, Pietravalle S, Gill R, Cowan D. 2018. Camera traps and activity signs to estimate wild boar density and derive abundance indices. Pest Management Science 74(4):853–860. DOI: 10.1002/ps.4763.
- Massei G, Genov PV. 2004. The environmental impact of wild boar. Galemys 16:135–145.
- Massei G, Kindberg J, Licoppe A, Gačić D, Šprem N, Kamler J, Baubet E, Hohmann U, Monaco A, Ozoliņš J, Cellina S, Podgórski T, Fonseca C, Markov N, Pokorny B, Rosell C, Náhlik A. 2014. Wild boar populations, numbers of hunters down? A review of trends and implications for Europe. Pest Management Science 71(4):492–500. DOI: 10.1002/ps.3965.
- McDaniel GW, McKelvey KS, Squires JR, Ruggiero LF. 2000. Efficacy of lures and hair snares to detect lynx. Wildlife Society Bulletin 28(1):119–123.
- Miller CR, Joyce P, Waits LP. 2005. A new method for estimating the size of small populations from genetic mark–recapture data. Molecular Ecology 14(7):1991–2005. DOI: 10.1111/j.1365-294X.2005.02577.x.
- Musial F, Kowalski A, Enck P, Kalveram KT. 1999. A computer-controlled, long-term recording system for studying eating, drinking, and defecation behavior in miniature pigs. Physiology & Behavior 68(1–2):73–80. DOI: 10.1016/S0031-9384(99)00163-8.
- National Institute of Biological Resources. 2017. Wildlife survey. Incheon: National Institute of Biological Resources.
- Palencia P, Barroso P, Vicente J, Hofmeester TR, Ferreres J, Acevedo P. 2022. Random encounter model is a reliable method for estimating population density of multiple species using camera traps. Remote Sensing in Ecology and Conservation 8(5):670–682. DOI: 10.1002/rse2.269.
- Palomares F, Godoy JA, Píriz A, O’Brien SJ, Johnson WE. 2002. Faecal genetic analysis to determine the presence and distribution of elusive carnivores: Design and feasibility for the Iberian lynx. Molecular Ecology 11(10):2171–2182. DOI: 10.1046/j.1365-294X.2002.01608.x.
- Peakall R, Smouse PE. 2012. GenAlEx 6.5: Genetic analysis in Excel. Population genetic software for teaching and research—An update. Bioinformatics 28(19):2537–2539. DOI: 10.1093/bioinformatics/bts460.
- Pfeffer SE, Spitzer R, Allen AM, Hofmeester TR, Ericsson G, Widemo F, Singh N, Cromsigt JPGM. 2018. Pictures or pellets? comparing camera trapping and dung counts as methods for estimating population densities of ungulates. Remote Sensing in Ecology and Conservation 4(2):173–183. DOI: 10.1002/rse2.67.
- Plhal R, Kamler J, Homolka M. 2014. Faecal pellet group counting as a promising method of wild boar population density estimation. Acta Theriologica 59(4):561–569. DOI: 10.1007/s13364-014-0194-9.
- Plhal R, Kamler J, Homolka M, Drimaj J. 2014. An assessment of the applicability of dung count to estimate the wild boar population density in a forest environment. Journal of Forest Science 60(4):174–180. DOI: 10.17221/99/2013-JFS.
- Putman RJ. 1984. Facts from faeces. Mammal Review 14(2):79–97. DOI: 10.1111/j.1365-2907.1984.tb00341.x.
- R Core Team. 2022. R: A language and environment for statistical computing. Vienna, Austria: R Foundation for Statistical Computing.
- Rovero F, Marshall AR. 2009. Camera trapping photographic rate as an index of density in forest ungulates. Journal of Applied Ecology 46(5):1011–1017. DOI: 10.1111/j.1365-2664.2009.01705.x.
- Rowcliffe JM, Field J, Turvey ST, Carbone C. 2008. Estimating animal density using camera traps without the need for individual recognition. Journal of Applied Ecology 45(4):1228–1236. DOI: 10.1111/j.1365-2664.2008.01473.x.
- Silveira L, Jácomo AT, Diniz-Filho JAF. 2003. Camera trap, line transect census and track surveys: A comparative evaluation. Biological Conservation 114(3):114 351–355. DOI: 10.1016/S0006-3207(03)00063-6.
- Solberg KH, Bellemain E, Drageset OM, Taberlet P, Swenson JE. 2006. An evaluation of field and non-invasive genetic methods to estimate brown bear (Ursus arctos) population size. Biological Conservation 128(2):128 158–168. DOI: 10.1016/j.biocon.2005.09.025.
- Soofi M, Ghoddousi A, Hamidi AKH, Ghasemi B, Egli L, Voinopol-Sassu A, Kiabi BH, Balkenhol N, Khorozyan I, Waltert M. 2017. Precision and reliability of indirect population assessments for the Caspian red deer Cervus elaphus maral. Wildlife Biology 2017(1):1–8. DOI: 10.2981/wlb.00230.
- Trolle M, Kéry M. 2003. Estimation of ocelot density in the Pantanal using capture–recapture analysis of camera-trapping data. Journal of Mammalogy 84(2):607–614. DOI: 10.1644/1545-1542(2003)084<0607:EOODIT>2.0.CO;2.
- Van Oosterhout C, Hutchinson WF, Wills DPM, Shipley P. 2004. micro-checker software for identifying and correcting genotyping errors in microsatellite data. Molecular Ecology Notes 4(3):535–538. DOI: 10.1111/j.1471-8286.2004.00684.x.
- ENETWILD‐consortium, Vicente J, Palencia P, Plhal R, Blanco‐Aguiar JA, Laguna E, Soriguer R, López JF, Podgórski T, Petrović K, Apollonio M. 2019. Harmonization of the use of hunting statistics for wild boar density estimation in different study areas: Report based on comparison of case studies in different wild boar populations representative of the different management and habitat conditions across Europe. EFSA Supporting Publications 16:1706E.
- Waits JL, Leberg PL. 2000. Biases associated with population estimation using molecular tagging. Animal Conservation 3(3):191–200. DOI: 10.1111/j.1469-1795.2000.tb00103.x.
- Waits LP, Luikart G, Taberlet P. 2001. Estimating the probability of identity among genotypes in natural populations: Cautions and guidelines. Molecular Ecology 10(1):249–256. DOI: 10.1046/j.1365-294X.2001.01185.x.
- Waits LP, Paetkau D. 2005. Noninvasive genetic sampling tools for wildlife biologists: A review of applications and recommendations for accurate data collection. The Journal of Wildlife Management 69(4):1419–1433. DOI: 10.2193/0022-541X(2005)69[1419:NGSTFW]2.0.CO;2.
- White GC. 1982. Capture-recapture and removal methods for sampling closed populations. Los Alamos, New Mexico: Los Alamos National Laboratory.
- White GC, Burnham KP. 1999. Program MARK: Survival estimation from populations of marked animals. Bird Study 46(sup1):120–138. DOI: 10.1080/00063659909477239.
- Willberg MJ, Dreher BP. 2004. genecap a program for analysis of multilocus genotype data for non-invasive sampling and capture-recapture population estimation. Molecular Ecology Notes 4(4):783–785. DOI: 10.1111/j.1471-8286.2004.00797.x.
Appendix
Table AI. Summary information of the eight microsatellite markers used for density estimation of wild boars from the 2017-2018 survey in South Korea.