
ABSTRACT
Imbalanced datasets play an important role in many fields in real applications such as medical diagnosis, business risk management, abnormal product testing and evaluation. In these cases, the minority classes are usually important. Granular computing has been developed and effectively applied to many problems especially imbalanced data classification. In this paper, we propose a new strategy to build information granulations (IGs) for each class separately and represent sub-attributes based on categorical values (including discretized values of the numerical attributes) to solve the overlapping among IGs. This strategy reduces the computational time, improves classification performance and considers high-balanced accuracy among classes. The experimental results on several datasets have demonstrated the effectiveness of our proposal.
Introduction
In imbalanced datasets, a class can be represented with a large number of samples while the others are represented with a few samples (Su, Chen, & Yih, Citation2006). Traditional classification methods are not suitable to handle the imbalanced dataset (Batista, Prati, & Monard, Citation2004) because they often classify the data into the majority classes (Chen, Chen, Hsu, & Zeng, Citation2008). Therefore, these algorithms often have high accuracy for the majority classes, but give low accuracy for minority classes (Chen et al., Citation2008).
There are many challenges in imbalanced data classification (Ahmad & Dey, Citation2007) including (1) the size of the dataset; (2) the overlapping and the importance in imbalance region and (3) the dataset shift problem and its relation to the classification of imbalanced datasets (Fernández, García, & Herrera, Citation2011; Galar, Fernandez, Barrenechea, Bustince, & Herrera, Citation2012).
Many algorithms were proposed to solve the problem of classification in imbalanced data. They are classified into two major groups:
Data level (external) techniques add a pre-processing step where the data distribution is rebalanced in order to decrease the effect of the skewed class distribution in the learning process (Galar et al., Citation2012).
Algorithm level (internal) approaches create or modify existing algorithms to take into account the significance of minority examples (Galar et al., Citation2012). A recently emerging approach is use of information granulation. It tries to establish higher level concepts via the construction of information granules (López, Fernández, Moreno-Torres, & Herrera, Citation2012).
Su et al. applied GrC to the cellular phone test process (Su, Chen, & Chiang, Citation2006) and proposed the KAIG model (Su, Chen, & Yih, Citation2006) which effectively solved classification problems with imbalanced data. Fuzzy ART (adaptive resonance theory) was applied to build the IGs and the two following indexes Purity and Centrality were used to measure the particle information (Su, Chen, & Chiang, Citation2006) or H-index and U-ratio were employed to determine the appropriate level of granularity (Su, Chen, & Yih, Citation2006). They used the concept of ‘sub-attributes’ to represent the IGs for solving the overlapping between the IGs. Then, three methods including decision tree, rough sets and neural networks (BP) were applied to select features to extract knowledge from the IGs for classification target (Su, Chen, & Yih, Citation2006).
Chen et al. (Citation2008) proposed a model solving the problem of imbalanced data classification including three steps:
IG construction.
IG representation
Knowledge acquisition from the IGs.
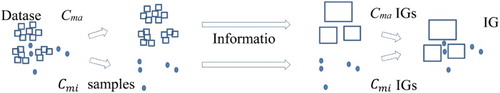
In addition, Chen et al. (Citation2008) also proposed a strategy (as shown in ) to build the IGs for datasets with high-bias class distribution (the number of minority class samples is less 10% than the number of the samples of the whole of dataset). For the strategy of building IGs from majority class (Cma) samples and retain minority class (Cmi) samples, each sample is considered as an IG (Chen et al., Citation2008). In , the small squares represent the majority class samples, the ellipses represent the minority class samples, the big rectangles represent the IGs created from majority class samples.
Figure 1. IG construction strategy from majority class samples, minority class samples are preserved (Chen et al., Citation2008).
In the above GrC approaches, they have used the indexes H-index and U-ratio (Su, Chen, & Yih, Citation2006) or Purity and Centrality (Su, Chen, & Chiang, Citation2006) as well as setting up optimal thresholds which depend on the dataset (the distribution of values in the dataset). Moreover, the IG construction strategy from the majority class samples (Chen et al., Citation2008) could not be applied to datasets with the large number of samples, although the number of minority class samples is 10% less than the number of samples in the whole dataset. In fact, if the number of IGs highly increases, classification performance will be affected. For example, a dataset consisting of 2000 records with class 0 having 200 samples (10%) and class 1 having 1800 samples (90%) will create more than 200 IGs that decreases classifier performance.
In this study, we improved Chen’s IGs construction strategy (Chen et al., Citation2008) by constructing IGs for each class, without homogeneity and indistinguishable checking (do not calculate H-index, U-ratio) to reduce computational time. Besides, we apply the equal-interval binning technique (Witten & Frank, Citation2000) to continuous values discretization. In addition, to represent IG in the form of sub-attributes, we consider only the appearance of the categorical values (including discrete values for continuous attributes) in each IG, this leads to significantly reduced computational time.
In the remaining of this paper, we introduce some basic concepts and review GrC models, especially the model of Chen et al. (Citation2008). Then we propose our new strategy. We also present our experimental results and discuss conclusion and some future works.
Basic concepts
Standardization of numeric data
All numeric attributes are normalized to be considered on the same scale by normalizing to a fixed range, from zero to one; or standardizing a statistical variable and resulting in a set of values whose mean is zero and standard deviation is one (Witten & Frank, Citation2000). We use the first technique to standardize the data in this work.
Data discretization
Some real datasets, which have many attributes with different data types, can be classified into two types: continuous data (numeric data) and discrete data (categorical or nominal data) or mixed data (combined the above two types). To handle datasets containing mixed attributes, there are numerous discrete techniques discussed by Witten and Frank (Citation2000) including equal-interval binning, equal-frequency binning, entropy-based, etc. Discretization process leads to loss of information (Ahmad & Dey, Citation2007; Witten & Frank, Citation2000); however, it is consistent with the GrC model. In this study, we use the equal-interval binning technique (Witten & Frank, Citation2000) for numeric attributes discretization. This technique is not only applied for IG construction by using mixed K-means (Ahmad & Dey, Citation2007), but also is used to represent the sub-attributes to deal with overlapping between the IGs.
Latent semantic indexing
The dataset including many features often containing sparse information can reduce the performance of the classifier. Feature selection and feature extraction techniques are used individually or in combination to reduce the dimensionality of the feature space (Chen et al., Citation2008). LSI is one features extraction technique which has been proposed combining with ‘Information granulation’ to solve the imbalance class problem, reduce the number of sub-attributes, shorten implementation time and increase the efficiency of classifier performance (Chen et al., Citation2008).
Concepts of singular value decomposition (SVD) and LSI are summarized in Deerwester, Dumais, Landauer, Furnas, and Harshman (Citation1990). The singular value decomposition of A expresses A = USVT, where S = diag, U =
, UUT = I and VT =
T, VVT = I. Then Ak = UkSkVkT, matrix of rank k (k is the suitable dimension of the low-dimensional space, should be small enough to quickly retrieve and large enough to adequately capture the structure of the corpus (Chen et al., Citation2008; Deerwester et al., Citation1990)), is the approximation of A.
Granular computing
When describing the problem, we tend to avoid numbers and use combinations to find out alternative questions (Chen et al., Citation2008). This is especially true when the problem includes incomplete, uncertain or vague information. Zadeh (Citation1979) coined the term ‘information granulation’ and stressed that the plethora of detailed knowledge is not necessary (Chen et al., Citation2008; Su, Chen, & Yih, Citation2006). The IG construction process is considered as information split which groups elements together based on their distinguish ability, similarity, proximity or their functionality. It is regarded as clustering (Batista et al., Citation2004). People always give the same decision with the same conditions. The granules are generated by the similarity of objects, so the objects in the same granule have the same class (Su, Chen, & Yih, Citation2006).
The summarized four reasons/situations why we need to process perception-based information have been presented in Zadeh (Citation2005).
Researchers paid much attention on uncertainty/ambiguity of human decisions, such as fuzzy sets, rough sets, GrC, etc. (Chen et al., Citation2008). There are many works that have used GrC to solve the imbalanced data classification problem such as those mentioned in Su, Chen, & Yih (Citation2006), Kaburlasos (Citation2007), Chen et al. (Citation2008), Fernández, Jesus, and Herrera (Citation2009), and López et al. (Citation2012). Chen et al. (Citation2008) provided a general model for knowledge discovery from the IGs which consists of three steps: IG construction, IG representation and knowledge acquisition. According to this model, different strategies can be used for each step to achieve optimal classification performance. In our work, we use three steps of this model to classify imbalanced data, propose a new strategy for IG construction and a strategy to represent the IGs in the form of sub-attributes. Detail of the three-step model is as follows.
IG construction
IGs exist with different levels of granularity, so we often group the granules with similar ‘size’ (that is granularity) in a single level. The more detailed process is required, the smaller IGs are selected (Su, Chen, & Yih, Citation2006). By changing granularity, we can discover or hide less or more details (Chen et al., Citation2008). Many IG construction methods have been proposed to construct IGs such as Self Organizing Map (SOM) network, Fuzzy C-means (FCM), rough sets, shadowed sets, Fuzzy ART (Kaburlasos, Citation2007; Su, Chen, & Chiang, Citation2006) and K-means (Chen et al., Citation2008). Su, Chen, and Chiang (Citation2006) used the Fuzzy ART network to construct the IGs and proposed H-index, U-ratio; Purity index and Centrality index to measure the appropriate level of granularity. Kaburlasos (Citation2007) proposed a method that uses Fuzzy ART to select a level of granularity (López et al., Citation2012). Chen et al. (Citation2008) used K-means (an unsupervised, simple and the most widely used clustering algorithm) combined with two indexes H-index and U-ratio to construct IGs. Besides, Chen et al. also proposed a strategy which constructs IGs in high-skewed situation. Fernández et al. (Citation2009) proposed the application of a thicker granularity to generate the initial rule base and to reinforce those problem subspaces.
IG representation
An IG often contains more than one object. The upper limit and lower limit of the values of attributes are used to represent all objects in an IG. However, overlapping problem always appears in the IGs. They are difficult to be handled by traditional data mining algorithms, because such algorithms are not designed to handle IGs, especially when the overlapping situation appeared. The concept ‘sub-attributes’ has been given to solve this problem (Chen et al., Citation2008; Su, Chen, & Chiang, Citation2006; Su, Chen, & Yih, Citation2006).
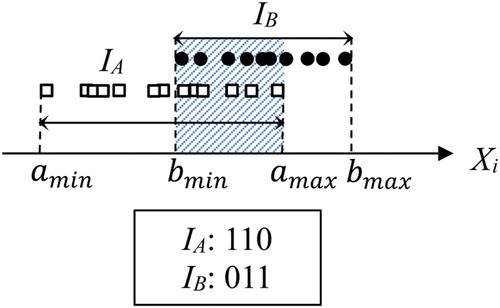
Assume the numeric attribute of the two IGs (IA and IB) as shown in . IA and IB are described by [amin, amax] and [bmin, bmax], respectively. The sub-intervals, [amin, bmin], [bmin, amax], [amax, bmax] are called sub-attributes. The binary variable which is employed to be the values of sub-attributes represents whether an IG contains these sub-intervals or not (Chen et al., Citation2008). From , it is easy to find that the input variables increased 3 times (from 1 to 3). If we have to handle continuous data, this gets worse.
Figure 2. IG description: the concept of ‘sub-attributes’ used for numeric attribute (Chen et al., Citation2008).
Many methods have been proposed to reduce the number of sub-attributes such as feature extraction, feature selection or a combination of the both. Feature selection is to select a subset of most representative features from the original feature space. One feature selection method is the rough set method that can be utilized to remove superfluous sub-attributes (Su, Chen, & Yih, Citation2006). Feature extraction is to transform the original feature space to a smaller feature space to reduce the dimensionality (Chen et al., Citation2008).
Knowledge acquisition from IGs
Researchers have applied many methods such as rough set (Su, Chen, & Chiang, Citation2006; Su, Chen, & Yih, Citation2006), decision tree (C4.5 algorithm) (Su, Chen, & Yih, Citation2006) and neural networks (Chen et al., Citation2008; Su, Chen, & Chiang, Citation2006) to acquire knowledge.
The process of knowledge acquisition from IGs is interpreted as follows. Let A be the matrix of IGs, in the form of sub-attributes, constructed from the training set. After analysing SVD for A, we get three matrices U, S, VT with A = USVT. We have Ak ≈ A (Deerwester et al., Citation1990) after performing LSI to reduce the dimensionality of the data. Then is the final matrix of A when the feature extraction step finishes. At this time, we take Uk into the training step of neural networks. Let B be the test set which is represented in the form of sub-attributes.
is the result matrix of B and then Wk are taken into the neural networks to determine output values.
Proposed method
Strategy for constructing IGs separated by class
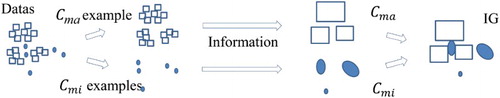
Based on the strategy proposed by Chen et al. (Citation2008), we propose our new strategy that can be applied to datasets with ratio of any class distribution. Note that samples which belong to different classes are separated into sub-datasets. Each sub-dataset corresponds to each class. Thus, we apply a clustering strategy to the each data subset. Depending on the dataset, the number of minority samples and the sample distribution of these classes, we build the number of IGs for each class. illustrates clearly the idea of this strategy. In the figure, small squares represent samples in majority class; small ellipses represent minority class samples; big rectangles represent IGs of the majority class and big ellipses represent minority class IGs. If the number of records of a class is small, the number of IGs constructed for this class will be the number of samples of the class. It is exactly similar to the strategy proposed by Chen et al.
Figure 3. IG construction strategy from sub-dataset corresponds to each class separately.
The dataset is separated at the beginning before IG construction (clustering). Thus, in the IG construction strategy, we do not need to test the homogeneous and indistinguishable IGs (i.e. we do not calculate the H-index and U-ratio and set their thresholds as in Chen’s approach). This strategy leads to computational time reduction.
Sub-attributes representation
In this study, we propose a specific strategy and explain clearly the representation of the IGs in the form of sub-attributes after discretizing numeric values (if exist) instead of that was mentioned by Chen et al. (Citation2008). Numeric attributes are discretized into Se equal-intervals for the whole input dataset. Its aim is to cover the entire range of values of each attribute of the whole dataset.
As mentioned before, to resolve the overlap between IGs, we need to represent IGs in form of sub-attributes (). If number of the IGs is large, it needs a lot of bits to represent the sub-attributes. Suppose there are 30 IGs, the number of bits represented in the worst case is bits. This can be handled through a strategy as in (a), the sub-attributes will be little bits representation (constant, for example, Se = 10). According to this strategy, the IG IA is represented by 1 from position
to
(
,
are discretized values of amin, bmin in correspondingly), the remaining positions are represented by 0; the IG IB is represented similarly to IG IA. For a categorical attribute as Xj in (b), the positions corresponding to categorical values appearing in the IG IC are represented by 1, the remaining positions will be 0; the IG ID is represented similar to the IG IC. This strategy has the following advantages:
Reduces the computational time because we only use discretized and categorical values for IG representation in the form of sub-attributes without considering overlapping intervals between IGs.
Reduces (fix) the number of bits for sub-attributes because the number of split intervals for numeric attributes discretization and number of distinct values of categorical attributes are fixed.
Figure 4. IG description: the concept of ‘sub-attributes’ (a) using for discretization of numeric attributes (number of discretized values is 10) and (b) for discrete attributes Xj (8 distinct values).
Algorithm
Notice that in order to compare with the method proposed by Chen et al. (Citation2008), we use K-means to construct IGs, LSI to reduce sub-attributes and neural networks for classifying task.
Generally, this algorithm has the following steps. First, we split the whole dataset into sub-dataset for each class and determine the number of IGs corresponding to each class. Then, K-means is implemented for IG construction. After that, we represent IGs in form of sub-attributes, implement SVD. And then, we use LSI for feature extraction (KLSI increasing from the number of dataset attributes to the number of dataset attributes + 9). Finally, we use neural networks for classifying task and evaluate the accuracy of learned classifier for KLSI. Optimal KLSI corresponds to the max G-means value.
Particularly, our algorithm includes the following steps:
Step 1: Split the training dataset after numeric data discretization (if exist) into sub-datasets. Each sub-dataset corresponds to each class.
Step 2: Determine the number of IGs for the each class; each class has a number of different IGs.
Step 3: Implement K-means for each sub-dataset.
Step 4: Represent the original attributes of training dataset in form of sub-attributes after numeric data discretization, then create a matrix A.
Step 5: Implement SVD for matrix A.
Step 6: Assign KLSI = number of dataset features (attributes).
Step 7: Extract features using LSI with KLSI.
Step 8: Learn Neural networks from training set, calculate classification accuracy for test set.
Step 9: Determine the optimal accuracy corresponding to the largest G-mean.
If KLSI is less than the number of attributes + 10 then increase KLSI of 1 and repeat steps 7–9, otherwise, go to step 10.
Step 10: Terminate procedure with the optimal KLSI.
Table 1. An IG for versicolor class of iris dataset, discretized values with Se = 5.
Table 2. The ranges of values of IG’s discretized attributes and sub-attributes representation correspondingly.
Matrix A is created from all sub-attributes of all IGs. Each row is an IG in the form of sub-attributes. The number of rows is the number of IGs, the number of columns is bits, where Nr is number of numeric attributes (in this example). Then we perform SVD to analyse the matrix A and implement LSI with KLSI = 4 (number of attributes). Finally, we implement the training process of neural networks.
One test sample has the value such as (5.7, 2.8, 4.5, 1.3, versicolor) corresponding to the standardized value (0.388889, 0.333333, 0.59322, 0.5) and the discretized values denoted as (b, b, c, c). Sub-attributes of this sample are 01000 01000 00100 00100. Then these sub-attributes will be extracted to reduce the number of features being taken into the learned neural networks to determine the output value. If the output for this sample is 0.9, rounded to 1.0 (i.e. versicolor) is regarded as the test sample that is identified (classified) rightly. The value |outputclass| = |0.9
1| = 0.1 is the classification error for this sample.
Repeat Steps 7–9, KLSI increases 1 (from 4 to 13) to find the optimal accuracy.
Experiments
We use K-means to construct the IGs for numerical homogeneous, SVD and neural networks; it is obtained from the open source library ALGLIB (alglib.net website). For datasets with mixed data types, we use the algorithm proposed by Ahmad and Dey (Citation2007).
Implementation environment
The configuration the testing platform is as follows: Windows 7, 4G RAM, Intel(R) Core™ i3-2310M and Visual Studio C++ 2008.
Datasets
Six experimental datasets are taken from the UCI Machine Learning Repository website http://archive.ics.uci.edu/ml/datasets.html.
The first four datasets, including Credit screening, Contraceptive, Wine and Pima, were used for classifying imbalanced data of Chen et al. (Citation2008); we also use them for comparison purposes. For the purpose of validation, we use extra datasets including Heart and Vote. shows the information of experimental datasets. We remove missing data from these datasets because LSI cannot work with missing data. We also use 10-fold cross validation to compute the accuracy.
Table 3. Details of the experimental datasets.
Evaluation measures
As mentioned above, performance of the classifier on test set of imbalanced datasets cannot be evaluated by the Overall Accuracy. For imbalanced datasets, high Overall Accuracy may be invalid if the precision of the minority class is very low. Therefore, to evaluate the performance of the classifier, we use the Overall Accuracy, Accuracy Negative, Positive Accuracy and G-mean as used in the publication of Batista et al. (Citation2004) and Chen et al. (Citation2008).
Geometric mean (G-mean) of the Positive Accuracy and Negative Accuracy:
Experimental results
For each class in training set, samples are clustered using K-means repeated 10 times to select the optimal KK -means corresponding to the clustering result which has the lowest error. We use LSI for set of IGs which have just been constructed after representation in form of sub-attributes, with KLSI increasing from the number of attributes of dataset to the number of attributes plus 10. Optimal KLSI is selected corresponding to the classification result (using neural networks) which has the highest accuracy. Each training set has different optimal KLSI and different optimal KK -means for each class. Therefore, we do not give KK -means and KLSI specifically.
In addition, parameters of the algorithm, which were proposed by Chen et al. (Citation2008), were not published specifically, so we try to implement this algorithm with different parameters to find out the highest accuracy.
Parameters are given in such as the network structure, iterations for NN, the number of intervals for the discretizing process called Se are used in our implementation for both algorithms and H-index and U-ratio thresholds are employed for Chen’s algorithm. We do not use the H-index and U-ratio in our algorithm.
Table 4. The experimental parameters for each dataset in Chen’s approach and our algorithm.
As mentioned initially, the minority class is often important, so for each dataset, we compare the accuracy of each class. illustrates this comparison. We do not care about the number of sub-attributes because the number of sub-attributes is different in different training sets for finding the optimal accuracy. The number of bits used to represent IGs in the form of sub-attributes is calculated using the formula Se , where
is the number of attributes,
is the number of categorical attributes, Se is the number of discretized intervals and
is the number of distinct values of each categorical attribute.
Table 5. Experimental results with accuracy for each class, overall accuracy, G-mean and mean squared error (MSE).
The table shows the accuracy comparison between our and Chen’s algorithm. Our method has higher accuracy for each class especially for minority class, higher overall accuracy for some datasets and lower for the some other datasets. First, on the Heart, Vote, Credit screening datasets, the accuracy for each class is higher and on other datasets, the accuracy for minority class is also higher. Second, the first three datasets have higher overall accuracy, the others are lower. Furthermore, G-mean in our method is always higher. This shows that the accuracy of each class in our method is more balanced. On average, our method’s overall accuracy, G-mean, accuracy for each class are higher (increase of 0.35%, 5.47%, 4.2%, respectively).
For the Contraceptive dataset, the overall accuracy is lower than Chen’s method, but the accuracy of two minority classes is higher. In addition, Contraceptive implemented by Chen’s method has a very low G-mean value (7.66%), so the accuracy of the classes in test sets is also very low. The experimental results showed that there are many folds (test sets) which have class accuracy equal to 0, so the G-mean average is very low. Besides, when implementing the algorithm proposed by Chen et al. (Citation2008), we obtain 5.73% higher accuracy for Contraceptive in comparison with the one reported by Chen et al. (Citation2008). This confirms that our discretization and IG representation in form of sub-attributes strategies are consistent with this dataset.
shows the average of computational time between our and Chen’s method. The computational time for each dataset by using our method is lower than Chen’s approach because our method does not calculate the H-index, U-ratio and does not check their thresholds. Besides, the equal-intervals binning discretization technique for numeric attributes used for IG representation in the form of sub-attributes also helps to reduce running time. However, for some datasets such as Credit approval, Contraceptive, Pima, the computational time of Chen’s method in this study is slower than that of approach reported by Chen et al. (Citation2008). This is because the mixture K-means algorithm (Ahmad & Dey, Citation2007) in our implementation has more computations when the number of constructed IGs is large.
Table 6. The computational time.
Conclusion and future work
Our proposed strategies improve the IG construction for each class and sub-attributes representation, leading to the result of reducing computational time. In particular, we do not calculate H-index and U-ratio (i.e. we do not calculate and test the homogeneous and handle indistinguishable IGs). Besides, we take the discretized values (for numeric attributes) into the sub-attributes representation without considering overlap between the IGs. However, our method has disadvantages. First, the min and the max of each attribute domain for each IG are discretized into the more or less min and max, which influences the training and test process. Second, we use K-means to construct the IGs, so we have to determine the number of IGs before executing K-means.
The experimental results confirm that our proposal improves the classification performance for the imbalanced data classification problem. The accuracy between classes is balanced because we choose the maximum G-means. We try to implement the algorithm proposed by Chen et al. (Citation2008) with the different parameters and our discretization strategy, so it does not report the results correctly as in Chen’s publication. In the future, we will study more other IG construction strategies and imbalanced data classification methods.
Disclosure statement
No potential conflict of interest was reported by the authors.
Notes on contributors
Lai Duc Anh received his Master’s degree in Computer Science from the University of Science, Vietnam National University of Ho Chi Minh, Viet Nam in 2015. His research interests include association rules, classification.
Bay Vo received his PhD degree in Computer Science from the University of Science, Vietnam National University of Ho Chi Minh, Viet Nam in 2011. His research interests include association rules, classification, mining in incremental database, distributed databases and privacy preserving in data mining.
Witold Pedrycz is Professor and Canada Research Chair (CRC) in Computational Intelligence in the Department of Electrical and Computer Engineering, University of Alberta, Edmonton, Canada. He is also with the Systems Research Institute of the Polish Academy of Sciences, Warsaw, Poland. He holds an appointment of special professorship in the School of Computer Science, University of Nottingham, UK. In 2009 Dr. Pedrycz was elected a foreign member of the Polish Academy of Sciences. In 2012 he was elected a Fellow of the Royal Society of Canada. Witold Pedrycz has been a member of numerous program committees of IEEE conferences in the area of fuzzy sets and neurocomputing. In 2007 he received a prestigious Norbert Wiener award from the IEEE Systems, Man, and Cybernetics Council. He is a recipient of the IEEE Canada Computer Engineering Medal 2008. In 2009 he received a Cajastur Prize for Soft Computing from the European Centre for Soft Computing for “pioneering and multifaceted contributions to Granular Computing”. In 2013 he was awarded a Killam Prize. In the same year he received a Fuzzy Pioneer Award 2013 from the IEEE Computational Intelligence Society. His main research directions involve Computational Intelligence, fuzzy modeling and Granular Computing, knowledge discovery and data mining, fuzzy control, pattern recognition, knowledge-based neural networks, relational computing, and Software Engineering. He has published numerous papers in this area. He is also an author of 15 research monographs covering various aspects of Computational Intelligence, data mining, and Software Engineering.
References
- Ahmad, A., & Dey, L. (2007). A k-mean clustering algorithm for mixed numeric and categorical data. Data & Knowledge Engineering, 63(2), 503–527. doi: 10.1016/j.datak.2007.03.016
- Batista, G., Prati, R. C., & Monard, M. C. (2004). A study of the behavior of several methods for balancing machine learning training data. ACM SIGKDD Explorations Newsletter, 6(1), 20–29. doi: 10.1145/1007730.1007735
- Chen, M.-C., Chen, L.-S., Hsu, C.-C., & Zeng, W.-R. (2008). An information granulation based data mining approach for classifying imbalanced data. Information Sciences, 178(16), 3214–3227. doi: 10.1016/j.ins.2008.03.018
- Deerwester, S., Dumais, S. T., Landauer, T. K., Furnas, G. W., & Harshman, R. A. (1990) Indexing by latent semantic analysis. Journal of the Society for Information Science, 41, 391–407. doi: 10.1002/(SICI)1097-4571(199009)41:6<391::AID-ASI1>3.0.CO;2-9
- Fernández, A., García, S., & Herrera, F. (2011). Addressing the classification with imbalanced data: Open problems and new challenges on class distribution. Hybrid Artificial Intelligent Systems. Lecture Notes in Computer Science, 6678, 1–10. doi: 10.1007/978-3-642-21219-2_1
- Fernández, A., Jesus, M. J. D., & Herrera, F. (2009). Hierarchical fuzzy rule based classification systems with genetic rule selection for imbalanced data-sets. International Journal of Approximate Reasoning, 50(3), 561–577. doi: 10.1016/j.ijar.2008.11.004
- Galar, M., Fernandez, A., Barrenechea, E., Bustince, H., & Herrera, F. (2012). A review on ensembles for the class imbalance problem: Bagging-, boosting-, and hybrid-based approaches. IEEE Transactions on Systems, Man, and Cybernetics, Part C: Applications and Reviews, 42(4), 463–484. doi: 10.1109/TSMCC.2011.2161285
- Kaburlasos, V. G. (2007). Granular enhancement of fuzzy art/som neural classifiers based on lattice theory. Computational Intelligence Based on Lattice Theory, 67, 3–23. doi: 10.1007/978-3-540-72687-6_1
- López, V., Fernández, A., Moreno-Torres, J. G., & Herrera, F. (2012). Analysis of preprocessing vs. cost-sensitive learning for imbalanced classification. Open problems on intrinsic data characteristics. Expert Systems with Applications, 39(7), 6585–6608. doi: 10.1016/j.eswa.2011.12.043
- Su, C.-T., Chen, L.-S., & Chiang, T.-L. (2006). A neural network based information granulation approach to shorten the cellular phone test process. Computers in Industry, 57, 412–423. doi: 10.1016/j.compind.2006.01.001
- Su, C.-T., Chen, L.-S., & Yih, Y. (2006). Knowledge acquisition through information granulation for imbalanced data. Expert Systems with Applications, 31(3), 531–541. doi: 10.1016/j.eswa.2005.09.082
- Witten, H. I., & Frank, E. (2000). Data mining practical machine learning tools and techniques with java implementation. San Francisco, CA: Morgan Kaufmann.
- Zadeh, L. A. (2005). From computing with numbers to computing with words – from manipulation of measurements to manipulation of perceptions. Logic, Thought and Action, 2, 507–544.
- Zadeh, L. A. (1979). Fuzzy sets and information granularity. In M. Gupta, R. K. Ragade, & R. R. Yager (Eds.), Advances in fuzzy set theory and applications (pp. 3–18), Amsterdam: North-Holland Publishing.