
ABSTRACT
The first step in the analysis of high-throughput experiment results is often to identify genes or proteins with certain characteristics, such as genes being differentially expressed (DE). To gain more insights into the underlying biology, functional enrichment analysis is then conducted to provide functional interpretation for the identified genes or proteins. The hypergeometric P value has been widely used to investigate whether genes from predefined functional terms, e.g., Reactome, are enriched in the DE genes. The hypergeometric P value has several limitations: (1) computed independently for each term, thus neglecting biological dependence; (2) subject to a size constraint that leads to the tendency of selecting less-specific terms. In this paper, a Bayesian approach is proposed to overcome these limitations by incorporating the interconnected dependence structure of biological functions in the Reactome database through a CAR prior in a Bayesian hierarchical logistic model. The inference on functional enrichment is then based on posterior probabilities that are immune to the size constraint. This method can detect moderate but consistent enrichment signals and identify sets of closely related and biologically meaningful functional terms rather than isolated terms. The performance of the Bayesian method is demonstrated via a simulation study and a real data application.
1. Introduction
High-throughput experiments, such as gene expression microarrays and genome-wide RNAi screening, have become an indispensable tool in biomedical research. The first step in the analysis of the experiment results is often to identify genes with certain characteristics (e.g., genes that are differentially expressed (DE)). To gain more insights into the underlying biology, the next stage is to conduct a so-called functional enrichment analysis (FEA), which investigates whether gene sets associated with particular biological functions are statistically enriched (over-represented) in the identified group of genes. Compared to the extensive research in microarray analysis, development in FEA has been limited. In this paper, we develop a novel statistical method to utilise the knowledge of the functional characteristics of genes in FEA. Without loss of generality, we describe the proposed approach in the context of a microarray experiment identifying DE genes, with the understanding that they are applicable to any high-throughput screening that identifies lists of genes with certain expression patterns.
FEA is based on the postulate that genes involved in the same biological process would be coordinately expressed. The traditional FEA analyses individual gene sets separately and does not take into account the interrelationship among gene sets which have related biological functions. By incorporating the pathway knowledge in FEA, the proposed method can borrow information across associated gene sets to strengthen the detection of enriched signals.
In FEA, there are two typical dependence structures among biological functions: the hierarchical gene ontology structure and the interconnected pathway structure. The first structure is represented by the Gene Ontology database (http://www.geneontology.org), which provides an ontology of defined terms representing gene product properties (Gene Ontology Consortium, Citation2000). Each gene ontology (GO) term annotates a set of genes, indicating their known involvement in biological processes, molecular functions and cellular components. GO terms are structured in a directed acyclic graph (DAG) of parent–child relationship, where a child indicates a more specific biological classification than its parent(s).
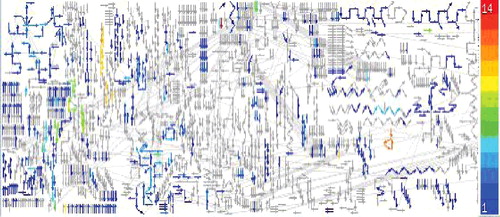
The second structure is represented by Reactome (http://www.reactome.org), which is an online bioinformatics database of human biology described in molecular terms (Vastrik et al., Citation2007). It serves as an online encyclopedia of core human pathways: DNA replication, transcription, translation, the cell cycle, metabolism and signalling cascades. The basic unit of the Reactome database is a reaction which has input and output slots that describe the reactants (input) and product (output) of a given reaction. In accomplishing a biological function, reactions are chained together by shared physical entities: an output of one reaction may be an input for another reaction and serves as the catalyst for yet another reaction. Reactome organises a set of interlinked reactions that perform a certain function in biological pathways. The ‘reaction map’ in provides part of the screenshot from the Reactome data mining tool Skypainter (Matthews et al., Citation2009). Each reaction is represented as a small arrow. The arrows are joined end to end to indicate that the output of one reaction serves as the input of the next.
Figure 1. Part of a screenshot from the output generated by Reactome Skypainter using a specific list of genes. Each arrow represents a reaction and is coloured by the number of genes involved in that reaction.
The GO annotation terms are connected by parent–child relationships defined in three categories (biological process, molecular function and cellular component). However, GO is not designed to cope with relations structured as pathways and sub-pathways. The construction of Reactome is focused on establishing a deep and robust connectivity between biological processes. To a researcher interested in a gene or protein, Reactome provides the summary of all the reactions and pathways involving the molecule. Thus, FEA using both the GO hierarchical structure and the Reactome interconnected structure can be complementary and valuable.
In FEA, the most commonly used statistical test is based on the hypergeometric distribution or its binomial approximation (Al-Shahrour, Díaz-Uriarte, & Dopazo, Citation2004; Beissbarth & Speed, Citation2004; Cho et al., Citation2001; Draghici, Khatri, Martins, Ostermeier, & Krawetz, Citation2003; Luo et al., Citation2007). A number of new methods have been proposed in FEA to deal with the GO DAG structure (Alexa, Rahnenführer, & Lengauer, Citation2006; Cao & Zhang, Citation2014; Grossmann, Bauer, Robinson, & Vingron, Citation2007; Lewin & Grieve, Citation2006; Zhang, Cao, Kong, & Scheuermann, Citation2010). Some other FEA methods proposed in recent years utilised additional biological information, such as transcriptional regulation information (Ma, Jiang, & Jiang, Citation2015) and links between individual genes (Signorelli, Vinciotti, & Wit, Citation2016). In comparison to these developments of FEA based on the GO database, there is limited development of FEA focusing on the interconnected pathway structure, like Reactome. The dominant statistical test is still the hypergeometric test. The Reactome terms do not function independently. Instead, the terms that are involved in a pathway are connected through the input–output relationships, which function together to accomplish tasks. The major drawback of the hypergeometric approach is that it ignores the interconnected structure in the Reactome database, which contains a substantial amount of information regarding the interactions among the Reactome terms.
To overcome the above limitations of the conventional hypergeometric test, we develop a Bayesian hierarchical model to incorporate the interconnected structure of the Reactome database in assessing its functional enrichment. The interconnected pathway structure is introduced by the conditional autoregressive (CAR) prior to include the correlation among linked biological reactions. The CAR prior has been used extensively in spatial modelling to account for correlation among observations from neighbouring areas (Clayton & Kaldor, Citation1987; Ghosh, Natarajan, Stroud, & Carlin, Citation1998; Waller, Carlin, Xia, & Gelfand, Citation1997). It assumes that observations at sites near each other tend to have similar values. With the incorporation of the CAR prior in the model, the Bayesian FEA can take into account the evidence not only from individual Reactome terms, but also from their related neighbouring terms. The Bayesian framework enables borrowing information across related Reactome terms to strengthen the detection of enriched signals. As a result, this method tends to identify sets of closely related Reactome terms rather than individual unrelated terms. The utility of the method is demonstrated using a simulation study and a gene expression microarray data-set from a human B cell stimulation experiment.
2. Method
2.1. The hypergeometric test
In this section, we first use a toy example to introduce the hypergeometric test and demonstrate its limitations in the context of Reactome annotations. In a high-throughput experiment, let m denote the number of genes annotated to a certain Reactome term, and let f and d denote the total numbers of genes studied and DE genes detected, respectively. The number of DE genes annotated to this Reactome term, denoted by n, indicates the representation of the Reactome term in the list of identified DE genes. The null hypothesis of the test is that the biological process denoted by the Reactome term is irrelevant to the experiment, which means that a gene being annotated by the Reactome term and this gene being classified as DE are two independent events. Theoretically, given (m,f, d), we can model n by a hypergeometric distribution under the null hypothesis, and the P value measuring the significance of enrichment is the tail probability of observing n or more DE genes annotated to the Reactome term,
(1)
We use an artificial interconnected structure () to illustrate the limitations of the hypergeometric P value. It depicts the interconnected structure of 24 terms {Rj, j = 1,… , 24}, mimicking a small region of Reactome. We use F = {a, b,… , z} to denote the full list of genes, and among them the set of 11 DE genes, denoted by D, are marked in red (i.e., f = 26 and d = 11). The DE genes are chosen such that there are three regions in : the first one covers terms R1–R9, representing a region with enriched signals; the second one covers terms R11–R18, representing a region with random signals; the third one covers terms R19–R24, representing a region with little signals. We have designed this example to examine whether the different levels of signals can be identified by the hypergeometric test and the proposed method. Note that the rectangles contain the subset of genes annotated by each Reactome term, where the hypergeometric P values based on Equation (Equation1(1) ) are marked in black under each rectangle. Taking R1 for example, it annotates m1 = 7 genes and n1 = 5 of them are DE. The hypergeometric P value is 0.085.
Figure 2. Comparison of the P value and the B value in the simulation study. The full list of genes (F) are denoted as lower case letters; the genes in the DE set D are (a, b, c, g, h, j, k, n, q, t, u). The rectangles contain the subset of genes annotated by each node, where the hypergeometric P values are listed under each rectangle, followed by the B values (The online version has a color figure).
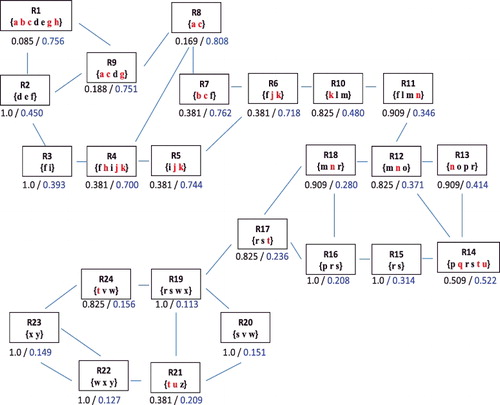
The statistical inference based on the hypergeometric test has the following limitations. First, it cannot distinguish Reactome terms with the same (mj, nj). In , two terms R7 and R21 have the same P value because they have identical (mj, nj) = (3, 2). By examining the whole graph, we consider that R7 is more likely than R21 to be linked with the DE genes because of the stronger evidence of enriched signal in R7's neighbouring terms (i.e., related biological functions). This limitation stems from the hypergeometric test in treating the Reactome terms as isolated entities and ignoring the interconnected structure. Second, the hypergeometric P value has a size constraint. For a term of size mj, the smallest possible P value is attained when all the annotated genes are DE (i.e., nj = mj). The lower bound of the P value is reversely associated with mj. For example, with (f = 26, d = 11), the hypergeometric P value is 0.022 when mj = nj = 4 and 0.063 when mj = nj = 3. Thus, if we set the significance level at 0.05, any Reactome term with a size less than 4 will be automatically excluded from the inference. From a biologist's point of view, detecting more specific functional terms, which usually have a smaller size (mj), might be more desirable because they provide more detailed information on the biological mechanism. However, the hypergeometric test tends to identify less specific terms because of the constraint. In , the most significant term selected by the P value is R1, the largest term. The more specific terms, such as R7 and R8, are considered less significant compared to R1.
2.2. A Bayesian model
The proposed method is called Reactome-Bayes: Reactome-based FEA using a Bayesian approach. In the model, each Reactome term has an enrichment parameter measuring its enrichment level with selected DE genes. The novelty of the model is that the complex interconnected structure in Reactome is incorporated via the CAR prior on the enrichment parameters. We will show that this feature of the model will overcome the above limitations of the conventional hypergeometric test,
Suppose a DE gene set D (with cardinality d) is identified out of a full list of f genes in a microarray study. Let R = {Rj, j = 1, …, J} (with cardinality {mj}) be the set of reactions in Reactome that include genes in the full list (i.e., mj > 0, for j = 1,… , J). We use gi ∈ Rj to indicate that gene i is known to be involved in Rj. We define to denote that reactions Rj and
are linked together (the output of one reaction is the input or catalyst of the other), and
otherwise. Thus, rj = ∑Jk = 1ωjk is the total number of reactions that are directly linked with reaction Rj. In the following, we use directly linked reactions or immediate neighbours exchangeably.
Let yi (i = 1,… , I) be the observed expression status of gene i, yi = 1 if gene i is in the DE gene set D and yi = 0 otherwise. The binary yi is assumed to follow a Bernoulli distribution, yi∣pi ∼ Bernoulli(pi), where pi is the probability that gene i belongs to D. Under the assumption that if Rj is associated with D, the genes annotated by Rj have a higher chance of being grouped in D, we construct the following logistic model:
(2) In Model (Equation2
(2) ), b0 = log [p0/(1 − p0)] with p0 = d/f, where p0 is the background probability that gene i is grouped in the DE gene set D by chance. The random error ei is assumed to have a normal distribution with mean 0 and variance σ2, denoted by
. We assume a vague inverse gamma prior for σ2. Parameter βj characterises the enrichment level of reaction Rj with the DE gene set D. Specifically, the odds of gene i being DE is modified by a factor of exp (βj) if gi ∈ Rj. A positive (negative) value of βj indicates over(under)-representation. We model the dependence among reactions through a CAR prior on βj. The CAR prior can be specified as the conditional distribution of βj given its immediate neighbours,
(3) where β( − j) = {βk, k ≠ j}, δ2β is the variance parameter and ρ ∈ (0, 1) is a correlation parameter that controls the extent of borrowing strength among neighbouring reactions. For example, the conditional distribution of βj is centred at the average of the enrichment parameters from the immediate neighbours when ρ = 1, and centred at zero when ρ = 0. We assume a uniform prior for ρ, ρ ∼ U(0, 1), and a vague inverse gamma prior for δ2β.
A Markov Chain Monte Carlo (MCMC) sampling algorithm is employed to simulate random samples from the joint posterior distribution. Specifically, the variance components σ2 and δ2β both have a closed-form posterior distribution. The enrichment parameter βj is log-concave, so the adaptive rejection method is implemented to sample from its posterior distribution (Gilks & Wild, Citation1992). The Metropolis–Hasting algorithm is used to draw MCMC samples for parameter ρ. We run a total of 11,000 MCMC iterations, with the first 1000 as the burn-in cycle. We have also examined the convergence by using different starting values and monitoring the ‘shrink factor’ (Gelman & Rubin, Citation1992). The inference is made based on Bj = P(βj > 0∣data), denoted as the B value, which is the posterior probability of reaction Rj being enriched in the DE gene set D. Making inferences based on posterior probabilities is a common practice in Bayesian analysis of microarray data (Do, Muller, & Tang, Citation2005; Newton, Noueiry, Sarkar, & Ahlquist, Citation2004). Note that a reaction with a larger B value indicates stronger enrichment.
We adopt the CAR prior based on two considerations. First, the direction in which the reactions are linked (i.e., the output of one reaction is the input of another reaction) is relatively trivial in FEA. The reason is that FEA is not based on sequential measurements over a single realisation of a process, but based on cross-sectional measurements (gene expressions) over many realisations involving different biological reactions or processes. Second, the CAR prior has shown its utility in various spatial data analyses. Introducing it to FEA may inspire new collaborations between the two research areas, bioinformatics and spatial statistics. More importantly, efficient sampling algorithms have been developed for Bayesian models with CAR priors (Knorr-Held & Rue, Citation2002; Rue, Citation2001; Steinsland, Citation2007). This is of particular importance in FEA due to the high dimension of high-throughput data.
We may use the B value as a screening tool to rank Reactome terms to help researchers select the ones for further investigation. To answer questions such as ‘what should be the cutoff value for B-values’, the Bayesian false discovery rate (FDR) (Do, Muller, & Tang, Citation2005; Newton et al., Citation2004; Storey, Citation2002) has been widely used to account for multiplicity in the Bayesian paradigm: , where N = ∑jγj is the number of selected Reactome terms, indicator γj = 1 if the jth term is identified as enriched (its B value ranks among the top N terms), and γj = 0 otherwise. E(FDR|data) is the posterior portion of false discoveries in the N terms which have been identified as enriched terms. For further details on Bayesian FDR, readers can refer to Muller, Parmigiani, and Rice (Citation2006).
3. Simulation study
The proposed method is compared to the hypergeometric test in the simulation study (), where the B values are listed in blue under each term. Recall that contrary to the P value, a larger B value indicates stronger enrichment of a Reactome term. There are several advantages of the B value over the traditional hypergeometric P value. First, the B value can distinguish Reactome terms with the same (mj, nj). The two terms R7 and R21, both with (mj, nj) = (3, 2), which could not be distinguished by the P value, are clearly differentiated by the B values (B7 = 0.762 and B21 = 0.209). Given the intrinsic noise in the high-throughput data collection and processing procedures, there can be errors in the detection of DE genes. Such errors affect the accuracy in the determination of nj and in turn the accuracy of the hypergeometric P value to detect enriched Reactome terms. On the other hand, neighbouring terms in Reactome represent closely related biological functions. Thus, enriched signal detected in a neighbourhood of Reactome terms is more reliable than that detected in a single term. In the example, the larger B value for R7 is attributed to the stronger evidence of enrichment from its neighbours. In contrast, the neighbouring terms of R21 are mostly under-represented in the DE gene list, leading to a much smaller B value. Second, the proposed method can mitigate the undue influence of Reactome term size. Based on the hypergeometric P value, the most enriched term is R1. Note that 71% of its annotated genes are DE (n1/m1 = 5/7 = 0.71), which is not the highest level among all the terms. However, because it is one of the largest terms (m1 = 7) in , it has the smallest P value of 0.085, even though one of its two neighbouring terms, R2, does not have any DE genes (n2 = 0). By comparison, the Bayesian method incorporates not only the enrichment evidence of an individual term but also that of the neighbouring terms. Thus, in this simulation study, the B value has identified the term R8 being the most enriched term, where 100% of its annotated genes are DE (n8/m8 = 2/2 = 1.00). More importantly, all of R8's neighbouring terms contribute supporting evidence, which is not the case for R1.
In summary, the B value tends to identify neighbourhoods of related terms where moderate but consistent signals are considered more trustworthy than strong signals from isolated terms. In addition, sharing information among neighbours can help mitigate the impact of mis-classified genes on the inference of individual terms.
4. Application
4.1. Data-set
We use a gene expression microarray data-set to demonstrate the proposed Bayesian method. In this microarray experiment, researchers evaluate the effect of three stimulus on a B cell lymphoma cell line (Ramos): the B cell antigen receptor (BCR), CD40 and a combination of the two (Basso et al., Citation2005). In this paper, for the demonstration purpose, we only consider the DE genes under one stimulus BCR. The expression data was processed using the significance analysis of microarrays (SAM) approach (Tusher, Tibshirani, & Chu, Citation2001). After the first step of the analysis, the full list contains f = 1647 genes and a cluster of d =333 genes was identified. Genes in this cluster were all upregulated in response to the BCR signalling. These treatment conditions mimic important biological responses of immature B cells (Hsueh & Scheuermann, Citation2000), where B cells need to respond by productive proliferation and differentiation into immune effector cells.
4.2. Result
The full list of 1647 genes are annotated by a total of J = 3193 Reactome terms. Suppose about 1% of all the terms can be further examined, so we compare the top 30 Reactome terms selected by the P value (denoted as the P-list) and the top 30 Reactome terms selected by the B value (denoted as the B-list).
First, we examine which method tends to identify sets of closely related GO terms instead of isolated ones. Define a Reactome-set to be a group of Reactome terms that are connected with each other through the input/output links. For example, in , if we set the threshold of B value at 0.75, then four terms are above this threshold (R1, R7, R8, R9), which form one Reactome-set. It is desirable for an approach in the enrichment analysis to identify larger Reactome-sets instead of isolated single Reactome terms because the former contains more reliable enrichment signals. compares the Reactome-sets identified by the P-list and the B-list. Compared to the P value, the B value tends to identify larger Reactome-sets. Specifically, six Reactome terms in the P-list are isolated single terms, while there are no such isolated terms in the B-list. In addition, there are only three none-single Reactome-sets (i.e., the set contains more than one Reactome term) in the P-list. By comparison, the B-list has identified five non-single Reactome-sets.
Table 1. Number of Reactome-sets identified in the P-list and the B-list.
The largest Reactome-set identified by both the P-list and the B-list contains the same biological functional units in Reactome; see . This indicates that when the enrichment signals are strong, the P value and the B value will produce similar results in FEA.
Figure 3. The largest Reactome-set identified by both the P-list and the B-list. The rectangles denote the Reactome terms, where (mj, nj) are listed under each term, under which the P value and the B value are listed respectively, followed by the rank of the term by the P value and the rank by the B value (The online version has a color figure).
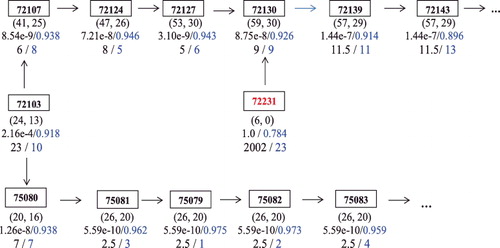
Note that in , there is one Reactome term #72231(Formation of the Cleavage and Polyadenylation Complex), which is marked in red. Different from the other terms in the figure which have similar ranks in the P-list and the B-list, its rank by the P value is 2002, and its rank by the B value is 23, which puts it in the top 30 B-list. The rank by the P value is low due to the fact that the term has nj = 0 (i.e., none of its annotated genes are DE). By comparison, with its neighbouring terms showing very strong signals of enrichment, the proposed Bayesian considers the observation of nj = 0 as a result of random error from experiment and assign a relatively higher ranking by B value.
Upon literature review, we have found substantial evidence that Reactome term #72231 is likely to be involved in regulating the proliferative state of B cells. For example, Elkon, Ugalde, and Agami (Citation2013) hypothesised that when human B cells and monocytes were stimulated, enhanced alternative cleavage and polyadenylation is linked to the proliferative state of cells. It was demonstrated that this regulated poly(A) selection is controlled during B cell maturation in part by the concentration of the polyadenylation factor cleavage stimulation factor subunit 2 (CSTF2): low CSTF2 concentrations in early stages of B cell development favour cleavage at the canonical and stronger immunoglobulin M (IgM) poly(A) site, whereas high CSTF2 levels in activated B cells induce cleavage at the weaker proximal site (Takagaki & Manley, Citation1998; Takagaki, Seipelt, Peterson, & Manley, Citation1996). Furthermore, Reactome #72231 is the preceding event of #72130 (Formation of an intermediate Spliceosomal C complex), which is ranked 9 both by the P value and the B value. It is unlikely that Reactome #72130 is involved in the experiment without the participation of #72231. Taken together, these findings suggest that the identification of Reactome term #72231 by Reactome-Bayes is biologically reasonable and it provides an example that the proposed approach was able to mitigate the impact of experimental error or random noises arising from microarray data generation or processing.
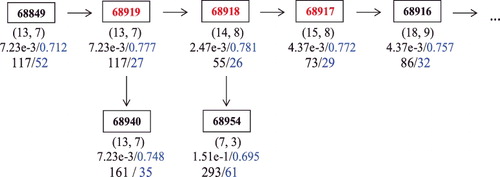
The identification of #72231 by Reactome-Bayes presents an example where a single Reactome term is missed by the traditional hypergeometric method but is identified by the Bayesian method. In , we have another example that a non-single Reactome-set (including #68917, #68918, #68919) is missed by P value, but identified by B-value. The Reactome-set contains three terms Reactome #68917 (Cdc45 associates with the pre-replicative complex at the origin), #68918 (cyclin-dependent kinases (CDK) and Dbf4-dependent kinase (DDK) associate with the Mcm10: pre-replicative complex), and #68919 (Mcm10 associates with the pre-replicative complex, stabilising Mcm2-7). plots the neighbourhood of this Reactome-set. It is noteworthy that the enrichment signal is moderate in each of the individual terms (ranked at 117, 55, 73 with P value), but they are consistent in the neighbourhood. The identification of such Reactome terms usually is more reliable because the enrichment signal is less likely to arise from random variability or error. Through literature review, we also find convincing evidence that this Reactome-set is likely to be involved in the experiment. A pre-replicative complex containing the origin recognition complex, Cdc6, Cdt1 and six mobil crystalline material (MCM) proteins (Mcm2-7), is assembled prior to the initiation of replication. It has been shown that Cdc7 and Cdk2 (cyclin dependent kinase 2) act in a sequential manner to load Cdc45 at the origin (Walter, Citation2000). Furthermore, binding of Cdc45 and then replication protein A (RPA) results in origin unwinding and binding of the primase DNA polymerase, which begins replication (Walter & Newport, Citation2000). These activities are closely related to the differentiation and proliferation of B-cell. Srinivasan, Dominguez-Sola, Wang, Hyrien, and Gautier (Citation2013) also showed that Cdc45 is a critical effector of Myc-dependent DNA replication stress, where Myc deregulation promotes the development of immature B cell neoplasias (Kovalchuk et al., Citation2000). Based on the experiment evidence, this Reactome-set does appear to be biologically associated with the DE gene set.
Figure 4. The neighbourhood of Reactome terms 68917, 68918 and 68919. The rectangles denote the Reactome terms, where (mj, nj) are listed under each term, under which the P value and the B value are listed respectively, followed by the rank of the term by the P value and the rank by the B value (The online version has a color figure).
5. Discussion
We have proposed a Bayesian approach to conduct FEA based on the Reactome annotation database, where the functional terms are connected in a input–output relationship. The novelty of the proposed method is that the model encourages sharing of evidence among related biological functions by incorporating the interconnected dependence structure of Reactome through a CAR prior. Functional enrichment of Reactome terms are measured by the B value, which can be conveniently interpreted as the posterior probability of a Reactome term being enriched given the observed data. The mechanism induced by the Bayesian model to share information among related functional terms strengthens the detection of moderate but consistent enrichment signals which can help researchers to identify sets of related terms rather than individual isolated terms. We have provided detailed comparison between the proposed approach and the conventional hypergeometric test. Our analysis using an artificial data-set and a real microarray data-set suggests that the Bayesian approach can produce more biologically meaningful results than the hypergeometric test.
Current annotation databases like Reactome are imperfect and still evolving, which means that mistakes in its annotations might adversely affect FEA. This is a challenge faced by all enrichment analysis methods. Many studies have demonstrated that although imperfect, incorporating annotation information may help researchers achieve more meaningful results. B values, like other enrichment scores or P values, should be treated as a scoring system that plays an advisory role such as ranking and suggesting possible relevant annotation terms, as opposed to an absolute, decision-making role.
The conventional hypergeometric P value only requires information on individual functional terms, and has a closed form. Reactome-Bayes, on the other hand, requires additional information on the interconnected structure of biological functions, and thus it does not have a closed form. We have developed a program in FORTRAN to implement the Bayesian FEA approach. It is in our future research plan to further develop it into a webtool.
Acknowledgment
The author would like to thank Richard Scheuermann, Megan Kong, and Song Zhang for providing the data and constructive comments on the paper.
Disclosure statement
No potential conflict of interest was reported by the author.
Additional information
Funding
Notes on contributors
Jing Cao
Jing Cao is an associate professor at the department of Statistical Science at Southern Methodist University.
References
- Alexa, A., Rahnenführer, J., & Lengauer, T. (2006). Improved scoring of functional groups from gene expression data by decorrelating GO graph structure. Bioinformatics, 22, 1600–1607.
- Al-Shahrour, F., Díaz-Uriarte, R., & Dopazo, J. (2004). FatiGO: A web tool for finding significant associations of Gene Ontology terms with groups of genes. Bioinformatics, 20, 578–580.
- Basso, K., Margolin, A. A., Stolovitzky, G., Klein, U., Dalla-Favera, R., & Califano, A. (2005). Reverse engineering of regulatory networks in human B cells. Nature Genetics, 17, 182–190.
- Beissbarth, T., & Speed, T. P. (2004). GOstat: Find statistically overrepresented gene ontologies within a group of genes. Bioinformatics, 20, 1464–1465.
- Cao, J., & Zhang, S. (2014). A Bayesian extension of the hypergeometric test for functional enrichment analysis. Biometrics, 70(1), 84–94.
- Cho, R. J., Huang, M., Campbell, M. J., Dong, H., Steinmetz, L., Sapinoso, L., .. Lockhart, D. J. (2001). Transcriptional regulation and function during the human cell cycle. Nature Genetics, 27, 48–54.
- Clayton, D., & Kaldor, J. (1987). Empirical Bayes estimates of age-standardized relative risks for use in disease mapping. Biometrics, 43(3), 671–681.
- Do, K., Muller, P., & Tang, F. (2005). A Bayesian mixture model for differential gene expression. Applied Statistics, 54, 627–644.
- Draghici, S., Khatri, P., Martins, R. P., Ostermeier, G. C., & Krawetz, S. A. (2003). Global functional profiling of gene expression. Genomics, 81, 98–104.
- Elkon, R., Ugalde, A. P., & Agami, R. (2013). Alternative cleavage and polyadenylation: Extent, regulation and function. Nature Reviews Genetics, 14(7), 496–506.
- Gelman, A., & Rubin, D. B. (1992). Inference from iterative simulation using multiple sequences (with discussion). Statistical Science, 7, 457–511.
- Ghosh, M., Natarajan, K., Stroud, T. W. F., & Carlin, B. P. (1998). Generalized linear models for small-area estimation. Journal of the American Statistical Association, 93(441), 273–282.
- Gilks, W., & Wild, P. (1992). Adaptive rejection sampling for Gibbs sampling. Applied Statistics, 41, 337–348.
- Grossmann, S., Bauer, S., Robinson, P. N., & Vingron, M. (2007). Improved detection of overrepresentation of Gene-Ontology annotations with parent-child analysis. Bioinformatics, 23, 3024–3031.
- Hsueh, R., & Scheuermann, R. H. (2000). Tyrosine kinase activation in the growth, differentiation and death responses initiated from the B cell antigen receptor. Advances in Immunology, 75, 283–316.
- Knorr-Held, L., & Rue, H. (2002). On block updating in Markov random field models for disease mapping. Scandinavian Journal of Statistics, 29(4), 597–614.
- Kovalchuk, A. L., Qi, C. F., Torrey, T. A., Taddesse-Heath, L., Feigenbaum, L., Park, S. S., .. Morse, H. C. (2000). Burkitt lymphoma in the mouse. Journal of Experimental Medicine, 192(8), 1183–1190.
- Lewin, A. M., & Grieve, I. C. (2006). Grouping gene ontology terms to improve the assessment of gene set enrichment in microarray data. BMC Bioinformatics, 7, 426.
- Luo, F., Yang, Y., Chen, C. F., Chang, R., Zhou, J., & Scheuermann, R. H. (2007). Modular organization of protein Interaction networks. Bioinformatics, 23, 207–214.
- Ma, S., Jiang, T., & Jiang, R. (2015). Differential regulation enrichment analysis via the integration of transcriptional regulatory network and gene expression data. Bioinformatics, 31, 563–571.
- Matthews, L., Gopinath, G., Gillespie, M., Caudy, M., Croft, D., de Bono, B., ... D’Eustachio, P. (2009). Reactome knowledgebase of human biological pathways and processes. Nucleic Acids Research, 37(Suppl. 1), D619–D622.
- Muller, P., Parmigiani, G., & Rice, K. (2006). FDR and Bayesian multiple comparisons rules. Nucleic Acids Research, 37, 619–622.
- Newton, M. A., Noueiry, A., Sarkar, D., & Ahlquist, P. (2004). Detecting differential gene expression with a semiparametric hierarchical mixture method. Biostatistics, 4, 155–176.
- Rue, H. (2001). Fast sampling of gaussian Markov random fields. Journal of the Royal Statistical Society, Series B, 63(2), 325–338.
- Signorelli, M., Vinciotti, V., & Wit, E. C. (2016). NEAT: An efficient network enrichment analysis test. BMC Bioinformatics, 17, 352.
- Srinivasan, S. V., Dominguez-Sola, D., Wang, L. C., Hyrien, O., & Gautier, J. (2013). Cdc45 is a critical effector of Myc-dependent DNA replication stress. Cell Reports, 3(5), 1629–1639.
- Steinsland, I. (2007). Parallel exact sampling and evaluation of gaussian Markov random fields. Computational Statistics and Data Analysis, 51(6), 2969–2981.
- Storey, J. D. (2002). A direct approach to false discovery rate. Journal of the Royal Statistical Society, Series B, 64, 479–498.
- Takagaki, Y., & Manley, J. L. (1998). Levels of polyadenylation factor CstF-64 control IgM heavy chain mRNA accumulation and other events associated with B cell differentiation. Molecular Cell, 2(26), 761–771.
- Takagaki, Y., Seipelt, R. L., Peterson, M. L., & Manley, J. L. (1996). The polyadenylation factor CstF-64 regulates alternative processing of IgM heavy chain pre-mRNA during B cell differentiation. Cell, 87(5), 941–952.
- The Gene Ontology Consortium. (2000). Gene ontology: Tool for the unification of biology. Nature Genetics, 25, 25–29.
- Tusher, V. G., Tibshirani, R., & Chu, G. (2001). Significance analysis of microarrays applied to transcriptional responses to ionizing radiation. Proceedings of the National Academy of Sciences USA, 98(9), 5116–5121.
- Vastrik, I., D’Eustachio, P., Schmidt, E., Gopinath, G., Croft, D., de Bono, B., ... Stein, L. (2007). Reactome: A knowledge base of biologic pathways and processes. Genome Biology, 8(3), R39.
- Waller, L. A., Carlin, B. P., Xia, H., & Gelfand, A. E. (1997). Hierarchical spatiotemporal mapping of disease rates. Journal of the American Statistical Association, 92(438), 39773–39778.
- Walter, J. (2000). Evidence for sequential action of cdc7 and cdk2 protein kinases during initiation of DNA replication in Xenopus egg extracts. Journal of Biological Chemistry, 257(50), 607–617.
- Walter, J., & Newport, J. (2000). Initiation of eukaryotic DNA replication: Origin unwinding and sequential chromatin association of Cdc45, RPA, and DNA polymerase α. Molecular Cell, 5(4), 617–627.
- Zhang, S., Cao, J., Kong, Y. M., & Scheuermann, R. H. (2010). GO-Bayes: Gene Ontology-based over-representation analysis using a Bayesian approach. Bioinformatics, 26(7), 905–911.