
 ?Mathematical formulae have been encoded as MathML and are displayed in this HTML version using MathJax in order to improve their display. Uncheck the box to turn MathJax off. This feature requires Javascript. Click on a formula to zoom.
We congratulate Professor Zhengjun Zhang for a topnotch contribution to the literature and thank the editor for the invitation to participate in the discussion of the excellent review paper. Zhang (Citation2020) provides an informative summary of modelling systematic risk with nonlinear time series models and tail dependence measures based on extreme observations. In the current era, where risk management is becoming more and more important, this review paper is timely and will provide the impetus for future research in this and broader areas.
Section 5.1 in Zhang (Citation2020) proposes the autoregressive tail-index model to characterise and describe systematic risk and risk contagions. The autoregressive tail-index model is not only a good measure of systematic risk in the US stock market (Zhao et al., Citation2018), but can also be applied to the study of extreme climate (Deng et al., Citation2020) and other fields. In this discussion, we are more interested in whether the autoregressive tail-index model is also suitable to characterise the systematic risk in China's stock market. We present an analysis of the stock negative log-returns of the Shanghai Composite Index (SSE Index), which is one of the most important indexes for China's stock market. The data contains the daily closing prices of 180 components of SSE Index and is downloaded from Wind-Financial Terminal from 01/05/2005 to 10/20/2020 with 3836 observations for each stock. Figure plots the daily closing prices of SSE Index. Since SSE Index adjusts its component stocks every half year, we analyse 87 stocks that have always been included in the index from 01/05/2005 to 10/20/2020. For day t, we obtain 87 negative log-returns and calculate the maxima , where
is the daily negative log-return for stock i. Figure shows the histogram of
.
Figure 1. Daily closing prices of SSE Index from 01/05/2005 to 10/20/2020.
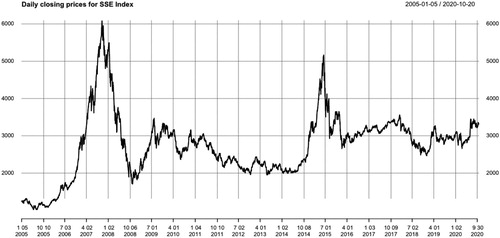
Figure 2. Histogram of daily maxima of negative log-returns of 87 stocks in SSE Index from 01/05/2005 to 10/20/2020.
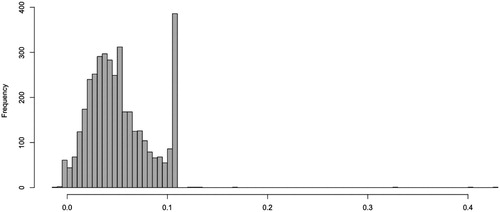
By Figure , we see that there are many daily maxima of negative log-returns clustered around 0.11, due to the Limit Up-Limit Down Rule of China's stock market. This rule prohibits trading activity in exchange-listed securities at prices outside specified price bands. Motivated by Section 5.1 in Zhang (Citation2020), we first fit a GARCH(1,1) model with normal distributed innovations to each individual negative log-retuens series. Using the negative log-returns series divided by the fitted volatilities, we obtain standardised negative log-returns series for each stock. Taking the maximum value of the 87 standardised negative log-returns each day, we obtain a time series , see Figure . It is seen that there exist four possible peaks around June 2006, November 2008, January 2016 and September 2018. In fact, China's stock market experienced substantial boom and burst during these five periods. On June 7, 2006, SSE Index plummeted 88.45 points. In 2008, the US subprime mortgage crisis spread to the world and triggered a financial tsunami. SSE Index dropped from the highest of 6124 in October 2007 to the lowest of 1664 in October 2008. By the end of 2015, SSE Index was up 12.6% rebounding to 3600. In January 2016, China's stock market experienced a steep sell-off and trading was halted on January 7, 2016 after the market fell 7%. On January 26, 2016, SSE Index fell below the lowest point in August 2015, and on January 27, it fell down to 2638. After SSE Index fell below the 2016 lowest point 2638 on October 11, 2018, it slid below 2500 on October 18, and fell to 2449 on October 19, which plunged more than half from the 2015 highest point. The performance of
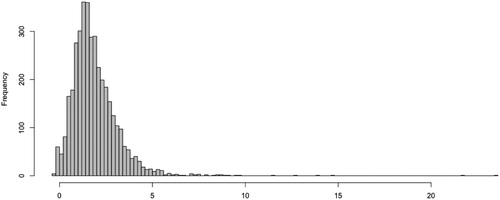
series is consistent with the empirical observations related to China's stock market. Figure presents the histogram of
series, which indicates that the standardised negative log-returns possibly follow Fréchet distribution.
Figure 3. Daily maxima of standardised negative log-returns of 87 stocks in SSE Index from 01/05/2005 to 10/20/2020.
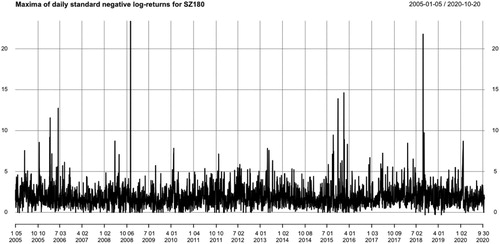
Figure 4. Histogram of daily maxima of standardised negative log-returns of 87 stocks in SSE Index from 01/05/2005 to 10/20/2020.
We fit by the autoregressive tail-index model, i.e. model (5.1)-(5.3) in Zhang (Citation2020). The fitted parameter values and standard deviations are presented in Table . It is shown that all parameters are significant, which indicates model (5.1)–(5.3) is suitable for the cross-sectional maxima of 87 stocks in SSE Index.
Table 1. MLE for cross-sectional daily maxima of negative log-returns of 87 stocks in SSE Index from 01/05/2005 to 10/20/2020.
The recovered tail indexes are presented in Figure . Obviously, when the extreme events appear, the tail index tends to decrease, reflecting an increase in risk. Figure shows the recovered scale parameters
.
Figure 5. Recovered tail indexes (dashed), and daily maxima of standardised negative log-returns (solid) of 87 stocks in SSE Index from 01/05/2005 to 10/20/2020.
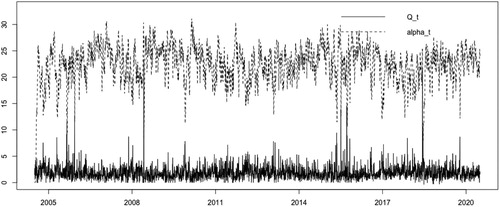
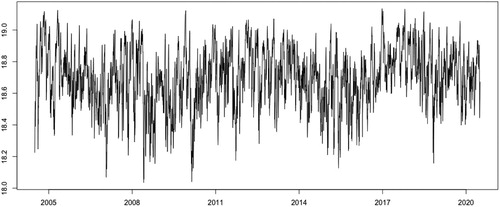
Figure 6. Recovered scale parameters of 87 stocks in SSE Index from 01/05/2005 to 10/20/2020.
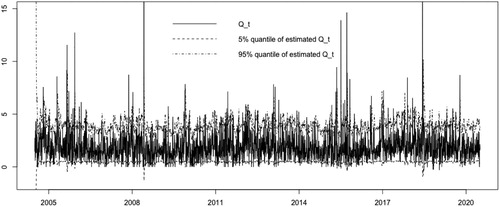
Based on the recovered and
, we estimate the 90% confidence interval of
by (5.1), which is presented in Figure . We find that 90.6% of
lie in the estimated 90% confidence interval.
Figure 7. The 5% quantile (dashed), 95% quantile (dash-dotted) of the estimated and daily maxima of standardised negative log-returns (solid) of 87 stocks in SSE Index from 01/05/2005 to 10/20/2020.
We further test the out-of-sample performance of model (5.1)–(5.3) for predicting 1-day conditional Value at Risk (conditional VaR) for daily maxima negative log-returns of SSE Index. Conditional VaR is the most commonly used measure for tail risk in financial applications. For , conditional VaR
is defined as the 1−q extreme quantile of
given all past information
. First, we fit model (5.1)–(5.3) using the 2500 observations where
(roughly 10 years). For the rest 1336 observations where
, based on the fitted model (5.1)–(5.3) and past information
, we calculate their 1-day conditional VaR
at
The true daily maxima are then compared with the estimated conditional VaR and the number of violations is recorded. Table presents the expected violations (1336
), the number of actual violations, the violation rates and relative error rate. It is clear that the 1-day conditional VaR based on model (5.1)–(5.3) performs well, with small relative error rate and violation rate close to
.
Table 2. The performance of model (5.1)–(5.3) on approximation of 1-day conditional VaR for daily maxima negative log-returns of SSE Index.
We also use the autoregressive conditional Weibull model (i.e. in model (5.1) is a unit Weibull random variable), to fit China's stock market. It does not perform as well as model (5.1)–(5.3) with unit Fréchet random variable, so we do not present the results. We believe that the autoregressive tail-index model (5.1)–(5.3) also captures the systematic risk in China's stock market.
In a summary, although the autoregressive tail-index model presented in Zhang (Citation2020) is novel and advanced, it cannot be directly applied to the stock data from China's market. However, it can be applied to pseudo-returns which we studied and discussed.
Acknowledgments
Deyuan Li's research was partially supported by the National Natural Science Foundation of China grants 11971115.
Disclosure statement
No potential conflict of interest was reported by the authors.
Additional information
Funding
References
- Deng, L., Yu, M., & Zhang, Z. (2020). Statistical learning of the worst regional smog extremes with dynamic conditional modeling. Atmosphere, 11(6), 665. https://doi.org/10.3390/atmos11060665
- Zhang, Z. (2020). On studying extreme values and systematic risks with nonlinear time series models and tail dependence measures. Statistical Theory and Related Fields.
- Zhao, Z., Zhang, Z., & Chen, R. (2018). Modeling maxima with autoregressive conditional Fréchet model. Journal of Econometrics, 207(2), 325–351. https://doi.org/10.1016/j.jeconom.2018.07.004