
 ?Mathematical formulae have been encoded as MathML and are displayed in this HTML version using MathJax in order to improve their display. Uncheck the box to turn MathJax off. This feature requires Javascript. Click on a formula to zoom.
ABSTRACT
This paper was to examine the reliability and criticality of two dual-fuel marine engine systems and to compare them with a conventional diesel engine system with the utilization of the dynamic fault tree analysis. The results of reliability analysis for the dual-fuel engines indicate that the failure probability of the dual-fuel engine is 8.84% on average at 14,000 running hours whereas 8.48% for the diesel engines. This finding contrasts our intuition that the dual-fuel engines are of higher risk compared to the conventional diesel engines. Research findings, obtained from the reliability-centered maintenance, suggest an effective way of enhancing the safety of engine systems through predictive maintenance, based on the periodical maintenance of critical components. Therefore, it can contribute to improving the reliability of the whole systems in which mechanical components and fuel oil feed systems were identified as critical elements to diminish the system reliability significantly. It also highlights the importance of the proper maintenance of system components that would greatly enhance the safety levels by restoring systems back to their original operating condition, hence minimizing downtime and operating costs. Research outputs also offer meaningful insights about the association between the planned maintenance strategies and the system reliability.
Introduction
Industrial background
Throughout the decades, the shipping industry has played a role as one of the core businesses of the existing civilization, and has been one of the main pillars that support capitalism and the global economy as it is known today (Giannakopoulou, Thalassinos, and Stamatopoulos Citation2016). The maritime transport business accounts for 90% of the global trade or 330 million-tonnes of carried cargo per year (DNV-GL Citation2014), with the seaborne transport being one of the most effective ways of transferring goods from a cost perspective. After a minor slump caused by the global crisis of 2008, the shipping industry has completely recovered and has shown an incredible rate of development over the past years (UNCTAD Citation2018).
Moreover, the main sources of energy for ships have changed dramatically over the years following the developments of technology, starting from wind to carbon and from carbon to diesel (Fernández Soto et al. Citation2010). In the past five decades, marine vessels have predominantly run on heavy fuel oil (HFO), due to its low cost with a high energy density. Although, HFO has been found to produce massive amounts of emissions that were not seriously taken into account in the past (Corbett and Fischbeck Citation1997). Following the significant effects of climate change caused by greenhouse gases emissions, the shipping industry has recently become a heavily regulated industry environmentally wise (Schieldrop Citation2018). Marine vessels contribute to several kinds of emissions, more specifically to carbon dioxide (), sulphur oxides (
), nitrogen oxides (
) and primary particulate matter (PM) emissions. The maritime transport business amounts for 657 million-tonnes of emissions per year, leading to the second most polluting industry after the automobile industry, accounting for 90% of the global
emissions (Sharples Citation2019). Although the world’s fleet contribution to greenhouse gases is crucial, it is worth noting that the local pollution in areas that the seaborne transport is heavily active, especially in ports, is even greater (Merk Citation2014).
Additionally, there are several regulatory bodies aiming to mitigate those issues, such as the International Maritime Organisation (IMO), classification societies, flags and country authorities (MARPOL Citation2009). The IMO has the highest authority amongst those regulatory bodies and will be imposing new regulations to reduce the emissions of vessels (IMO Citation2014). More specifically, the main regulations that entered into force by the IMO regarding vessel emissions are the International Convention for the Prevention of Pollution from Ships (MARPOL) Annex VI regulation 13 regarding the emissions limits. Additionally, the MARPOL Annex VI regulation 14 regarding the
and PM emissions limits, and regulations based on the attained Energy Efficiency Design Index (EEDI) of vessels that correlates with their
emissions (MARPOL Citation2018, Citation2019). The most rigorous of those regulations established are the
emissions limits, which reduce the sulphur percentage in marine fuels to a maximum of 0.5% globally (ICOF Citation2020).
As a result of such a stringent regulation, LNG as a marine vessel fuel has recently risen significantly in popularity and has arguably been deemed as the best alternative to HFO by industry professionals and academics. LNG as a fuel has a lower average cost and produces lower emissions than HFO, that are within the allowable limits (DNV-GL Citation2018). The shift to LNG has created a need for an extensive research on main engines and generator sets that can most efficiently burn LNG. As of 2018, the current LNG fuelled fleet utilized various engine configurations, whereas 69% of the fleet was mounted with dual-fuel engines (Alkan Citation2018). Additionally, LNG is colourless, odourless and highly flammable; hence a highly hazardous fuel, due to that reason there is a need for further research on how to ensure a safer environment on-board for LNG fuelled vessels (Foss Citation2014). As a result, there has been voluminous research on improving the safety and consequently the reliability of dual-fuel engines.
Furthermore, the shipping industry over the years has faced major difficulties in various aspects, one of the most crucial of those are the safety aspects (Wang Citation2001). Safety precautions are frequently considered before the design of a vessel or a marine system in order to minimize and possibly prevent the loss of human lives, the loss of cargo, the damage or loss of assets (i.e., equipment or vessels) and pollution to the environment (Lois et al. Citation2004). In order to signify the importance of safety aspects, it is worth mentioning that since 2002 the IMO has employed a method to identify and minimize the potential hazards of a new system introduced into the industry, which is called the Formal Safety Assessment (FSA) (IMO Citation2018). On the other hand, maintenance has always been a major part of the marine transport business that contributes significantly in terms of cost over the lifetime of a vessel and amasses to a high percentage of the operational costs. The rise of mechanization and automation has increased the funds directed for maintenance purposes while reducing the number of needed crewmembers (Dekker Citation1996). In the marine industry, one of the most common approaches to assess safety levels and to provide advice for maintenance strategies has been reliability assessments.
Reliability assessment applications on marine systems
Regarding the literature review, past researchers in their scientific publications have extensively utilized reliability assessment tools in the marine industry to maximize safety levels as well as employ tailormade maintenance strategies for the given cases undertaken. To begin with, a Combinational Approach for Safety Assessment (CASA) that combined a System Theoretic Process Analysis, Event Sequence Identification (ESI) and fault tree analysis (FTA) was developed by (Bolbot et al. Citation2019), in order to define an optimal power plant design for a case study cruise ship based on efficiency, environmental footprint, lifecycle cost and safety level factors. A reliability assessment for offshore multi megawatt capacity electric Dynamic Positioning (DP) systems was conducted by (Vedachalam and Ramadass Citation2017), which resulted in the power generation cum management system, the computer control cum sensors system and the thruster systems to be the most critical systems. In addition to that, those findings were advised to be utilized for reliability-centred design and maintenance purposes. Moreover, (Lazakis et al. Citation2009) suggested a predictive maintenance strategy based on risk and criticality measures that can be calculated by utilizing the Failure Modes, Effects and Criticality Analysis (FMECA) and DFTA risk assessment tools. A Business Oriented Reliability Based Maintenance (BORM) approach based on a Bayesian Belief Network (BBN) analysis was introduced for a case study subsea control system by(Taher, Lazakis, and Turan Citation2014). An FTA was utilized by (Kadam and Kulkarni Citation2017) to improve the efficiency of a four-cylinder four-stroke petrol engine. An FTA and Artificial Neural Network (ANN) modelling approach were employed by(Raptodimos and Lazakis Citation2017). Furthermore, an FTA and a Bow Tie analysis were utilized by(Rasoulzadeh Khorasani Citation2015) for a risk assessment study of a diesel engine failure in a dynamic positioning system. A reliability assessment was implemented with the use of FTA by (Dong et al. Citation2013) and (Ta, Thien, and Cang Citation2016). An FTA and Reliability Block Diagram (RBD) were introduced by(Laskowski Citation2015) to assess the reliability of a marine main engine. A time-dependent Markov approach was utilized in order to conduct a reliability assessment for reliquefication systems on LNG carries by (Kwang Pil, Rausand, and Vatn Citation2008), providing a rather newly introduced modelling approach for the studied systems. A fault diagnosis of marine four-stroke engines by using Extreme Learning Machines (ELMs) neural network models was introduced by (Kowalski, Krawczyk, and Woźniak Citation2017), for purposes of increasing the safety and reliability on-board. A fuzzy reliability analysis of dual-fuel steam turbine mechanical propulsion conventional system (DFSMC) in LNG carriers was presented by (Komal and Lee Citation2015) with the utilization of the fuzzy lambda-tau (FLT), genetic algorithms-based lambda-tau (GABLT) and FTA. Moreover, a Condition Based Maintenance (CBM) strategy for medium-speed diesel engines was introduced by (Basurko and Uriondo Citation2015) with the usage of an ANN model for fault diagnosis, in order to improve reliability and optimize maintenance hence improving the energy efficiency. An FTA for fire and explosion accidents of dual-fuel engine rooms burning diesel and LNG was conducted by (Guan et al. Citation2016), for the minimization of the LNG leakage probability that can often lead to explosions. A combination of FTA, Failure Modes and Effects Analysis (FMEA) and ANN tools was utilized by (Lazakis, Raptodimos, and Varelas Citation2018), for a case study Panamax size container vessel in order to identify the critical components and systems through reliability modelling and monitoring. A dynamic risk and reliability assessment for ship machinery was introduced by (Dikis Citation2016) with the usage of Markov Chains and BBNs, with the innovation of considering the risk of failure and the reliability degradation. The main and supporting systems of a case study diving support vessel (DSV) were examined in terms of reliability and the critical components of each system were identified, with the use of a DFTA by (Turan et al. Citation2011). Finally, the FMECA and FTA risk assessment tools were utilized by (Lazakis, Turan, and Aksu Citation2010), in order to identify the most critical components, to estimate the reliability of the overall systems and to calculate the availability of specific items on-board a case study vessel.
Research gap
Due to the recent introduction of dual-fuel engines into the marketplace, little research has been conducted on the reliability of dual-fuel or gas engines. Given that predictive maintenance based on the criticality and reliability of components for dual-fuel engines is becoming a topic of interest in the upcoming years, when the first significant failures will start to occur, further research in regards to the reliability of LNG dual-fuel engine systems is an urgent task; since those systems lack research regarding their reliability aspects. Considering the lack of past studies on examining the reliability of dual-fuel engines holistically, this paper was created to investigate the reliability and criticality of dual-fuel engines as well as their supporting or auxiliary systems. Hence, this study will comprise of a detailed analysis of a diesel and two dual-fuel engines by utilizing the DFTA approach in order to compare the reliabilities and give advice for predictive maintenance based on critical components. The recommendations will be given in a way of maximizing engine reliability whereas minimizing criticality levels.
Methodology
This purpose is achieved in this paper by employing a quantitative safety analysis and more specifically a dynamic fault tree analysis (DFTA) with the utilization of the PTC Windchill software. Additionally, the DFTA modelling was chosen, due to the fact that it is one of the most reliable quantitative safety analysis methods that provides results with high accuracy. Moreover, the major steps or phases related to the achievement of this purpose are presented in a descriptive flow chart in .
Figure 1. Approach flow chart.
Description of FTA and DFTA
FTA is one of the most common and powerful approaches used for safety and reliability analysis; it can be described as a structured event-oriented analysis that only allows for hardware failures to occur (IEC 61025 Citation2006). The main purpose of FTA is to evaluate the reliability of a system and identify the safety-critical components within it (NUREG-Citation0492 1981). FTA is a deductive approach, which initiates with a system-level failure event and aims to identify the hazards that caused this event to fail. Additionally, it utilizes a top-down approach in order to create a logical model that can produce a qualitative and quantitative evaluation of a system’s reliability based on analytical as well as statistical methods (NASA Citation2002). FTA is a time-dependent approach, which means that not only the different failure modes need to be inputted into a simulation model, but also their failure rates. FTA can be used to provide important information regarding the failure probability and the means by which a failure can occur (Bedford and Cooke Citation2001). The system level failure event is called the top event, which portrays the failure of a system. Whereas, the lowest level events in the branches of an FTA are called basic events and portray different failure modes for which the probability of failure is inputted based on historical or predicted data sets. The top event is connected with the basic events with the usage of logic symbols called gates. Gates can be used as complex interconnections between the top event and the basic events to logically simulate the actual function of a system (Čepin and Mavko Citation2002). Gates are subdivided into two main categories, which are static gates and dynamic gates. The major difference between FTAs and DFTAs is essentially that FTAs comprise of static gates and basic events, whereas DFTAs comprise of static gates, dynamic gates and basic events. It is worth noting that, static gates utilize probability theory and Boolean algebra for their calculation procedures, whereas dynamic gates are calculated using Markov models (Hoyland and Rausand Citation2009). The main difference between static and dynamic gates is that the order of the inputs will not affect the end result in the case of static gates, whereas in the case of dynamic gates the sequence or order of the inputs is crucial and should be chosen appropriately since it influences the end result.
Calculation method
To begin with, fault trees can be used to conduct calculations both qualitatively and quantitatively. In the existence of numeric values, fault trees can conduct a quantitative analysis, whereas in the case that numeric values are not available fault trees can employ a qualitative analysis. The quantitative analysis of a fault tree can be conducted with several methods. The most common of those methods are the cut set, the cross product, the Esary-Proschan (EP) and exact calculation methods. The exact calculation method was utilized in this project in order to perform the calculations of the simulations. The exact calculation method is based on the gate logic to perform the necessary calculations of a fault tree; unlike other methods that use cut sets method calculations. This method produces results with high accuracy, but for large simulation models, it can be highly time consuming and might even crash under high overload during reliability calculations (Lazakis Citation2011).
Moreover, one of the most important outputs of a fault tree simulation model is the reliability. Reliability can be defined as the ability of an item to perform its function without failure under given conditions for a given time interval. By assuming that the failure rate is constant, the reliability is given by the following formula:
Where:
, denotes the reliability over time
e, denotes the base of natural logarithms
λ, the given failure rate of an item that is constant for at least time t
t, the given time interval for which an item is at risk under given conditions, which is called the mission time
In addition, the PTC Windchill software, which is the software utilized to conduct the simulations, produces the unreliability as a result. The unreliability is simply given by the following formula:
Where:
denotes the unreliability over time
, denotes the reliability over time
Furthermore, the main inputs in the DFTA simulation are the gates and events as well as the Mean Time Between Failures (MTBF). The MTBF is the time between two failures of a given system, or the summation of the Mean Down Time (MDT) and Mean Time to Failure (MTTF). By assuming a constant failure rate, the MTBF is given by the following formula:
Where:
, denotes the Mean Time Between failures
, denotes the failure rate
Importance measures
Reliability importance measures (IMs) aim to determine events whose improvement will yield an increase in the overall simulation model performance. Importance measures can provide information on which events need to be altered in order to increase the reliability of a system. The main importance measures, which are the Birnbaum, criticality and Fussell-Vesely importance measures are described below.
Birnbaum importance measure
he Birnbaum importance measure is described by the rate of change of the top gate probability with respect to the change in the unavailability of a basic event. It determines the maximum increase of risk when an event has occurred during operation. The Birnbaum importance measure can signify which events should be enhanced to increase the overall reliability of a system (Andrews and Beeson Citation2003). The Birnbaum importance measure for a given event A can be calculated as the difference in the probability of the top event given that event A did occur minus the probability of the top event given that event A did not occur (Birnbaum Citation1969), this is given by the following formula:
Where:
, denotes the Birnbaum importance measure for a given event A
, denotes the event whose importance is being measured
, denotes that the event whose occurrence was not completed
, denotes the top event
Criticality importance measure
The criticality importance measure is defined as the probability that a given event A is critical for the overall system and has occurred given that the top event has occurred. The criticality takes into account the conditional probability that a given event A is critical for as well as the overall probability of the top event occurrence due to event A. The criticality importance measure adjusts the relative probability of a given event A in order to define the likelihood of occurrence of the event and determines how feasible it is to improve this event (Espiritu, Coit, and Prakash Citation2007). The criticality importance measure is given by the following formula:
Where:
, denotes the criticality importance measure for a given event A
, denotes the event whose importance is being measured
, denotes that the event whose occurrence was not completed
, denotes the top event
Fussell-Vesely importance measure
The Fussell-Vesely (F-V) importance measure is utilized to events who contribute to the occurrence of the top event of a system, those events are not necessarily the most critical ones. The F-V measure relies on minimal cut sets calculations, which define the shortest potential way that leads to the occurrence of the top event. It is worth noting that the F-V importance measure provided the exact same results with the F-V alternative, hence the latter will not be discussed further. The F-V is described as the ratio of the probability of the occurrence of any cut set containing a given event A and the probability of the top event (Fussell Citation1975). The F-V importance measure is given by the following formula:
Where:
denotes the Fussell-Vesely importance measure
, denotes the number of minimal cut sets containing i
, denotes the jth minimal cut set amongst those containing i, verified at time t
Data collection
A major challenge of this study was the gathering of the necessary data sets regarding the MTBFs and the critical components. The main sources which were reviewed to collect the data needed were the WINGDX72 Maintenance Manual (WINGD Citation2018a), the WINGDX72 Operation Manual (WINGD Citation2017), the WINGDX72DF Maintenance Manual (WINGD Citation2018b), the WINGDX72DF Operation Manual (WINGD Citation2019), the Guiding Overhaul Intervals report of MAN Diesel & Turbo® (MAN Citation2017). Additionally, several information was gained from the Wärtsilä® 20 PRODUCT GUIDE (Wärtsilä® Citation2018), the Wärtsilä® 20DF PRODUCT GUIDE (Wärtsilä® Citation2018), shipping companies data and the OREDA Handbook (SINTEF Industrial Management Citation2015). All the aforementioned sources provided the necessary MTBFs apart from the OREDA Handbook, hence a simple formula that was provided in the handbook was utilized in order to calculate them, this formula is given below:
Where:
, denotes the Mean Time Between Failures in hours
, denotes the operational time in hours
, denotes the number of installations for a given component or system
, denotes the number of failures for a given component or system
Simulations’ software
Finally, in order to create the simulations, the engine manuals were extensively read to identify the critical components of the different engines, and the simulations were created with the usage of PTC Windchill software. The PTC Windchill manual guides were read to have a sufficient understanding of the software (SINTEF Industrial Management Citation2015).
Limitations of the present study
The first limitation of this study was that it assessed the reliability levels of engines and their supporting systems, by not considering for the reliability and safety holistically, which refers to an entire case study vessel. In addition to that, this will require more data regarding all the critical components failures of an entire ship, hence data gathering with the utilization of sensors could prove to be of vital importance, if shipping companies are willing to provide it and a team of researchers to take on this great feat. The second limitation of this study is that it examined the reliability by using a single approach. Hence, it is heavily recommended for future studies to assess the reliability of dual-fuel engines by applying different assessment approaches used on marine engines and compare the findings to the past assessments so that a mean optimal solution is deducted, and only then clear advice can be given regarding the maximization of safety and reliability of dual-fuel engines.
Case Studies
In this section, a description of how the data was collected and the analysis was conducted is provided. Afterwards, the logic behind the construction of the different simulations and their results are highlighted.
General characteristics of simulated engines
The DFTA simulations were created for the WINGD-5X72 diesel engine, WINGD-5X72DF engine and the G70ME-C9.5-GI-TII engine. The general characteristics of the simulated engines and the references for which the various MTBFs were found, are illustrated in the .
Table 1. General characteristics of engines and references
As it can be observed from the above table, there is a small difference in the power output of the three engines, hence the system redundancy is not to be considered.
DFTA simulations assumptions
It is known from the International Association of Classification Societies (IACS) that classification society registered vessels conduct dry-docking twice every 5 years; which refers to the intermediate survey that takes place every 2.5 years and the special survey every 5 years (IACS Citation2015). Thus, since vessels conduct dry-docking every 2.5 years all three DFTA simulations were run for 2.5 years of operation. The operational hours at 2.5 years are calculated in hours, by assuming 20 hours of operation per day and 280 days of operation per year as expressed below:
Where:
, denotes the operational hours at 2.5 years
, denotes the daily operation in hours per day
, denotes the days per year
, denotes the number of years
Furthermore, the 14,000 hours of operation do not necessarily mean that the engines operated that exact number of hours. The actual difference in hours compared to the theoretical one refers to out of service time of the engines. That might be caused by the time a vessel is in port or it conducts dry-docking.
Finally, the threshold of good operational state acceptable limit of the reliability index (TOGOSALRI) is set to 90%, based on (Lazakis Citation2011). It is worth mentioning that typically this index is set to 95% in the industry. It should be clearly noted that reliabilities below the set index, do not indicate that systems or subsystems remain out of operation, since the on-board crew always deals with possible malfunctions, hazards or damages that are presented before they become critical.
DFTA simulations construction methodology
The WINGD-5X72, the WINGD-5X72DF and the G70ME-C9.5-GI-TII are two-stroke engines hence they have various common components. It is worth noting, that the former ones are sister engines designed by Wärtsilä® and as a result have many common components, whereas the latter one is designed by MAN Diesel & Turbo® and has various different components compared to the former ones. The latter ones are dual-fuel engines hence there are several different components especially in their Fuel oil systems construction compared to the former one, this is highlighted in the Fuel oil system construction methodology paragraph. It is worth mentioning that the general construction methodology of all the simulations was fully based on the literature review.
From now on the WINGD-5X72, WINGD-5X72DF and G70ME-C9.5-GI-TII DFTA simulations will be denoted as (DFTA1), (DFTA2) and (DFTA3) respectively. The DFTA1, DFTA2 and DFTA3 calculations regarding the MTBFs and the according references are presented in respectively in the Appendix.
Due to the fact that the three engines have various common components, a general methodology approach is provided below in a system-by-system basis and the differences of the DFTAs are highlighted.
Main engine system
The Main engine system represents the top level of the simulations and is modelled with an OR gate, since a failure of any of the subsystems would result in an engine failure. The subsystems will be described in depth in the following paragraphs.
The top level of the DFTA1 and DFTA2, which refers to the Main engine system, is subdivided into six main systems, which are the Mechanical components, Fuel oil feed, Lubricating oil, Cooling, Air and Control systems. The top level of the DFTA3 is subdivided into the former first five systems, since MAN Diesel & Turbo® did not provide failure rates data regarding control systems.
Mechanical components system
The Mechanical components system is divided into the Cylinder block assembly system & Engine block and components systems and is represented with an OR gate since a failure of either system would lead to the failure of the Mechanical components system.
The Cylinder block assembly system is portrayed by an AND gate, which means that the Cylinder fixed parts and the Pistons assembly subsystems should fail for the system to occur. The Cylinder fixed parts are modelled with an OR gate, which means that if either event occurs the system would fail. A Voting gate represents the Pistons assembly, since a given number of event failures would be critical and result in the failure of the subsystem. The Pistons assembly subsystem of DFTA1 and DFTA2 is portrayed by a two-out-of-four Voting gate, whereas in DFTA3 by a two-out-of-three Voting gate.
The Engine block and components system is modelled with a two-out-of-three Voting gate, meaning that two of the Main bearings, Other bearings & guides and Crankshaft subsystems should fail for the gate to occur. The Main bearings subsystem is portrayed with an OR gate, since either event failure would be critical. The Other bearings and guides subsystem of DFTA1 and DFTA2 is modelled with a three-out-of-eight Voting gate, whereas in DFTA3 by a three-out-of-nineteen Voting gate. The Crankshaft subsystem is modelled with an AND gate separately, since it is a crucial system containing only the crankshaft failure. It is worth noting that the AND gate could be deleted, and the same result would be produced.
Fuel oil feed system
The Fuel oil feed system of DFTA1 includes the Fuel heating, Fuel injection, Fuel ignition and Consequent failures subsystems and is represented with a three-out-of-four Voting gate. The Fuel oil feed system of DFTA2 and DFTA3 includes the Pilot fuel components, Pilot fuel system, Fuel injection, Fuel ignition and Consequent failures subsystems and is represented with a three-out-of-five Voting gate. This difference in subsystems is caused by the fact that DFTA2 and DFTA3 portray dual-fuel engines hence the addition of the pilot fuel system results in different components compared to DFTA1 that portrays a diesel engine.
The Fuel heating subsystem of DFTA1 is modelled with an OR gate, meaning that either event occurrence would occur the gate. The Pilot fuel components subsystem of DFTA2 and DFTA3 is portrayed with a Priority AND (PAND) gate, which means that the events need to occur in a particular order from left-to-right for the subsystem gate to occur. The Pilot fuel system of DFTA2 and DFTA3 is modelled with an AND gate, indicating that both events have to occur for the gate to fail.
The Fuel injection system of all three DFTAs includes the Fuel Filter, Fuel feed pumps and Fuel feed valves subsystems. The Fuel filter is simulated with an AND gate. The Fuel feed pumps and Fuel feed valves subsystems are modelled with an OR gate, meaning that either event occurrence would cause the gate to occur.
The Fuel ignition system of all three DFTAs is portrayed with an AND gate, hence the occurrence of the only event would occur the gate. The Consequent failures system of all three DFTAs is modelled with an OR gate, meaning that either event failure will cause the gate occurrence.
Lubricating oil system
The Lubricating oil system is divided into the Lubricating turbocharger, Lubricating filter, Lubricating pumps and valves & Lubricating cooler subsystems and is represented with a PAND gate, which means that all the subsystems have to fail, in order from left-to-right, for the system to fail.
The Lubricating turbocharger, lubricating filter and Lubricating cooler subsystems are portrayed with AND gates, meaning that all their single events should occur for the subsystems to occur. The Lubricating pumps and valves are modelled with an OR gate, indicating that either event occurrence will cause the subsystem to occur.
Cooling system
The Cooling system is subdivided into the Jacket water cooling & Central cooling subsystems, and is represented with an AND gate, meaning that both subsystems should occur for the system to fail.
The Jacket water cooling subsystem is modelled with an OR gate, hence either event occurrence would lead to the occurrence of the subsystem. The Central cooling is divided into the Cooling system cooler & Cooling system body and instrument subsystems and is portrayed with an OR gate, which means that if either subsystem fails then the system fails. The Cooling system coolers and Cooling system body and instrument subsystems are modelled with an AND gate, meaning that all events have to occur for the gates to occur.
Air systems
The Air systems are subdivided into the Compressed/scavenge air and Exhaust gas subsystems, and are represented with an AND gate, meaning that both subsystems failure should occur for the system to fail.
The Compressed/scavenge air system includes the Scavenge air valves, Turbine and compressor, scavenge air filter, Scavenge air instrument & Scavenge air piping and pumps subsystems, and is modelled with a PAND gate, meaning that all subsystems should occur, in order from left-to-right, for the system to occur. The Scavenge air valves, turbine and compressor & Scavenge air piping and pumps subsystems are portrayed with OR gates, hence either event failure would cause the gates to occur. The Scavenge air filter and Scavenge air instrument subsystems are modelled with AND gates, that means the occurrence of their only events will occur the gates.
The Exhaust gas system includes the Exhaust gas turbocharger and cooler & Exhaust gas valves and tank subsystems, and is modelled with a PAND gate, indicating that the two subsystems should occur, in order from left-to-right, for the system to occur. The Exhaust gas turbocharger and cooler & Exhaust gas valves and tank subsystems are portrayed with OR gates, meaning that either event occurrence would cause them to occur.
Control system
The Control systems of DFTA1 and DFTA2 include only the UNIC control and ECS control subsystems respectively, and are simply portrayed with an AND gate, indicating that if the single subsystems occur then the system occurs. The UNIC control and ECS control subsystems are modelled with an AND gate, meaning that if their single events occur the gates will occur.
The control systems of DFTA1 and DFTA2 are not subdivided into further subsystems, since the data collected and found only provided a single MTBF data for each case, though it was decided to be simulated in the other two simulations since it is an important part of the engines. Moreover, the data provided and collected for DFTA3 did not include data regarding control systems, hence this system was not taken into account in this case.
Results and discussion
In this section, the results of the three DFTA simulations in terms of reliability and criticality are examined and discussed. More specifically, the results of the systems (second-levels), the overall (top-level) results and the most critical components of each simulation are presented. As it has been mentioned beforehand, those results were achieved by applying the Exact calculations approach in PTC Windchill® software.
DFTA simulations results
below illustrate all the system reliability curves of the three DFTA simulations in a single graph.
Figure 2. DFTA1 system reliability curves.
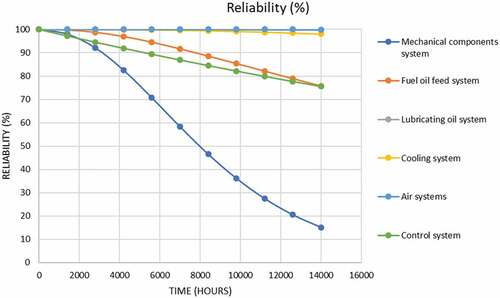
Figure 3. DFTA2 system reliability curves.
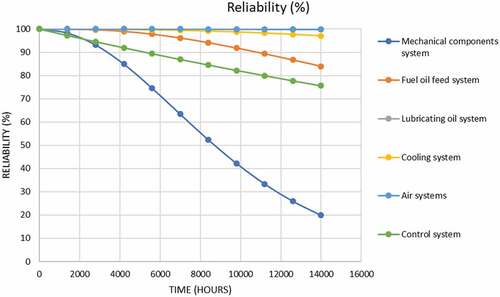
Figure 4. DFTA3 system reliability curves.
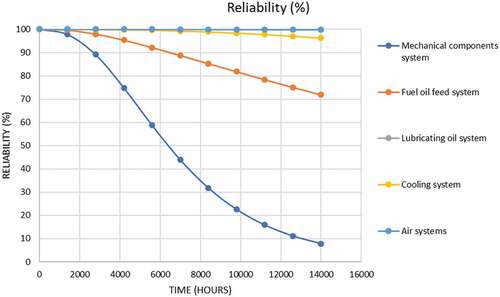
The Lubricating oil and Air systems for all of the three engine simulations remained at a high reliability over the 2.5 years or 14,000 hours period, having two colliding nearly constant function reliability curves. The Cooling systems of all three simulations displayed a very satisfactory reliability curve result, which started deteriorating very slightly after 8,400 hours. The Fuel oil feed system portrayed a good reliability curve result, which reduced periodically after 2,800 hours; the result of DFTA2 was significantly better compared to DFTA1 and the result of DFTA3 was the worst amongst the three simulations. The Control systems of DFTA1 and DFTA2 had satisfactory yet steep reliability curves displaying strictly decreasing functions; this was caused by the fact that these systems included a single component. The Mechanical components systems of DFTA1, DFTA2 and DFTA3 resulted in a reliability of 15.12%, 19.94% and 7.84% at 2.5 years respectively, which descended rapidly after 2,800 hours for DFTA1 and DFTA2 and after 1,400 hours for DFTA3. The Lubricating oil, Air and Cooling systems of DFTA1, DFTA2 and DFTA3 were above the TOGOSALRI. Whereas, the Fuel oil feed, Control and Mechanical components systems of DFTA1, reached below it at 7,700, 5,600 and 3,000 hours respectively. The Fuel oil feed, Control and Mechanical components systems of DFTA2, reached below it at 11,000, 5,400 and 3,000 hours respectively. The Fuel oil feed and Mechanical components systems of DFTA3 reached below it at 6,500 and 2,750 hours respectively.
Moreover, below illustrate the top-level reliability curves of the three DFTA simulations.
Figure 5. DFTA1 reliability curve.
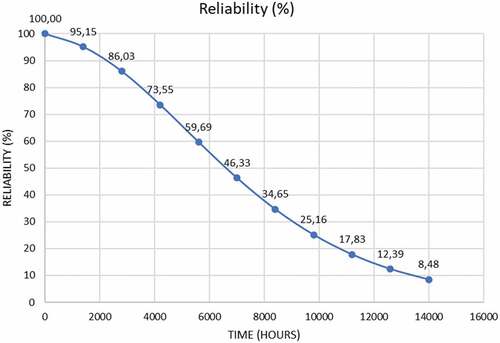
Figure 6. DFTA2 reliability curve.
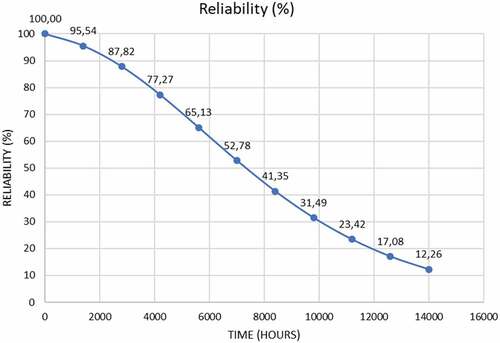
Figure 7. DFTA3 reliability curve.
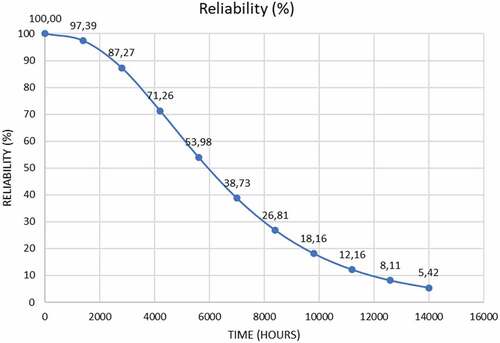
The second derivative of the reliability of the three simulations is negative until 5,600 hours, meaning the reliability decrease is rapid, and then becomes positive, meaning that the decrease is slower with steadier phase. This slope orientation indicates the correctness of the reliability curves achieved. The reliability decrease was slow until 1,400 hours in DFTA1 & DFTA3 and until 2,800 hours in the case of DFTA2. From 1,400 until 7,000 hours in DFTA1, from 2,800 until 7,000 hours in DFTA2 and from 1,400 until 5,600 hours in DFTA3, it became increasingly more rapid. Then from 7,000 hours and onwards in DFTA1 & DFTA2 and from 5,600 hours and onwards in DFTA3, it became slower with an increasingly smaller decrease in each interval. At 14,000 hours, the reliability reached 8.48% in DFTA1, 12.26% in DFTA2 and 5.42% in DFTA3; and at 2,300 hours and onwards in DFTA1 and at 2,600 hours and onwards in DFTA2 & DFTA3, it was below the TOGOSALRI. Finally, the final reliability result achieved amongst the three simulations, was the best in DFTA2 and the worst in DFTA3.
Furthermore, below illustrate the ten most critical components or systems of the three DFTA simulations, based on the criticality IM in a single graph; it is worth mentioning that the criticality is arguably the best measure to assess the reliability of the critical components.
Figure 8. DFTA1 most critical components.
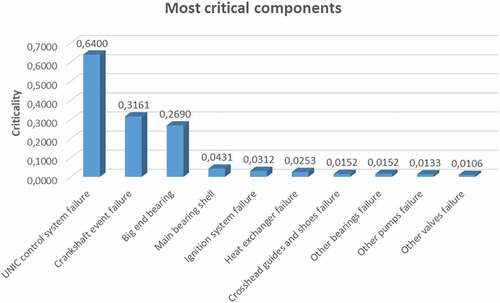
Figure 9. DFTA2 most critical components.
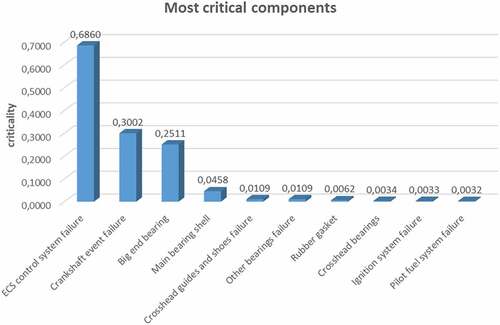
Figure 10. DFTA3 most critical components.
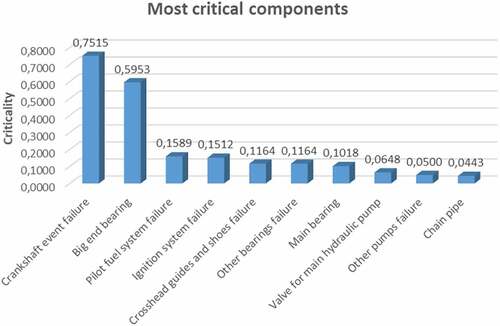
In all of the three simulations, the Mechanical components and Fuel oil feed systems resulted in the most critical failures, which was to be expected since those systems are prone to frequent hazards or damages. The most critical component proved to be the Crankshaft in the case of DFTA3, and the UNIC & ECS control systems in DFTA1 and DFTA2 respectively, which was to be expected since it was only simulated with a single event.
DFTA simulations results with spares
To begin with, for the purpose of increasing the reliability levels, spare parts were introduced into the three DFTA simulations based on the RCM strategical concept. Based on the ten most critical components of each simulation spare gates were introduced. The ten most critical components of each DFTA simulation were identified in the previous subchapter based on the criticality importance measure. Spare gates were introduced by replacing the critical Basic events with Spare gates, and by adding two Spare events below them, this in practice simulates the additional spares provided in a ship’s storage space to be utilized for the replacement of the original parts. It is worth mentioning, that for the parts that it is impossible to include spares in a ship’s storage, the modelling of spares in the simulations refers to general overhauling of the parts based the CBM strategy concept, in order to restore the components or systems back to their original operating condition to be able to perform their required function.
The spares addition has been made according to the ten most critical components identified in each of the three simulations. below illustrate the DFTA1, DFTA2 and DFTA3 simulation results respectively with and without spares.
Figure 11. DFTA1 reliability with and without spares.
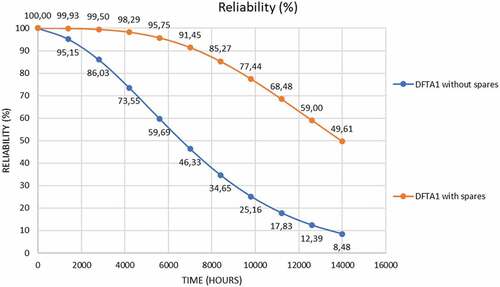
Figure 12. DFTA2 reliability with and without spares.
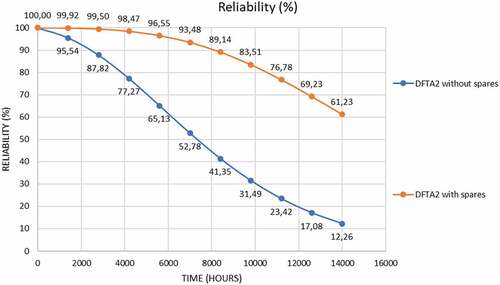
Figure 13. DFTA3 reliability with and without spares.
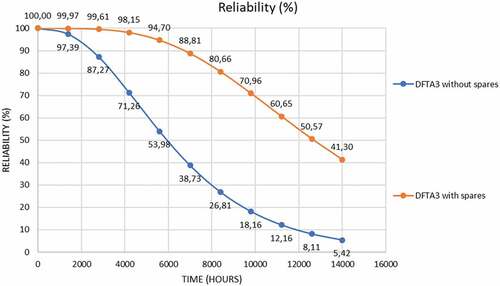
In all of the three simulations, the addition of spare parts greatly increased the reliability levels, leading to a significantly slower reliability decrease over time. DFTA1, DFTA2 and DFTA3 simulation reliability levels where above the TOGOSALRI until 7,400, 8,100 and 6,900 hours respectively. below illustrate the reliability result change with the addition of spares in DFTA1, DFTA2 and DFTA3 respectively, in order to highlight the reliability results enhancement between the disuse and usage of spares.
Figure 14. DFTA1 reliability percentage change.
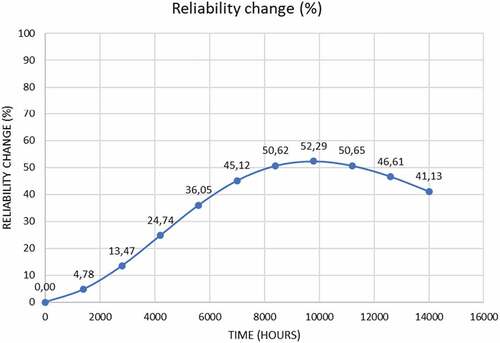
Figure 15. DFTA2 reliability percentage change.
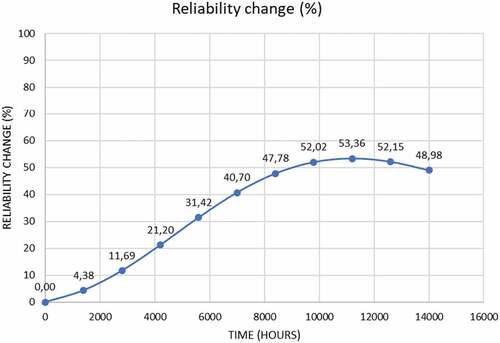
Figure 16. DFTA3 reliability percentage change.
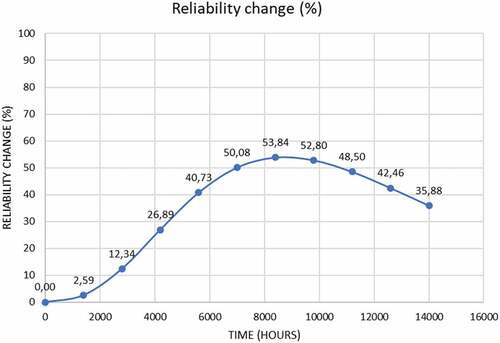
As it can be observed at 14,000 hours or 2.5 operational years the reliability increase was 41.13%, 48.98% and 35.88% in DFTA1, DFTA2 and DFTA3 respectively. The highest reliability increase was 52.27% at 9,800 hours in DFTA1, 53.36% at 11,200 hours in DFTA2 and 53.84% at 8,400 hours in DFTA3.
Comparison of DFTA simulations results
A combined graph that illustrates the reliability of DFTA1, DFTA2 and DFTA3 without spares is provided below.
As it can be observed from , DFTA2 or WINGD-5X72DF proved to be approximately 4% more reliable than DFTA1 or WINGD-5X72, and 7% more reliable than DFTA3 or G70ME-C9.5-GI-TII at 14,000 hours. The G70ME-C9.5-GI-TII had the highest reliability until 1,400 hours, and the WINGD-5X72DF achieved the highest reliability value from 2,800 until 14,000 hours. The G70ME-C9.5-GI-TII had higher reliability than the WINGD-5X72 until 2,800 hours, and then it was surpassed by WINGD-5X72 until the 2.5 operational years.
Figure 17. Reliability curve of DFTA1, DFTA2 and DFTA3 without spares.
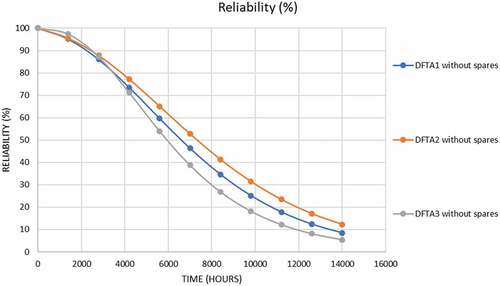
Moreover, the reliability results achieved were 8.48% for the diesel engine, and for the case of dual-fuel engines 12.26% and 5.42% that averages on 8.84%, which leads to the conclusion that LNG dual-fuel engines are on average more reliable than diesel engines and counteracts the argument that they have a higher risk factor.
A combined graph that illustrates the reliability of DFTA1, DFTA2 and DFTA3 with spares is provided in .
Figure 18. Reliability curve of DFTA1, DFTA2 and DFTA3 with spares.
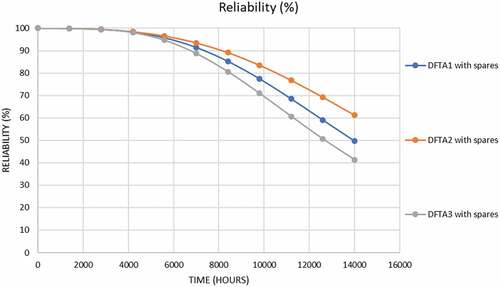
As it can be observed from , WINGD-5X72DF with the introduction of spares proved to be approximately 12% more reliable than WINGD-5X72, and 20% more reliable than G70ME-C9.5-GI-TII at 2.5 operational years. The reliability of WINGD-5X72 was similar to the reliability of G70ME-C9.5-GI-TII until 5,600 hours, but then surpassed it significantly until the 2.5 operational years.
Conclusions
To summarise this study comprised of a detailed analysis of a diesel and two dual-fuel engines by utilizing the DFTA approach. The DFTA construction methodology followed was fully based on past literature regarding DFTA simulations on marine engines. The main findings of this study are depicted below:
The WINGD-5X72DF was found to be the most reliable engine
The dual-fuel engines simulations resulted in a higher reliability mean value compared to the diesel one
All three engines proved to have the most critical components in the Mechanical components and Fuel oil feed systems
Recommendations are given regarding more frequent maintenance intervals and added spares for the critical components
By following these recommendations, the engine reliability can be maximized, and the criticality levels minimized
It is heavily recommended that those findings should be considered for future engine designs and operation, since safety and maintenance are two of the most important aspects of the marine industry and in order to mitigate potential hazards, damages or even accidents vessels should operate on a satisfactory safety or reliability level.
Based on the RCM & CBM strategies and as shown in the simulations spares significantly enhance the reliability, hence safety levels, and can restore systems back to their original operating condition to be able to perform their required function, hence minimize downtime and reduce costs, implying for the purchase of only the critical predicted required spares. Based on the Planned Maintenance System (PMS) approach of shipping companies, ship operators should perform more frequent maintenance intervals by qualified personnel that has acquired full knowledge of monitoring and repairing machinery.
The impact of this research is of significant importance and the reliability as well as the criticality based on the DFTA approach introduced should be considered, because studies on the safety and maintenance aspects of dual-fuel engines will become a serious topic of interest, by taking into consideration the current rise of the LNG fuelled fleet which will be in the hundreds if not thousands in the upcoming decade.
The aim of this study is to contribute on enhancing the safety and reliability of LNG dual-fuel engine systems. Finally, the original contribution or novelty of this study lies in the fact that it is one of the first attempts aiming to quantify the reliability of dual-fuel engine systems holistically by utilizing a detailed quantitative probabilistic approach.
Disclosure statement
No potential conflict of interest was reported by the author(s).
References
- Alkan, A. D., 2018. Maritime Industry Developments Related to Alternative Fuels. Istanbul, Turkey, 3rd International Naval Architecture and Maritime Symposium.
- Andrews, J., and S. Beeson. 2003. “Birnbaum’s Measure of Component Importance for Noncoherent Systems.” IEEE Transactions on Reliability 52 (2): 213–219. doi:10.1109/TR.2003.809656.
- Basurko, O. C., and Z. Uriondo. 2015. “Condition-Based Maintenance for Medium Speed Diesel Engines Used in Vessels in Operation.” Applied Thermal Engineering 80: 404–412.
- Bedford, T., and R. Cooke. 2001. Probabilistic Risk Analysis: Foundations and Methods. Cambridge: Cambridge University Press.
- Birnbaum, Z. 1969. “On the Importance of Different Components in a Multi-component System.” In Multivariate Analysis, edited by P. Krishnaiah, 581–592. New York: New York Academic Press.
- Bolbota, V., Trivyzab, N., Theotokatosa, G., Boulougourisa, E., Rentizelasb, A., & Vassalosa, D. (2019). Cruise ship optimal power plants design identification and quantitative safety assessment. Environmental Pollution, 9: 11.
- Čepin, M., and B. Mavko. 2002. “A Dynamic Fault Tree.” Reliability Engineering & System Safety 75 (1): 83–91.
- Corbett, J., and P. Fischbeck. 1997. “Emissions from Ships.” AMERICAN ASSOCIATION FOR THE ADVANCEMENT OF SCIENCE 278 (5339): 823–824.
- Dekker, R. 1996. “Applications of Maintenance Optimization Models: A Review and Analysis.” Reliability Engineering & System Safety 51 (3): 229–240.
- Dikis, K. 2016. “Dynamic Risk and Reliability Assessment for Ship Machinery Decision Making.” In Risk, Reliability and Safety. London: CRC Press in Risk, Reliability and Safety: Innovating Theory and Practice: Proceedings of ESREL, edited by C., F. Group et al., 685–692. Glasgow, Scotland: CRC Press.
- DNV-GL, 2014. Annual Report 2014, Hovik: DNV–GL.
- DNV-GL. 2018. LNG Regulatory Update. Oslo: DNV-GL.
- Dong, C., C. Yuan, Z. Liu, and X. Yan. 2013. “Marine Propulsion System Reliability Research Based on Fault Tree Analysis.” Advanced Shipping and Ocean Engineering 2 (1): 27–33.
- Espiritu, J. F., D. W. Coit, and U. Prakash. 2007. “Component Criticality Importance Measures for the Power Industry.” Electric Power Systems Research 77 (5–6): 407–420.
- Foss, M. M. 2014. “Chapter 9 - LNG Safety and Security Aspects.” In Handbook of Liquefied Natural Gas, 359–435. Houston: ELSEVIER.
- Fussell, J. 1975. “How to Hand-Calculate System Reliability and Safety Characteristics.” IEEE Transactions on Reliability R-24 (3): 169–174.
- Giannakopoulou, E. N., E. I. Thalassinos, and T. V. Stamatopoulos. 2016. “Corporate Governance in Shipping: An Overview.” Maritime Policy & Management 43 (1): 19–38.
- Guan, Y., J. Zhao, T. Shi, and P. Zhu. 2016. “Fault Tree Analysis of Fire and Explosion Accidents for Dual Fuel (Diesel/natural Gas) Ship Engine Rooms.” Journal of Marine Science and Application 15 (3): 331–335.
- Hoyland, A., & Rausand, M. 2009. System reliability theory: models and statistical methods (Vol. 420). John Wiley & Sons
- IACS. 2015. Classification Societies – What, Why and How? London: IACS.
- ICOF. 2020. Compliance with the 2020 ‘Global Sulphur Cap’. London: International Chamber of Shipping.
- IEC 61025. 2006. Fault Tree Analysis (Fta). Geneva: International Electrotechnical Commission.
- IMO. 2014. Implications of the United Nations Convention on the Law of the Sea for the International Maritime Organization. London: IMO.
- IMO. 2018. Revised Guidelines for Formal Safety Assessment (Fsa) for Use in the Imo Rule-making Process. London: IMO.
- Kadam, M. N. P. K. S., & Kulkarni, D. K. D. 2017. “Fault Diagnosis and Experimental Analysis of 4-stroke,4-cylinder Petrol Engine Using Fault Tree Analysis.” International Journal of Engineering Trends and Technology 46 (8): 445–453
- Komal, C. D., and S.-Y. Lee. 2015. “Fuzzy Reliability Analysis of Dual-fuel Steam Turbine Propulsion System in LNG Carriers considering Data Uncertainty.” Journal of Natural Gas Science and Engineering 23: 148–164.
- Kowalski, J., B. Krawczyk, and M. Woźniak. 2017. “Fault Diagnosis of Marine 4-stroke Diesel Engines Using a One-vs-one Extreme Learning Ensemble.” Engineering Applications of Artificial Intelligence 57: 134–141.
- Kwang Pil, C., M. Rausand, and J. Vatn. 2008. “Reliability Assessment of Reliquefaction Systems on LNG Carriers.” Reliability Engineering & System Safety 93 (9): 1345–1353.
- Laskowski, R. 2015. “Fault Tree Analysis as a Tool for Modelling the Marine Main Engine Reliability Structure.” Scientific Journals of the Maritime University of Szczecin 41 (113): 71–77.
- Lazakis, I. 2011. Establishing an Innovative and Integrated Reliability and Criticality Based Maintenance Strategy for the Maritime Industry. Glasgow: University of Strathclyde.
- Lazakis, I., O. Turan, and S. Aksu. 2010. “Increasing Ship Operational Reliability through the Implementation of a Holistic Maintenance Management Strategy.” Ships and Offshore Structures 5 (4): 337–357.
- Lazakis, I., O. Turan, S. Alkaner, and A. Olcer. 2009. Effective Ship Maintenance Strategy Using a Risk and Criticality Based Approach. Instanbul, Turkey, 13th Congress of IMAM.
- Lazakis, I., Y. Raptodimos, and T. Varelas. 2018. “Predicting Ship Machinery System Condition through Analytical Reliability Tools and Artificial Neural Networks.” Ocean Engineering 152: 404–415.
- Lois, P., J. Wang, A. Wall, and T. Ruxton. 2004. “Formal Safety Assessment of Cruise Ships.” Tourism Management 25 (1): 93–109.
- MAN. 2017. Guiding Overhaul Intervals. Augsburg: MAN Diesel & Turbo.
- MARPOL. 2009. International Convention for the Prevention of Pollution from Ships. London: Lloyd’s Register.
- MARPOL. 2018. International Convention for the Prevention of Pollution from Ships. London: MARPOL.
- MARPOL. 2019. International Convention for the Prevention of Pollution from Ships. London: MARPOL.
- Merk, O. 2014. “Shipping Emissions in Ports.” In International Transport Forum. OCED iLibrary. https://www.oecd-ilibrary.org/content/paper/5jrw1ktc83r1-en
- NASA. 2002. Fault Tree Handbook with Aerospace Applications. Washington: NASA Office of Safety and Mission Assurance.
- NUREG-0492. 1981. Fault Tree Handbook. Washington: U.S. Nuclear Regulatory Commission.
- Raptodimos, Y., and I. Lazakis, 2017. Fault Tree Analysis and Artificial Neural Network Modelling for Establishing a Predictive Ship Machinery Maintenance Methodology. London, International Conference on Smart Ship Technology.
- Rasoulzadeh Khorasani, V. 2015. Risk Assessment of Diesel Engine Failure in a Dynamic Positioning System. Norway, Stavanger: University of Stavanger.
- Schieldrop, B. 2018. IMO2020 Report. London: IMO.
- Sharples, J. 2019. “LNG Supply Chains and the Development of LNG as a Shipping Fuel in Northern Europe.” In The Oxford Institute for Energy Studies.
- SINTEF Industrial Management. 2015. “Offshore and Onshore Reliability Data.” In 6 Ed. Trondheim: DNV-GL.
- Soto, J. F., Seijo, R. G., Formoso, J. F., Iglesias, G. G., & Couce, L. C. 2010. Alternative sources of energy in shipping. The Journal of Navigation, 63(3): 435–448.
- Ta, T. V., D. M. Thien, and V. T. Cang. 2016. “Marine Propulsion System Reliability Assesment by Fault Tree Analysis.” International Journal of Mechanical Engineering and Applications 5 (4–1): 1–7.
- Taher, A., I. Lazakis, and O. Turan, 2014. Integration of Business and Technical Aspects of Reliability and Maintenance. Glasgow, International Conference on. Mathematics Textbook Research and Development.
- Turan, O., I. Lazakis, S. Judah, and A. Incecik. 2011. “Investigating the Reliability and Criticality of the Maintenance Characteristics of a Diving Support Vessel.” Quality and Reliability Engineering International 27 (7): 931–946.
- UNCTAD. 2018. Review of Maritime Transport. Geneva: UNITED NATIONS CONFERENCE ON TRADE AND DEVELOPMENT.
- Vedachalam, N., and G. Ramadass. 2017. “Reliability Assessment of Multi-megawatt Capacity Offshore Dynamic Positioning Systems.” Applied Ocean Research 63: 251–261.
- Wang, J. 2001. “The Current Status and Future Aspects in Formal Ship Safety Assessment.” Safety Science 38 (1): 19–30.
- Wärtsilä®. 2018. Wärtsilä 20 Product Guide. Vaasa: Wärtsilä®
- WINGD. 2017. WINGDX72 Operation Manual. Winterthur: Winterthur Gas & Diesel .
- WINGD. 2018a. WINGDX72 Maintenance Manual. Winterthur: Winterthur Gas & Diesel .
- WINGD. 2018b. WINGDX72DF Maintenance Manual. Winterthur: Winterthur Gas & Diesel .
- WINGD. 2019. WINGDX72 Operation Manual. Winterthur: Winterthur Gas & Diesel .
Appendix
Table A.1. WINGD 5 × 72 MTBFs calculations and references
Table A.2. WINGD 5X72DF MTBFs calculations and references
Table A.3. G70ME-C9.5-GI-TII MTBFs calculations and references