?Mathematical formulae have been encoded as MathML and are displayed in this HTML version using MathJax in order to improve their display. Uncheck the box to turn MathJax off. This feature requires Javascript. Click on a formula to zoom.
ABSTRACT
Ammonia fuelled vessels are not a distant reality anymore. This paper will examine whether ammonia constitutes a greater fire hazard than conventional fuel types in the event of an engine room fire. It is to showcase how a realistic engine room fire outbreak can be modelled for a case vessel of 50,000 dead weight tonnage bulk carrier. Four simulation scenarios are then modelled, and their outputs are analysed and discussed. From the simulations process, it was evident that an ammonia fire does not present a greater danger than a diesel or natural gas fire. Ammonia’s fire behaviour was better than the conventional fuel fires with relation to soot formation and potential machinery damage. An ammonia fire provides a better evacuation window; it has more even temperature distribution through the engine space and the developed flame temperatures were lower. The main conclusion of this project is that due to ammonia flammability limits and thermal properties, a dispersion would take time and thus reduce the likelihood of an ammonia fire occurring and is manageable.
Introduction
Today’s marine industry is dominated by ever more strict emission regulations aiming to minimise the global shipping carbon footprint. The International Maritime Organisation (IMO) has set a goal to cut in half shipping emissions by 2050 (Joung et al. Citation2020). Due to all the ongoing changes, shipowners and shipping companies are making an effort to create hybrid vessels powered by low emission alternative fuels. Such fuel alternatives include hydrogen fuel cells, methanol, electricity and ammonia. NH3 or ammonia is one of the most promising fuel sources for several reasons. Firstly, it does not require environments of extreme cold during storage in comparison to hydrogen as it can be stored in a non-cryogenic tank. Additionally, ammonia’s overall cost works out to be cheaper than hydrogen and methanol (Korean Register Citation2020). With its low-volume energy density, it can also be transported in liquid form with relative ease and finally, NH3 can be synthesized using the combination of nitrogen, hydrogen and carbon dioxide. Hydrogen can be produced through water electrolysis, and nitrogen and CO2 can be separated from the air. This results in dual-fuel NH3 engines operating at similar efficiency levels as their conventional counterparts with the added advantage of lower than ever carbon emissions. The production emissions of ammonia are currently an issue of concern, however with the progression of current technology they can be minimised by using renewable energy sources highlighting thus the great environmental aspects of ammonia (Korean Register Citation2020). All those and more benefits created an interest in NH3 fuel capabilities from as early as 1943 where it was observed that automotive NH3 engines showed less wear and tear in the long run than similar conventional fuel engines (Kroch, Citation1945).
However, despite NH3 merits, it is essential to give attention to its safety parameters as well. Safety is a principal factor that can lead to marine fuels mismanagement or enables a small error to prove fatal for the entire ship. Therefore, it is crucial to investigate whether ammonia is more dangerous than conventional diesel fuel before choosing it as a proprietary fuel source. Ammonia as a substance is highly hazardous for humans due to its toxicity and can cause respiratory failures if inhaled or skin burns and irritations if touched. NH3 is also flammable, and it is prone to explode if exposed to high heat concentration (New York State Citation2005). Of course, many fire safety strategies have been put in place to minimise fire and explosion risks on board. However, most of the fire plans and emergency strategies have been designed to apply to the most commonly used fuel sources and not to the new alternative fuel types, such as ammonia. Current research on NH3 fire safety is inconclusive as there have not been extensive modelling simulations regarding a potential engine room fire and its consequences. The importance of extensive risk associated research before using ammonia as a marine fuel is paramount since fire or explosion present one of the most imminent dangers on a ship.
Fire safety should not be taken lightly, especially when almost 10% of all fires onboard vessels lead to personnel injuries and/or fatalities (Anon Citation2014). A major vessel fire can have a catastrophic impact on the ship and environment as it can be blamed for a variety of unwanted events from collisions to cargo spillages. The engine room is one of the most dangerous zones on board as there is a nonstop supply of oxygen, heat and fuel three elements that satisfy the so-called “Fire Triangle” marking the criticality of a fire threat in the area. In fact, according to DNV – GL over 60% of fires initially originate in the engine room of a ship, a place where fuel lines and fuel tanks along with other flammable materials are located. One can easily understand that an uninvestigated risk parameter associated with an NH3 fire hazard could lead to a fire outbreak in the engine room, which can then effortlessly spread throughout other areas of the ship leading to extensive damages to the vessel, crew and surrounding environment (Anon Citation2016). To avoid the devastating consequences of such an event, it is highly important to ensure that the use of ammonia does not constitute a risk – factor for the marine industry. Thus, it is clear that fire safety research is one of the most important factors when thinking of implementing a new fuel source on a vessel. Therefore, this research will be focused on investigating ammonia’s engine room fire safety potential and limitations in comparison to conventional fuel types.
Given this, the principal aim of this paper is to contribute to enhancing and evaluating the overall fire safety of ammonia when utilized as a marine fuel source by investigating hazards related to engine room fire modelling and estimating their risk levels as applied on a case vessel. In addition, it is also to devise a way for hazard management in order to ensure a high level of safety based on the analysis of the results.
Critical review
What is the basis of the topic?
Alternative fuel types are the future since they pave the path towards an emission-free shipping industry, largely benefiting the planet. Almost 3% of world greenhouse gases are produced by conventional fuelled shipping according to an international maritime organisation study. There is a global effort led by the IMO to reduce shipping emissions by at least 50% by 2050 (Joung et al. Citation2020). In the quest for the greener and most efficient fuel, the considered alternatives are methanol, liquid hydrogen, biodiesel and ammonia (Gilbert et al. Citation2018). Ammonia displays several advantages over the other alternatives with the highlights being its low manufacturing costs, the fact that it does not require cryogenic storage in comparison to hydrogen as well as that it is the most energy-dense fuel in between zero carbon fuels, as shown in (Royal Society Citation2020).
Figure 1. Royal society energy density comparison (Royal Society Citation2020).
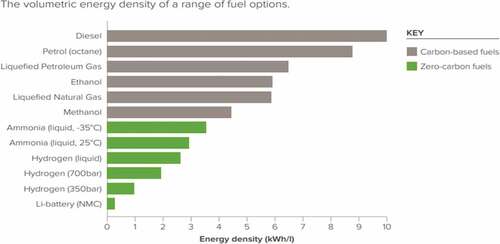
Despite the advantages from an emission point of view, it will be noted from that ammonia has an energy density that is around 35% when compared with diesel and this means that care needs to be taken on the cost consideration. From a practical application point of view, the GHG fuels must establish whether they can be a safe and efficient replacement for conventional diesel. An implementation of a fuel alteration without a consistent safety analysis of the new fuel is extremely dangerous as a safety assessment helps identify underlying hazards, analyse their probability of occurrence and reduce potentially unacceptable risk levels (Han and Weng Citation2011). The goal is to demonstrate that the usage of ammonia lies within tolerable or negligible levels of risk for the industry. The question that needs to be answered clearly is whether ammonia is more or less dangerous with regards to its fire safety than conventional fuel types. It is, therefore, highly important to assess whether NH3 presents a fire hazard and set new safety standards before its application and not after as has happened many times in the past.
One of the most feared hazards onboard a vessel is fire. That is since a fire outbreak can spread quickly to a lot of areas on a vessel and could have truly devastating consequences for the ship itself, the onboard crew and the environment. Although a fire can threaten the entire ship, there are areas onboard where a fire threat is much more imminent. Such an area is the engine room as there is a constant supply of heat, fuel and oxygen – three elements that are crucial for the ignition of a fire. During the vessel’s operation, the engine room auxiliary and main machinery generate a considerable amount of heat with temperatures often exceeding 43°C even though the engine room is very well ventilated (Babicz Citation2015). The heat from the machinery and the oxygen from the supplied air is especially dangerous as fuel tanks, purifiers and fuel lines are located nearby. It is then easily understandable why DNV-GL supports that over 60% of onboard fires start in the engine room and why a consistent fire safety assessment can truly help save lives.
Present approaches for fire safety assessment
The main existing methods for evaluating fire safety are:
Regulatory approach
Good practice approaches, e.g.,, classification rules, trade bodies
Fire safety engineering approach applied to ships
Regulatory approach
Brief description of the method
According to IMO, fire safety regulations are dictated by the SOLAS (safety of life at sea) international convention. The regulations are formed based on past experience and current technology to aid in tackling fire-related problems and situations (Kuo Citation2007). Although regulations are updated constantly, chapter II–2 of the 1974 convention is to this day an excellent guide regarding fire protection, detection and extinction. Through the regulatory method, a fire safety standard can be reached by making sure that all the vessels adhere to the predetermined guidelines and rules.
Its usage
Regulations apply to ship owners, crews and the maritime industry (IMO Citation2015). It is therefore understandable that the regulatory approach to fire safety assessment has a wide and multidisciplinary range of applications. This method is particularly useful as a tool to evaluate fire safety engineering design practices making sure that everything is in line with the latest regulations (IMO Citation2001).
Key merits
The principal merit of this method is that since regulations are drafted based on past accident experiences, a considerable amount of thought and effort has been incorporated to ensure that an acceptable safety standard will be achieved through its implementation (Kuo Citation2007). Furthermore, the method can be applied to any vessel even by relatively inexperienced personnel as the guidelines can be readily understood and applied (IMO Citation2015).
Key drawbacks
The main drawback of this method is the fact that the regulatory framework has a lengthy implementation process. More specifically, there is a considerable delay before proposed regulations become mandatory (Smith Citation1976). Consequently, as technology advances, regulations tend to stay a few steps behind from new technological developments becoming thus a potential obstacle to innovative concepts and ideas (Danish Maritime Authority Citation2017). Another drawback is that the regulatory approach does not explicitly use a management system to evaluate fire safety, allowing thus certain important aspects such as human factors to be overlooked during the method’s application (Kuo Citation2007).
The views of the authors
As it can be concluded, the regulatory approach is very useful when it comes to setting consistent safety standards as the rules are constantly being updated and reviewed (Kuo Citation2007). However, for a fire safety evaluation of a new fuel type such as ammonia, the drawbacks significantly outweigh its merits. Specifically, the literature suggests that the regulatory framework does not effectively catch up with ever-evolving new technologies (Danish Maritime Authority Citation2017). This signifies that a fire safety assessment of a GHG – less fuel would not be feasible in a regulatory-based approach because past experience is practically non-existent and thus regulations cannot yet be drafted to evaluate its safety.
Good practice approaches
Brief description of the method
Good practice approaches for fire safety are aimed at a variety of vessels or activities and are generally achieved through the usage of informal guidelines (Kuo Citation2007). These guidelines are drafted by organizations or individuals aiming to create and maintain certain safety standards. Such organizations are classification societies and international shipping trade bodies. The rules and guidelines are developed and reviewed by field experts as well as from accumulated knowledge in specific fields (IACS Citation2004). According to the international chamber of shipping (ICS), good safety practices aim to establish guidelines prioritizing and ensuring the safety of today’s maritime industry. It should be noted, however, that the guidelines and rules established do not constitute a warranty of safety and thus international regulations must always be followed (IACS Citation2004).
Its usage
Good practice approaches have applicability to a variety of marine-related activities and more specifically, they represent an excellent starting point for a preliminary safety assessment of a situation or activity (Kuo Citation2007). Furthermore, informal guidelines are being used under the umbrella of classification societies globally, in a context, that enhances and establishes vessel-specific safety goals and requirements (IACS Citation2004). The ICS and other well-known trade bodies have also incorporated good practice approaches to safety-related publications aimed at enhancing safety standards for various areas of ships (ICS Citation2020).
Key merits
The main merit of employing a good practice approach to a fire safety evaluation is that often informal guidelines directly reference or are based on IMO – SOLAS regulations. This means that the rules have been given thought to identify and refine potential gaps to the regulations so that they are understandable and applicable to a variety of systems and situations (ABS Citation2017). Moreover, the format and good organization of the guidelines make them particularly user-friendly even to individuals that are unfamiliar with their purpose (Kuo Citation2007).
Key drawbacks
One of the key disadvantages of this method is the advisory format of the guidelines that does not provide a good standard for consistency in evaluating complex safety aspects of a system (Kuo Citation2007). Additionally, the voluntary nature of the approach signifies that its effectiveness is directly determined by whether the shipowner wants to adapt to the recommended procedures (IACS Citation2004). Finally, the fact that the guidelines have to go through a lengthy review process before their implementation means that it would take time and effort for them to change or readjust to the needs of a new novel system (Kuo Citation2007).
The views of the authors
Good practice approaches are very useful as a first step in either assessing the safety of a new concept or monitoring whether existing safety standards have been introduced according to the guideline recommendations (ICS Citation2020). Nevertheless, in the case of GHG – fewer fuels this approach would not be very effective in predicting and regulating a fire scenario. This is the case because ammonia and other similar fuel types are still novel ideas and there is no conclusive evidence as to whether a good practice recommendation would be effective or not. Moreover, the guidelines often fall under the generally advise scope and do not provide any quantitative strategy on how to evaluate the safety of a new concept.
Fire safety engineering approach applied to ships
Brief description of the method
The fire safety engineering method refers to the design and evaluation of structures so that the effects of fire lead to minimum damages and loss of life (Purkiss and Li Citation2013). Through fire safety engineering, a comprehensive study of various fire stages and their impact on the structure takes place. The evaluation of fire safety levels happens through detailed computer simulations that allow for the visualization of fire-related effects on materials (CTSB Citation2018). The methodology allows experimentation with differently specified fire scenarios to predict performance outputs in the event of a fire (Sprague and Dolph Citation1996).
Its usage
The method of fire safety engineering can be introduced to any scenario where fire poses a major hazard (Purkiss and Li Citation2013). The approach has many practical applications in the building, oil and gas, as well as shipping industries (CTSB Citation2018). In the maritime sector, the approach has been extensively used under the SFSEM acronym, which stands for ship fire safety engineering method (Sprague and Dolph Citation1996). SFSEM has been mainly utilised to provide an integrated framework for analysing potential fire-based situations on board different vessels (Sprague and Dolph Citation1996).
Key merits
The principal merit of this method to fire safety evaluation is that a wide range of systems can be modelled and analysed (CTSB Citation2018). The use of computer simulations means that a variety of fire-related aspects can be analysed without the need for complex and costly experiments (Wegrzynski and Sulik Citation2016). Furthermore, another advantage of this approach is the flexibility and integration that comes with it as it allows the user to model different aspects, time rates and behaviour of fires within the same simulation (Sprague and Dolph Citation1996). Finally, through the virtual environment of this approach one can easily model systems and situations that are near or outside the boundaries of the regulatory scope, enhancing thus further the understanding of fire behaviour (CTSB Citation2018).
Key drawbacks
One of this method’s drawbacks is the fact that the SFSEM constitutes a complex methodology and, therefore, it requires a well-qualified team of users to be effectively applied (Sprague and Dolph Citation1996). Additionally, although the use of software modelling is widely regarded as a more trustworthy approach in comparison to traditional experiments, a simulation of a complex fire scenario would be extremely resource-demanding (Wegrzynski and Sulik Citation2016). This means that an attempt to simulate a fire model that is too complex or extensive can lead to inaccurate or poorly visualised results if not backed up by the required computational power.
The views of the authors
It is easily understandable that the fire safety engineering approach applied to ships has both advantages and disadvantages when it comes to safety evaluation. This method, however, can prove to be of great importance for other GHG fuels. More specifically, the fact that computerised modelling allows for complete freedom concerning the simulation characteristics and inputs presents a great advantage over traditional safety assessment methods. Under these conditions, novel concepts such as ammonia and other GHG fuels can be easily evaluated for their fire behaviour onboard.
Ammonia as a marine fuel
Brief description of the method
The use of ammonia as a fuel source for internal combustion engines has been considered from as early as 1943 when it was utilized in motor bus engines (Kroch Citation1945). In recent years, with the international maritime regulations pushing for lower emissions in global shipping, ammonia has been reconsidered as a greener alternative to conventional marine diesel (Hansson et al. Citation2020). More specifically, early experimentation has shown great potential for this fuel source since it is practically emission-free and relatively easy to manufacture. A significant milestone for the industry is to complete the manufacture of the ammonia-based dual-fuel engine by 2024, evaluating thus its real-world applications (Laval et al. Citation2020).
Its usage
Ammonia can be used for marine propulsion either in internal combustion engines or in fuel cells (Fridell, Hansson, and Brynolf Citation2020). Recent studies have concluded that further developments to the existing compression and spark-ignition engines are needed, for ammonia to be burned efficiently. In the case of fuel cells, ammonia can be used directly as a fuel source or divided into hydrogen and nitrogen in which case hydrogen becomes the principal fuel used (Hansson et al. Citation2020).
Key merits
One of the main advantages that ammonia displays is its vast environmental benefits in comparison to conventional fuel sources. More specifically, ammonia has no sulphuric or carbon contents meaning that it can be naturally absorbed from the environment (Laval et al. Citation2020). Additionally, it can be manufactured solely from renewable energy resources, which are practically unlimited, especially in comparison to fossil fuels (Fridell, Hansson, and Brynolf Citation2020). Finally, the storage of ammonia is cheaper and less complicated in comparison to its main GHG-less competitor, which is hydrogen (Royal Society Citation2020).
Key drawbacks
The key drawback is the energy density of ammonia compared with diesel. Another significant drawback is its chemical nature. As a substance, ammonia is corrosive and highly toxic and can prove fatal if inhaled for prolonged periods at high concentrations (Hansson et al. Citation2020). Moreover, a potential ammonia spill to the sea could have devastating consequences to marine life ecosystems (Royal Society Citation2020). Finally, to overcome some of its corrosive properties, minor modifications to existing engine technologies are needed, signifying that there is an added cost to ammonia’s implementation in internal combustion engines (Dimitriou and Javaid Citation2020).
The views of the authors
Overall, ammonia seems to be one of the leading competitors in the battle for the best GHG – less fuel. However, some characteristics still need further research before the final application, with first and foremost being the safety aspects of this new fuel source. The literature suggests that additional models examining ammonia’s toxicity and fire behaviour need to be created so that a potential ammonia application is supported on a solid safety foundation. A foundation that can also be used to further enhance global maritime standards and regulations on alternative fuel types.
Research topic selection
Based on the previous section, it can be concluded that certain aspects of ammonia are more developed than others. To summarize, the main research areas that were considered as candidates for this research project included the following:
R(a): Enhancement of ammonia’s energy density and availability.
R(b): Fire safety assessment of ammonia as a marine fuel.
R(c): Toxicity analysis of an onboard ammonia leakage.
R(d): Efficiency improvement of an ammonia internal combustion engine.
To effectively decide on one of these topics, a concept selection matrix was used to efficiently evaluate each topic based on several selection criteria. The criteria adopted were the following:
C1: Available resources and references
C2: Relevance to marine engineering
C3: Personal preference
C4: Feasibility of project within specified time-frame
C5: Potential contribution to industry
To compare selected criteria against topics, a weighing scale was introduced measuring from 1 (least important) to 7 (most important). Once every parameter was set, was formulated highlighting the final research choice:
Table 1. Selection matrix
As it can be seen from the above table, the topic that satisfied most of the selection criteria set was the fire safety assessment of ammonia in its marine fuel form.
Through a systematic fire safety assessment on a case vessel, the obtained data could have a meaningful impact on the entire industry. It is of crucial importance to highlight that ammonia is fire-safe, especially in comparison to conventional fuel types to lay the foundation for its safe adaptation to shipping. A positive experimental result from a simulation can help ship owners and shipping companies to formulate a fire prevention strategy able to reduce the risks of ammonia fires to as low as possible. Furthermore, an emergency preparedness plan with the ability to minimise the effects of a fire involving ammonia can be created aiming to significantly reduce loss of life at sea. Additionally, a simulation-based fire safety assessment can give an insight to the industry regarding the characteristics of a real-world ammonia fire accident, allowing for the prediction of its onboard fire behaviour. This would be a significant breakthrough as instead of relying on data from other industries, it would be possible to start building a database involving different types of vessels and fires aiding in the creation of a holistic ammonia safety management system. Nevertheless, future researchers need to be able to back ammonia fire safety statements with data, which is why this project is focused on proving whether ammonia is a safer alternative from a fire perspective in comparison to traditional fuel types.
Research methodology
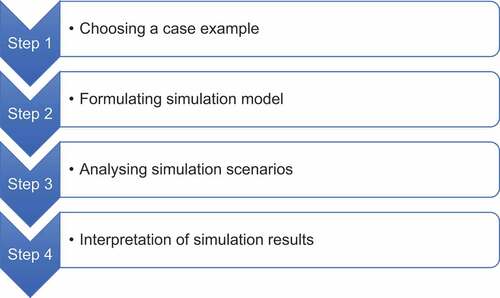
To successfully evaluate ammonia’s fire behaviour and assess its safety in comparison to traditional marine fuel types, a suggested clear methodology is outlined: in .
Figure 2. Outline of methodology.
Selection of case example
Once the current approaches for evaluating fire safety on board were critically reviewed, a case ship needed to be selected to successfully perform a case study on the subject.
Several vessels were considered on a preliminary stage, based on a variety of selection criteria. Perhaps, the most important of those was how easy would it be to theoretically modify the ship to allow for an ammonia fuel conversion. Initially, this was a challenging aspect because no ammonia fuelled vessel exists so that it could be used as a basis ship. Nevertheless, after some research, the desired vessel was found to be Ilshin Green Iris, the world’s largest LNG fuelled bulk carrier (Hwang and Jung et al. Citation2019). The ship comes with a pre-installed high manganese steel tank meant for the storage of LNG; however, it can also be used to store ammonia as well with a minor modification regarding the replacement of the pre-installed cryogenic pump with a smaller one as ammonia has significantly lower cooling needs, when stored as a liquid. The Korean managed vessel is currently the largest LNG fuelled bulk carrier with a deadweight of 50.000 tons and also the world’s first ship to be designed according to the IGF code (Hwang and Jung et al. Citation2019). The ship’s main particulars are given in .
Table 2. Case vessel characteristics
Initial modelling and validation
Engine room 3D modelling
Once the case vessel selection process was finished, an initial three-dimensional model of the selected vessel engine room was developed for simulation purposes. Due to the complexity of the engine room machinery, piping and asymmetrical geometry, a simpler approach was utilized to shorten simulation run-times. This approach is also in line with the vast majority of previous engine room fire studies as it is concluded that a fire simulation can be performed successfully under these conditions (Su and Wang Citation2013). In this case, the engine room consists of three decks and only the principal machinery and spaces, such as the control and workshop rooms, generator sets, air compressors, purifiers and main engine are modelled. The model consists of three decks and the cutaway on the ceiling of the top deck was designed as a funnel and pipeline exit. For the model generation, AutoCAD 3D was utilized and the space’s principal dimensions are presented in .
Table 3. Engine room dimensions
Highlight of fire simulation methodology
As highlighted from the critical review, perhaps the best approach to evaluating the fire safety of a novel fuel source such as ammonia is provided by fire safety engineering through the means of computerized modelling. For this reason, a CFD (Computational Fluid Dynamics) software tool can be especially helpful when modelling fire. For this project, the Fire Dynamics Simulator (FDS) was utilized to simulate the desired fire behaviours of each fuel type. FDS was developed as a joint project between the American National Institute of Standards and Technology (NIST) and the VTT technical research centre in Finland and was made available to the public in 2000 (Mcgrattan et al. Citation2013). The simulator (FDS) employs a numerical form of the Navier – Stokes equations concerning thermal flow, to analyse fire and smoke propagation (Mcgrattan et al. Citation2013). Usually, the FDS solves a Large Eddy Simulation (LES) mathematical turbulence model; however, in this case a Very Large Eddy Simulation (VLES) hybrid model was selected for its improved accuracy and ability to combine various advantages from different turbulence models such as RANS. LES and DNS (Han and Krajnović Citation2015). The FDS simulation outputs are visualized by the SMV (Smokeview) software, which is also industrialised by NIST and VTT. The FDS graphical user interface that was selected for this study was PyroSim, a fire modelling software developed by Thunderhead Engineering.
Simulation scenario analysis
Using the FDS software fire modelling tool, two scenarios were first performed as follows:
S1: An ammonia fire
S2: An ammonia gas dispersion
For comparison purposes, two further scenarios were modelled:
S3: A Liquefied Natural Gas (LNG) fire
S4: A Marine Diesel Oil (MDO) fire
The details of the simulation results for S3 and S4 are given in the Appendix.
For each case, the modelling process was focused on studying the fire behaviour and characteristics of each fuel source. More specifically, the aim was to examine what impact a potential fire and its gas dispersion would have on the engine room, crew and machinery in order to determine the consequences of such an accident. For this reason, in each of the simulated cases the following important outputs needed to be closely modelled:
Oxygen concentration levels at different stages of the simulation in each of the engine room decks.
Temperature distribution and flame temperatures across the engine space.
Visibility and smoke propagation during the fire scenarios.
Toxicity levels from the combustion products of each fuel source at a range of simulation times.
According to the United States Department of Labour Occupational Safety and Health Administration (OSHA), oxygen availability below 19.5% concentration is officially characterized as an oxygen deficiency and can lead to very serious health problems. Although engine rooms are usually well ventilated both actively and passively, oxygen levels are of paramount importance for the crew’s well-being. The modelling of temperature distributions is also highly important as they can help monitor critical machinery damage levels as well as thermal radiation levels. Direct exposure to a 10 kW/m2 thermal radiation can prove fatal within only 60 seconds (Department of Transportation, United States Citation1989). Visibility levels are another important factor when simulating a fire as a very quick smoke propagation could significantly reduce engine room visibility levels, impairing thus the crew’s ability to effectively evacuate. Finally, the combustion products of each modelled fuel include carbon dioxide (CO2), carbon monoxide (CO) and nitric oxide (NO), three highly toxic substances whose inhalation in the event of an accident must be kept to the minimum concentrations specified by OSHA i.e., 35ppm for CO, 25ppm for NO and 5000ppm for CO2, where ppm stands for parts per million. Details regarding the strategies followed for the simulated scenarios are presented below:
S1: ammonia fire
Although many of ammonia’s fuel properties have been analysed in previous chapters of this project, it is important to note the following. NH3 or ammonia is a completely carbon-free fuel that has the potential to alter global shipping emission levels once it is widely accepted as a marine fuel source. Ammonia is highly toxic and flammable at large concentrations and, therefore, it is very important to assess whether an engine room fire involving ammonia is more or less dangerous than a conventional fuel fire accident in the same environment. Since an ammonia engine room fire simulation has never been performed to this date, its chemical composition and combustion reaction had to be imported manually to PyroSim along with its combustion properties that were taken from the SFPE Handbook. Ammonia is stored at atmospheric pressure at −33.6°C as a liquid and it evaporates as the temperature rises (Korean Register Citation2020). Furthermore, it has a very high auto-ignition temperature at 650°C, and its flammability limits are lower than other fuel types, creating thus difficulties for the fire simulation (Korean Register Citation2020). For this project, an initial assumption was made that ammonia’s leakage occurred with it being at exactly −33.5°C in the liquid state and then as the leakage concentration increased, it turned into a gas and ignited.
S2: ammonia gas dispersion
The gas dispersion of ammonia was modelled due to the fuel’s chemical composition. To begin with, the fact that ammonia does not contain any carbon products created difficulty during the fire simulations as the conventional measuring devices for toxicity in the engine room space did not display the desired accuracy. Furthermore, ammonia’s flammability limits between 15% and 28% by volume in the air mean that for a fire to occur, gaseous ammonia needs to reach the required minimum values (Kim et al. Citation2020). Consequently, a gas dispersion needed to take place to effectively evaluate the consequences of an ammonia leak for a wider spectrum of simulation run-times, allowing thus for a better understanding of the potential impact of an ammonia accident scenario. For the gas dispersion to be modelled successfully, the ammonia leakage rates had to be calculated as well as the specific gaseous properties of ammonia during the leak process. The main assumption for the gas dispersion modelling was that ammonia is released from a pipe immediately as a gas, disregarding thus any losses from ammonia’s rapid liquid phase at the start of the leakage. This initial condition resulted in slightly higher final concentrations in the engine space, without, however, compromising the entire simulation outputs.
Modelling setup
The AutoCAD generated engine room model was imported to the PyroSim interface as a few modifications were essential before the simulation process could begin. First of all, a mesh validation calculation was made to determine whether the automatically determined mesh size was reasonable for the simulation demands. PyroSim comes with an integrated tool for appropriately modifying mesh sizes according to the characteristic fire diameter and after some trial and error, a coarse mesh of 90,000 cells was formed around the model. Secondly, the ventilation capacity of the engine space had to be determined. After studying the machinery drawings of the case vessel, it was decided that four active exhaust vents would be placed in the engine room model. In order to determine the airflow of the exhaust vents, the subsequent procedure was followed. As described in , the engine room volume was found to be 8064 m3 by multiplying its length, beam and height. According to the International Code of Safety for Ships (IGF), the minimum ventilation capacity for machinery spaces is 30 air changes per hour (IGF Citation2015). Thus, the ventilation capacity can be expressed by using the following formula:
Finally, for the exhaust vent airflow calculation, the above number needs to be divided by the number of exhaust vents in the engine space that in this case were four. Thereby, 67/4 = 16.75 is the airflow of each exhaust vent, and they were positioned in the lower and middle decks of the engine room. Moreover, due to the fact that engine rooms have also passive ventilation and are not air-tight spaces, two more open vents were placed on the top-engine room deck, to showcase the natural ventilation of the space. Lastly, a big cutaway on the ceiling of the top-engine room deck designed for funnel and pipeline exits was also characterized as an open vent.
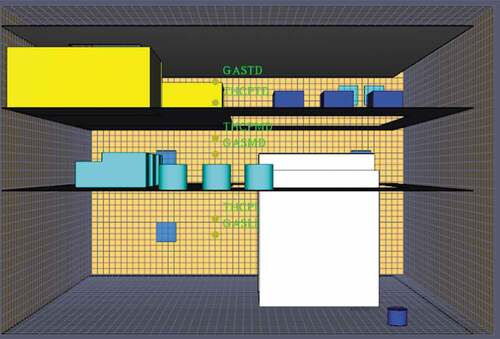
The next step was to specify the location and characteristics of all the measuring devices that were needed to generate the desired modelling outputs. In detail, based on the specifications of the IGF Code, thermocouples, gas-detectors, and smoke detectors were placed on each of the engine room decks. Furthermore, 2D slices for temperature, oxygen levels and visibility were also placed near the fire and dispersion area as well as near the control and workshop of the engine space. Finally, the software was configured so the heat release rate and thermal radiation levels of the simulation to be measured automatically. , shows the Pyrosim model in its final form.
Figure 3. Engine room modelling with mesh and measuring devices in place.
Due to the fact that the fire simulations were set to originate from fuel leakages, a pool fire was selected as the most appropriate fire type for this study. Pool fires have been well developed over the years and have applications on a variety of combustible materials (Freeman Citation1990). The simulation duration was set at 5 minutes or 300 seconds and thus each simulation’s run-time was around 4.30–5 hours.
Assumptions and initial conditions
A brief description of the assumptions used for each fuel type can be found in section 4.3 of this paper, however it is important to note a few more regarding the simulation process and the initial conditions of the modelling. To begin with, the materials of the machinery and decks were set to steel in order to improve the accuracy of the temperature distributions throughout the engine room. Furthermore, the pressure of the engine space was set to 1 atm, the ambient temperature to 35°C and the main engine and generators were assigned an operating surface temperature of 60°C. Moreover, the thermocouples and gas detection devices were set to take one measurement per 5 seconds of simulation time. For the fire modelling, a rectangular burner surface was specified at the starboard side of the lower engine room deck, close to the main engine with a total area of 6 m2. A vent facilitates the fuels supply to the fire area, at which the initial temperature was set at 500°C to aid with the combustion process.
Simulation results
In total, 49 simulations were performed with an overall run-time of 240 hours. The key results for the ammonia fire and gas dispersion are presented below, whilst the simulation outputs for the LNG and MDO fires can be found in the appendix section of this paper.
Scenario 1 – ammonia fire
The third simulated fire case involved an ammonia fire. Ammonia’s combustion equation was not pre-defined in the PyroSim library, and hence the equation was imported and stoichiometrically balanced manually. The formula used for the definition of ammonia’s combustion products is presented below:
Temperature distribution and heat release rate
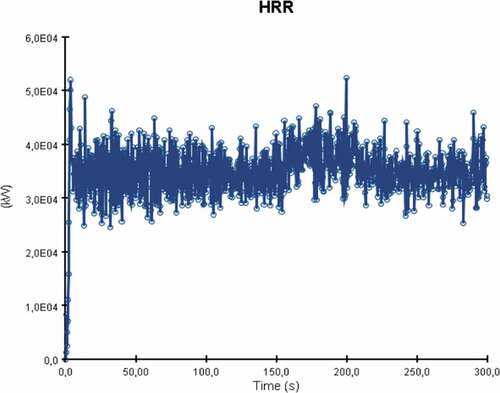
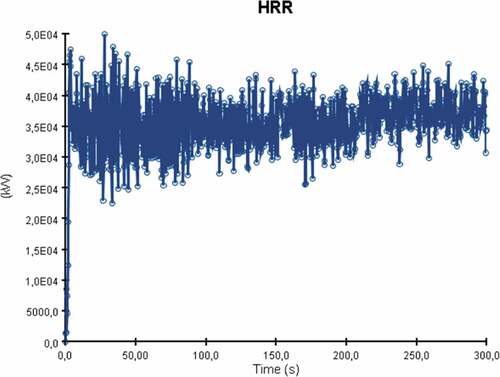
The heat release rate plot of the simulation is presented in . The graph is different from the other two simulated cases as despite the graph’s fluctuations due to turbulence, there is also a clear point where the fire seems to decay.
Figure 4. Ammonia fire heat release rate over time.
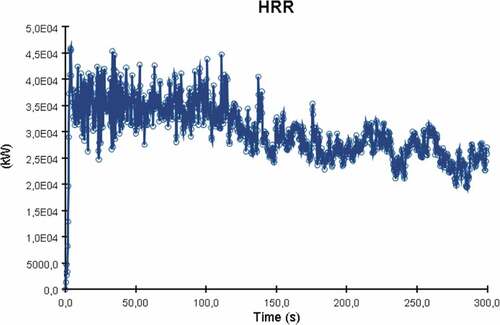
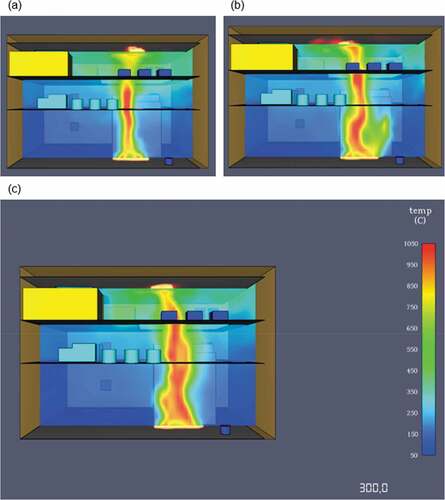
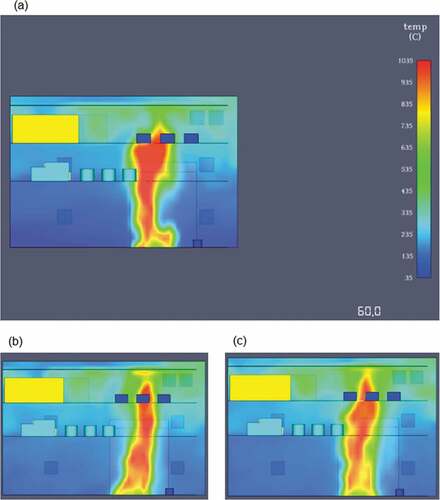
The HRR reaches a peak at approximately 120 seconds with the average heat release value beyond that point being around 35,000 kW. After the 130 second mark, the heat release rate values decrease over time. This is a result of many factors such as the engine space ventilation or perhaps limited fuel supply leading to incomplete combustion. Nevertheless, in this case the most important contributing factor to ammonia’s fire deterioration over time is the fuel’s thermophysical properties. Essentially, due to the limited flammability limits and very high autoignition temperature, ammonia’s concentrations increase towards an area where it isn’t as flammable as before. This result signifies that in order to sustain an ammonia fire for longer, higher initial temperature and output specifications are required for the burner surface. The temperature distribution of the fire towards the engine room decks is considerably lower than in the previously discussed scenarios. As a result of the heat release rate plot, flame temperatures were also lower for ammonia in comparison to LNG or MDO as the maximum recorded value never exceeded 785°C (see ).
Figure 5. Temperature distributions at: (a) 60 sec (b) 180 sec (c) 300 sec.
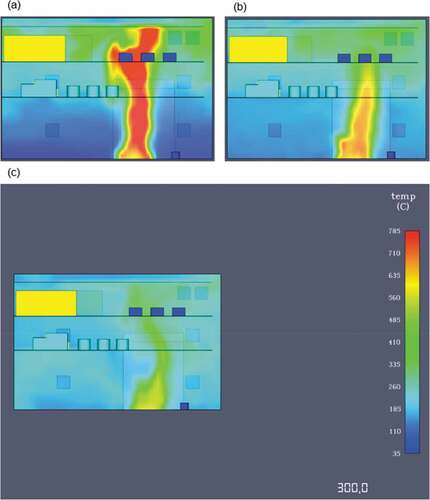
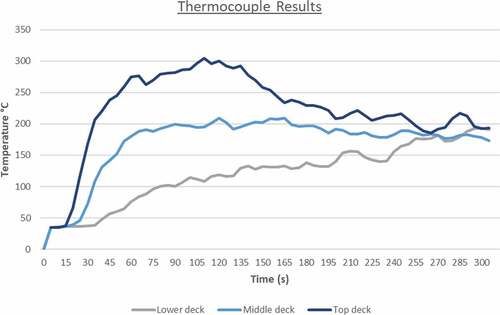
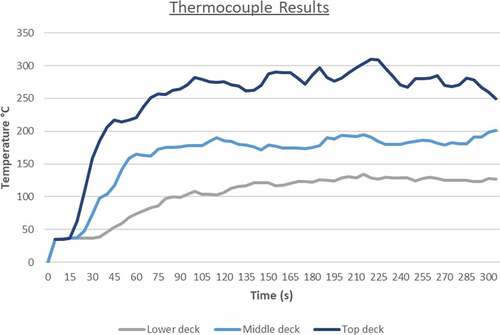
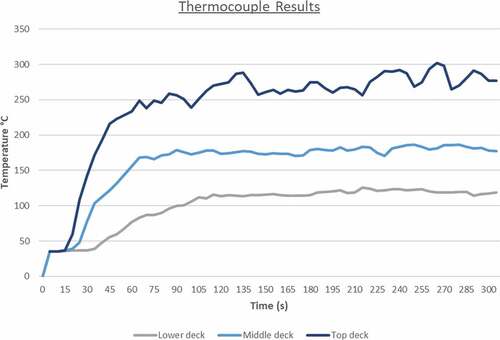
As it can be seen from the above figure, the first 60 seconds of the simulation are the most critical for machinery damage due to the fire propagation and larger flame temperature. After the first minute, the temperature levels decrease slightly until the end of the simulation at 300 seconds where there is an almost equal temperature distribution throughout the engine room. The thermocouple data output presented in showcase that this case has been the friendliest towards machinery and crew as the fire effects are not as severe as in the other simulated situations. The values converge after 260 seconds to around 180°C that might be too high for human survival but it is adequate for machinery survival and equipment survival.
Figure 6. Thermocouple simulation outputs.
Toxicity and visibility levels
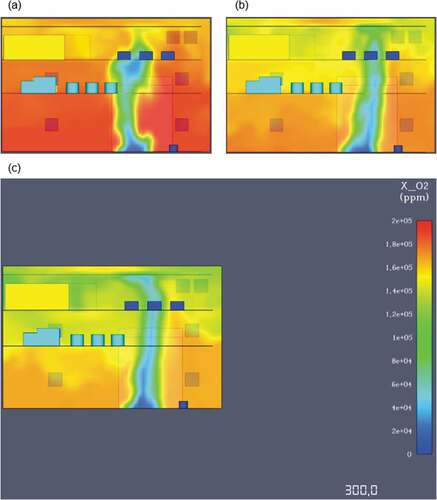
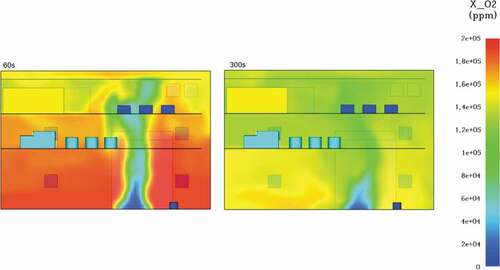
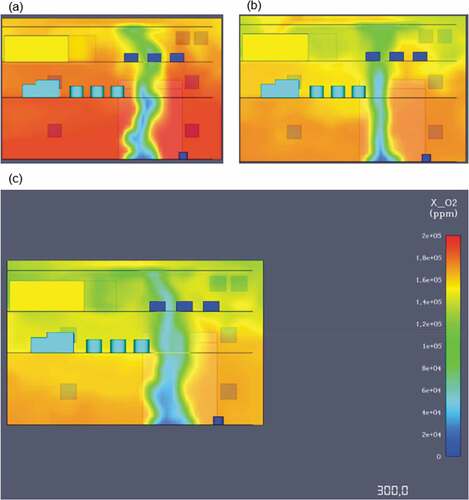
One of the main advantages of ammonia is the fact that it is a truly carbon-free fuel. Due to the absence of carbon combustion by-products and soot development, an ammonia fire offers excellent visibility for fast and effective evacuation. Contrary to the previous simulations, the ammonia fire does not produce carbon monoxide or dioxide and hence they were not taken into account for this case. The oxygen levels measured during the fire simulation showed that after 1 minute of modelling, there is barely enough oxygen at approximately 180,000ppm. As the time progresses after the first minute oxygen levels continue to drop until there is a lethal deficiency at around 110,000ppm. presents an image highlighting the critical oxygen loss from the first simulation minute until the last.
Figure 7. Oxygen levels at 60 and 300 seconds respectively.
Scenario 2 – ammonia gas dispersion
Ammonia is a highly toxic substance by itself and for this reason the gas dispersion was performed in order to effectively analyse ammonia’s concentrations in the event of a leak. In order to effectively perform a gas dispersion, the leakage rate of the fuel needs to be determined. For this purpose, the ammonia’s leakage was assumed to be happening from a 50 mm hole of a supply pipeline, which was then upscaled to 0.5 m2 for the simulation purposes. The leakage location was set at the lower deck of the engine room at the starboard side of the main engine. In order to calculate the leakage rate from the hole, ammonia’s thermophysical properties along with the below formula taken from DNV were used:
Where:
is the gas release rate at
, d is the hole diameter,
is the gas density and
is the gas pressure measured in bar.
The leakage rate was therefore calculated as 0.4227 . Ammonia was then introduced as a Species in the Pyrosim environment and a tracer particle was utilised in order to aid with the visualization of the concentrations during the modelling.
Particle distribution
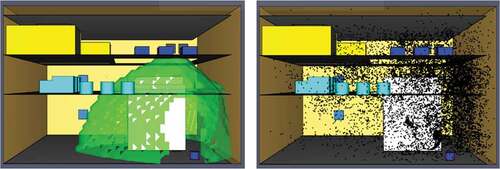
Once the modelling was finished, the simulation output showed that at 300 seconds, ammonia’s particle cloud had almost entirely covered the engine space, meaning that the concentrations at 5 minutes were too large and therefore evacuation needs to take place at an earlier stage. Interestingly, at 60 seconds the gas dispersion was fully developed only on the lower deck and around the main engine area, where the leak initially took place. As it is presented in , there is only minimal ammonia concentration on the top and middle deck, signifying that enough time for evacuation after an ammonia dispersion exists.
Figure 8. Particle distribution at 60 seconds.
Toxicity analysis
The gas detector outputs showcasing ammonia’s volume concentrations during the simulation are presented below. As it can be seen in , there is a significantly larger time window available for evacuation in comparison to the fire simulation.
Figure 9. Gas detector simulation outputs.
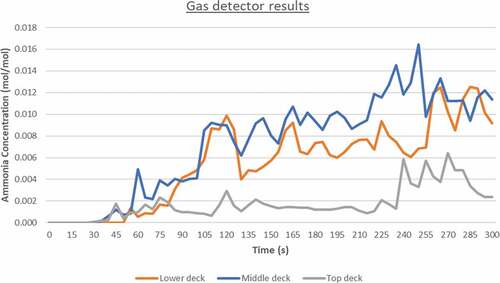
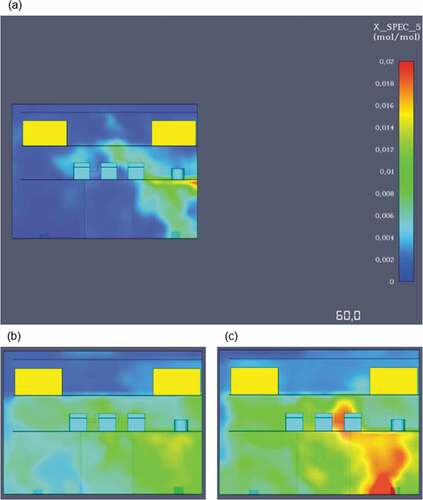
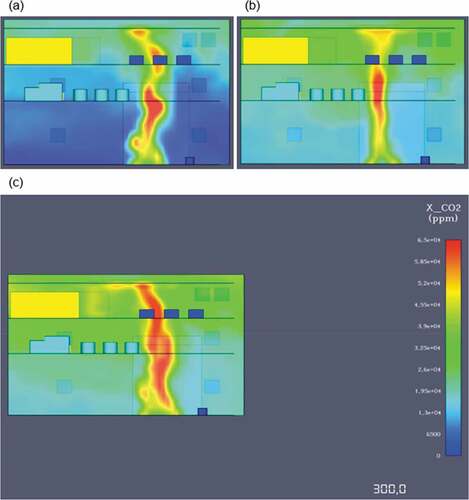
The above graph, highlights that at least 30 seconds are needed before the dispersion initial development. Ammonia’s concentrations are significantly higher on the middle and lower decks due to the larger number of obstructions found in those decks as well as due to the exhaust vent locations. The active exhaust vents are placed on the lower and middle decks and hence ammonia’s particles are drawn towards the vent locations. Furthermore, the maximum value recorded was approximately 0.017 in volume concentration, which translates to 17,000ppm. The simulation outputs are also shown in the figure below, confirming that an ammonia dispersion has the lowest impact on the top deck and that the maximum evacuation limit should be set before the 60 second mark from the leak (see ).
Figure 10. Gas concentrations at: (a) 60 sec (b) 180 sec (c) 300 sec.
Summary of main results
According to OSHA, a 5-minute exposure to an ammonia concentration of 5.000 ppm is lethal. From the simulations, it is evident that those concentration levels during an ammonia leak and subsequent gas dispersion are achieved after 90 seconds in the lower and middle decks and after 230 seconds in the top engine deck. As stated in section 5.1, ammonia’s flammability limits are between 15% and 28% by volume in air meaning that in this case, the engine room would be under fire danger after 220 seconds of dispersion. Ammonia’s fire simulation outputs showcase that there is a 25–30 second window for evacuation before thermal radiation levels threaten human life.
Comparing those values to the simulated diesel or LNG fire, one can understand that ammonia displays better overall fire behaviour and extinguishing properties. The evacuation time window is almost double for the ammonia fire, and the visibility conditions during an accident are superior to other fuel fires. Furthermore, ammonia’s lower flame temperatures and overall heat distribution around the engine room are beneficial for the machinery and equipment as with an effective fire extinguishing system, critical damage levels can be avoided. From the three simulated fire scenarios, the MDO fire seems to have the potential for higher damage levels due to the almost minimal visibility created by swift smoke propagation and large thermal radiation levels. The LNG fire follows closely with better visibility and toxicity levels but still with very high flame temperatures and life-threatening thermal radiation levels from the beginning of the fire.
, presented below, provides a comparison between the main simulation features and the different fire scenarios modelled, highlighting that an ammonia fire appears safer in comparison to an LNG and an MDO fire. The compared aspects are characterised by three different levels, namely low (L), medium (M) and high (H).
Table 4. Comparison of simulated features
Ammonia, therefore, is displaying a number of advantages and although an ammonia fire or gas dispersion would still be life threatening, it would not be as dangerous as the simulated conventional fuel fires. Due to ammonia’s high autoignition temperature and narrow flammability limits, there is an adequate time window for evacuation in the early stages of the dispersion and before NH3 concentrations become a fire hazard. Finally, another advantage of ammonia over the other fuel types is that it has a very distinct odour limit at approximately 10 ppm meaning that an ammonia leak can be very easily perceived by the crew even if the gas detection system malfunctions. Therefore, it can be concluded that ammonia leaks can be very easily detected and that there is significantly more time for applying emergency procedures in comparison to conventional fuel accidents.
Discussion
Lessons learned
Writing a dissertation for the first time can be a very challenging task as it requires excellent time management and organization skills along with ample motivation for research. Time and overall administrative qualities are vital for the successful completion of the research. Due to the variety of activities involved, information organization is key for effective resource classification. Furthermore, through this research, the importance of critical thinking was also understood, as it is the foundation for any undertaken research work. Moreover, results and approaches should always be critically verified as software over confidence can often lead to unrealistic results.
Future research aspects
Due to the pre-specified time frame for the completion of this study and overall simulation times, certain aspects were overlooked and therefore can be extensively analysed in future research, improving thus the current simulation outputs. A few suggestions regarding future development ideas are presented below:
Frequency analysis for different ventilation capacities for the fire and gas dispersion scenarios
The frequency analysis would be beneficial for this research as the cumulative leakage probabilities for each fuel source can be calculated. A pipeline diagram specifying the supply process for each fuel type needs to be designed and the leakage rates for each component of the said system need to be calculated. It would be very interesting to explore different diameter leakage locations combined with higher ventilation capacities in order to fully explore the probable consequences of an ammonia fire and dispersion.
Engine room HVAC system design and evacuation modelling
For this research, the ventilation specifications were based on the case vessel and the exhaust vent locations were selected without conducting an extensive analysis on the turbulent airflow effects. In the future, it would be useful for a custom HVAC system to be designed taking into consideration the specific aspects of each fuel source modelled. In that way, the optimal active and passive ventilation capacities can be determined and the energy efficiency of the engine space can be increased. Moreover, it would be useful to use a specialized evacuation modelling software in order to simulate and design the optimal evacuation route for the engine room crew.
Comparative fire safety assessment against other GHG – less fuels
This study focused on comparing ammonia’s fire behaviour against the most common conventional fuel sources, such as diesel and natural gas. Based on the ever-changing emissions regulations, it would be beneficial for the project and the industry if a similar analysis was performed by comparing greener fuel alternatives. In that way, ammonia can be directly compared with other perspective future fuel alternatives, such as hydrogen, biodiesel, methanol or LPG.
Contribution
This paper makes a meaningful contribution to the continuous research for maritime safety enhancement. Due to the novelty of the subject, very little research has been published that investigates ammonia’s safety characteristics and especially fire safety through CFD modelling. Therefore, the undertaken simulations for an ammonia fire and gas dispersion can be used as a theoretical foundation for future research to be built upon. Moreover, the analysis of the key advantages and shortcomings for the current fire safety assessment techniques can help researchers understand which aspects of those methods are in need for further development in order to cope with novel and innovative future concepts. Finally, the paper makes a contribution to the argument for the use of ammonia in the marine industry by highlighting that the fuel is equally and, in some cases, less dangerous than its carbon-based rivals. For this reason, further development is crucial as a global ammonia implementation can truly aid to the global shipping emission reduction necessity.
Conclusions
There are the following main conclusions:
Firstly, an ammonia fire scenario has a low likelihood of occurrence even after a direct ammonia leak due to the fact that sufficient time needs to pass in order for the fuel’s concentrations to be within its flammable limits.
Secondly, while the ammonia’s toxicity levels during an accident were relatively high but due to time delay to ignition it provides a larger evacuation time window before the effects became threatening to the on-board crew.
Thirdly, although ammonia’s fire behaviour was excellent under the simulated scenarios, there is scope for improving the results by designing and simulating by introducing, for example, a better heating, ventilation and air conditioning (HVAC) system for the engine space.
Lastly, there is a need for more research studies in areas relating to fire safety management of GHG-less fuels during their production and on-board operation while increasing their energy densities safely.
Abbreviations
| CFD | = | Computational Fluid Dynamics |
| DNV | = | Det Norske Veritas |
| FDS | = | Fire Dynamics Simulator |
| GHG | = | Green House Gases |
| HVAC | = | Heating Ventilation and Air Conditioning |
| IACS | = | International Association of Classification Societies |
| IARC | = | International Agency for Research on Cancer |
| IGF | = | International Code of Safety for Ships |
| IMO | = | International Maritime Organization |
| LES | = | Large Eddy Simulation |
| LNG | = | Liquified Natural Gas |
| MDO | = | Marine Diesel Oil |
| NIST | = | National Institute of Standards and Technology |
| OSHA | = | Occupational Safety and Health Administration |
| RANS | = | Reynolds Averaged Navier Stokes |
| VLES | = | Very Large Eddy Simulation |
Disclosure statement
No potential conflict of interest was reported by the author(s).
References
- ABS. 2017. Guidance Notes on Fire-Fighting Systems FIRE-FIGHTING SYSTEMS FIRE-FIGHTING SYSTEMS. [Online]. Available from: http://www.iacs.org.Uk/publications [Accessed 29 December 2020].
- Anon. 2014. EUROPEAN MARITIME TRAFFIC RISK ASSESSMENT ON SHIP FIRES BALTIC SEA MIRG Baltic Sea Maritime Incident Response Group Project. [Online]. Available from: www.raja.fi/MIRG [Accessed 21 October 2020].
- Anon. 2016. Risk Focus: Engine Room Fires. [Online]. Available from: https://www.ukpandi.com/news-and-resources/bulletins/2016/risk-focus-engine-room-fires/ [Accessed 21 October 2020].
- Babicz, J. (2015) Wärtsilä Encyclopedia of Ship Technology. [Online]. Wärtsilä Corporation. Available from: https://books.google.gr/books?id=4BtNswEACAAJ
- CTSB. 2018. “Fire Safety Engineering.” [Online]. Available from: http://www.cstb.fr
- Danish Maritime Authority. 2017. “Analysis of Regulatory Barriers to the Use of Autonomous Ships Final Report.” Danish Maritime Authority Report.
- Department of Transportation, United States, U. E.P.A. 1989. “Handbook of Chemical Hazard Analysis Procedures.” NRT-1 ‘National Response Team’s Hazardous Materials Emergency Planning Guide’ expanded. [Online]. Federal Emergency Management Agency. Available from: https://books.google.gr/books?id=LowkSQAACAAJ
- Dimitriou, P., and R. Javaid. 2020. “A Review of Ammonia as A Compression Ignition Engine Fuel.” International Journal of Hydrogen Energy [Online] 45 (11): 7098–7118. doi:10.1016/j.ijhydene.2019.12.209. [Accessed 28 October 2020].
- DNV – GL. 2014. “Global LNG Solutions Recommended Practice on Bunkering Engines for Gas-fuelled Ships LNG Ready Service LNG as Ship Fuel.” [Online]. Available from: www.dnvgl.com [Accessed 6 April 2021].
- Freeman, R. A. 1990. “CCPS Guidelines for Chemical Process Quantitative Risk Analysis.” Plant/Operations Progress [Online] 9 (4), 231–235. Available from: doi:10.1002/prsb.720090409.
- Fridell, E., J. Hansson, and S. Brynolf. 2020. On the Potential of Ammonia as Fuel for Shipping A Synthesis of Knowledge (Göteborg, Sweden: Lighthouse Swedish Maritime Competence Centre).
- GIIGNL. 2019. “Basic Properties of LNG.” [Online]. Available from: https://giignl.org/ [Accessed 5 April 2021].
- Gilbert, P., C. Walsh, M. Traut, U. Kesieme, K. Pazouki, A. Murphy, et al. 2018. “Assessment of Full Life-cycle Air Emissions of Alternative Shipping Fuels.” Journal of Cleaner Production [Online] 172: 855–866. doi:10.1016/j.jclepro.2017.10.165.
- Han, X., and S. Krajnović. 2015. “Very-large-eddy Simulation Based on κ-ω Model.” AIAA Journal [Online] 53 (4): 1103–1108. doi:10.2514/1.J053341.
- Han, Z. Y., and W. G. Weng. 2011. “Comparison Study on Qualitative and Quantitative Risk Assessment Methods for Urban Natural Gas Pipeline Network.” Journal of Hazardous Materials [Online] 189 (1): 509–518. doi:10.1016/j.jhazmat.2011.02.067.
- Hansson, J., S. Brynolf, E. Fridell, and M. Lehtveer. 2020. “The Potential Role of Ammonia as Marine Fuel-based on Energy Systems Modeling and Multi-criteria Decision Analysis.” Sustainability (Switzerland) [Online] 12 (8): 3265. doi:10.3390/SU12083265.
- Hurley, M. J., D. Gottuk, J. R. Hall, K. Harada, et al. 2016. SFPE Handbook of Fire Protection Engineering, fifth. [Online]. New York, USA: Springer New York. [Online]: doi:10.1007/978-1-4939-2565-0.
- Hwang, J., K. Jung, et al. 2019. “Life Cycle Assessment of LNG Fueled Vessel in Domestic Services.” Journal of Marine Science and Engineering [Online] 7 (10): 359. doi:10.3390/jmse7100359.
- IACS. 2004. “What are Classification Societies.” [Online]. Available from: https://docplayer.net/30506347-Iacs-what-are-classification-societies-contents.html
- IARC. 1989. “Occupational Exposures in Petroleum Refining; Crude Oil and Major Petroleum Fuels.” [Online]. World Health Organization. Available from: https://publications.iarc.fr/63 [Accessed 6 April 2021].
- ICS. 2020. “Engine Room Procedures Guide | International Chamber of Shipping.” [Online]. Available from: https://www.ics-shipping.org/publication/engine-room-procedures-guide-mockup/ [Accessed 29 December 2020].
- IGF. 2015. Adoption of the International Code of Safety for Ships Using Gases or Other Low-flashpoint Fuels (IGF CODE) (London, UK: International Maritime Organisation).
- IMO. 2001. Guidelines on Alternative Design and Arrangements for Fire Safety (London, UK: International Maritime Organisation).
- IMO. 2015. “SOLAS Chapter II-2 - GOV.UK.” [Online]. Maritime and Coastguard Agency. Available from: https://www.gov.uk/government/publications/solas-chapter-ii-2 [Accessed 27 December 2020].
- Joung, T.-H., S.-G. Kang, J.-K. Lee, and J. Ahn. 2020. “The IMO Initial Strategy for Reducing Greenhouse Gas(GHG) Emissions, and Its Follow-up Actions Towards 2050.” Journal of International Maritime Safety, Environmental Affairs, and Shipping [Online] 4 (1): 1–7. doi:10.1080/25725084.2019.1707938. [Accessed 20 October 2020].
- Kim, K., G. Roh, W. Kim, and K. Chun. 2020. “A Preliminary Study on an Alternative Ship Propulsion System Fueled by Ammonia: Environmental and Economic Assessments.” Journal of Marine Science and Engineering [Online] 8 (3). doi:10.3390/jmse8030183.
- Korean Register. 2020. (No Title). [Online]. Available from: http://www.krs.co.kr/TECHNICAL_FILE/KR_Forecasting_the_Alternative_Marine_Fuel_Ammonia.pdf [Accessed 20 October 2020].
- Kroch, E. 1945. “Ammonia–a Fuel for Motor Buses.” claverton-energy.com. [Online]. Available from: http://claverton-energy.com/cms4/wp-content/files/NH3_bus_1945_JInstPetrol31_Pg213.pdf [Accessed 21 October 2020].
- Kuo, C. 2007. Safety Management and Its Maritime Application. London, UK: Nautical Institute.
- Laval, A., Hafnia, H. Topsøe, Vestas, et al. 2020. “Ammonfuel-an Industrial View of Ammonia as a Marine Fuel.” [Online]. Available from: https://hafniabw.com/news/ammonfuel-an-industrial-view-of-ammonia-as-a-marine-fuel/
- Mcgrattan, K., S. Hostikka, R. Mcdermott, J. Floyd, et al. 2013. Fire Dynamics Simulator User’s Guide (Washington, D.C.: U.S. Government Publishing Office).
- New York State, D. od H. 2005. “The Facts About Ammonia.” [Online]. Available from: https://www.health.ny.gov/environmental/emergency/chemical_terrorism/ammonia_tech.htm [Accessed 21 October 2020].
- Purkiss, J. A., and L. Y. Li. 2013. Fire Safety Engineering Design of Structures, Third. [Online]. Boca Raton, FL: Taylor & Francis. [Online]: https://books.google.gr/books?id=gUTBAQAAQBAJ
- Royal Society. 2020. “Ammonia: Zero-carbon Fertiliser, Fuel and Energy Store.” [Online]. Available from: https://royalsociety.org/-/media/policy/projects/green-ammonia/green-ammonia-policy-briefing.pdf
- Setchkin, N. P. 1954. “Self-Ignition Temperatures of Combustible Liquids.” Journal of Research of the National Bureau of Standards 53 (1): 49. doi:10.6028/jres.053.007.
- Smith, J. 1976. “Fire Safety on Ships. A Review of International Regulations and Suggestions for Improvement in Fire Safety Equipment.” Safety at Sea International [Online] (89): 20–22. https://trid.trb.org/view/65437 [Accessed 27 December 2020].
- Sprague, C. M., and B. L. Dolph. 1996. Theoretical Basis of the Ship Fire Safety Engineering Methodology CompuCon 21808 (Springfield, VA: National Technical Information Service).
- Su, S., and L. Wang. 2013. “Three Dimensional Reconstruction of the Fire in a Ship Engine Room with Multilayer Structures.” Ocean Engineering [Online] 70: 201–207. doi:10.1016/j.oceaneng.2013.05.032. [Accessed 4 April 2021].
- Wegrzynski, W., and P. Sulik. 2016. “The Philosophy of Fire Safety Engineering in the Shaping of Civil Engineering Development.” Bulletin of the Polish Academy of Sciences, Technical Sciences [Online] 64 (4): 719–730. doi:10.1515/bpasts-2016-0081.
Appendix
Scenario 3: LNG fire
Liquified natural gas is a fossil fuel that primarily consists of methane at a concentration of over 90% along with smaller portions of ethane, butane and propane (GIIGNL Citation2019). LNG is one of the most prominent hydrocarbon-based fuels and enjoys high popularity rates in the marine industry mainly due to its significantly reduced emissions in comparison to oil-based fuels such as HFO (DNV – GL Citation2014). It remains, however, a flammable gas with an autoignition temperature of around 550°C. LNG is also characterized by its high flame temperatures that can cause significant damage to engine space machinery and severely threaten human life (GIIGNL Citation2019). Since its composition is comprised of more than one fuel source, even in very small concentrations, it was decided to assume the consistency of 100% methane (CH4) during the fire simulation. This was done to reduce the simulation’s computational resource demands and consequently save some time from the process.
Before the simulation could begin, the appropriate reaction characteristics had to be defined. As stated above, methane was exclusively used for this simulation. For this reason, methane’s combustion equation was imported from the PyroSim library and the fuel supply vent was modified for pure methane injection.
Temperature distribution and heat release rate
The heat release rate (HRR) plot from the fire can be seen in below. It is important to note that the graph’s fluctuation is caused by the turbulent airflow present in the engine room due to the active ventilation and environment. Therefore, although fuel is supplied to the burner surface at a constant rate, turbulence causes the mixing and combustion process to change over time. Nevertheless, it is evident that the average value of heat release rate in this case is approximately 36,500 kW with a peak at around 170 seconds of simulation time.
Figure A1. LNG fire heat release rate over time.
During the simulation, the temperature levels never exceeded a maximum value of 1050°C, which was monitored directly on top of the fire area. Due to the simulation setup, the fire rapidly spreads towards the top-engine room deck and then gradually propagates further. As it can be seen from the 2D temperature slices in , at 120 and 240 seconds the flame temperatures are higher than at 300 seconds. This is a result of the ever-present engine space ventilation and the larger fire spread in the end of the simulation.
Figure A2. Temperature distribution at: (a) 120 sec (b) 240 sec (c) 300 sec.
Although the temperature range is wide and has the potential for serious machinery and deck damage, the overall temperature output close to critical machinery and spaces such as the control room or the generators, only reached up to around 300°C. A 300° temperature is undoubtably life-threatening; however, not critical for main machinery damage, meaning that with the aid of an emergency evacuation plan and effective fire-extinguishing system catastrophic loss of equipment can be prevented. The outputs from the thermocouples placed on each deck confirm that just after 15 seconds from the start of the fire, the top engine room deck and crew are facing a very serious problem (see ).
Figure A3. Thermocouple simulation outputs.
Toxicity and visibility levels
Toxicity levels on the other hand were notably high, especially for the CO2 concentrations after the fire. Remarkably, carbon monoxide (CO) concentrations were exceptionally low, mainly due to the near-complete combustion of methane, which does not produce any carbon monoxide. On the contrary, carbon dioxide is a methane combustion product and in this case its concentrations were increasing constantly as the fire evolved. In , a comparison between the CO2 concentrations at 60 and 180 and 300 seconds is shown, highlighting the fire’s toxicity outputs. Due to the fuel’s chemical composition and absence of large carbon combustion by-products, smoke propagation was not a problematic area in this case as the production of soot was insignificant. These factors resulted in near perfect visibility conditions during the fire.
Figure A4. Carbon dioxide concentrations at: (a) 60 sec (b) 180 sec (c) 300 sec.
The above presented outputs, highlight the need for engine room toxic gas detectors. In the first 60 simulation seconds, the overall CO2 values are within acceptable limits at around 5–7,000 ppm; however, as the time progresses carbon dioxide concentrations reach almost 40,000 ppm at the end of the simulation. During the early stage of the modelling, the oxygen levels in the engine space were between 190 and 200,000 ppm, similar to the concentrations found in the atmosphere, so it would be safe to say that for the initial 40 seconds of the fire, the engine space has acceptable oxygen levels. As it can be seen from that presents the 2D oxygen slices, concentrations significantly increased with relation to time progression, ultimately reaching leathal 140,000 ppm values at the end of the simulation.
Figure A5. Residual oxygen concentrations at: (a) 60 sec (b) 180 sec (c) 300 sec.
Scenario 4: MDO fire
Marine diesel oil is also a fossil fuel produced by crude oil distillation and it comprises a complex hydrocarbon combination, usually in the range between 9 and 20 carbon atoms (IARC Citation1989). It is one of the most popular fuel sources in the world with a variety of applications both in marine and other industries. Many marine engines onboard use diesel oil as their primary or secondary fuel source. MDO has a significantly lower auto-ignition temperature in comparison to LNG or ammonia at around 225°C (Setchkin Citation1954). The simulation of a diesel fire was particularly important for this project as according to industry data, a diesel generator can experience up to three small fires, due to oil leakage and subsequent contact with a hot surface, in 5 years (Hurley et al. Citation2016). The most challenging aspect of the modelling was the fact that there are many heavy hydrocarbon combinations whose fire characteristics are identical to diesel fuel therefore data from the SFPE Handbook for Fire Protection Engineering were analysed to discover the most suitable composite for the modelling. In the end, n – Tridecane (C13H28) was selected as the most appropriate fuel for the fire simulation and the properties of its combustion were imported from the SFPE Handbook into PyroSim.
In order for the simulation to begin, the combustion equation of the fuel had to be manually imported to the PyroSim environment. This was a challenging aspect as the stoichiometric coefficients of the equation had to be researched in order to determine on optimal fuel flow.
Temperature distribution and heat release rate
The heat release rate (HRR) plot for the simulation is presented in . The average heat release value reached 41,000 kW.
Figure A6. MDO fire heat release rate over time.
The heat release peaked at approximately 100 seconds of simulation time due to the fuels lower autoignition temperature and flash point. The fire simulation showed an expected lower temperature range in comparison to the first simulated fire with the maximum flame temperature value being 1,035°C. Overall, the heat distribution through the engine room decks was lower although still within critical limits for machinery damage and loss of life. In , the 2D slice outputs regarding the temperature distributions in each of the engine space’s decks, showcase that in a direct comparison with methane, lower overall temperatures are developed.
Figure A7. Temperature distribution at: (a) 60 sec (b) 180 sec (c) 240 sec.
Due to the higher HRR values of this simulation, the flame propagation appears to be more aggressive at the beginning; however, from a thermal standpoint, LNG has the upper hand with comparatively higher thermal radiation levels. Although there is a rapid fire spread towards the top-engine deck, it seems that once the temperature reaches a median value of 250°C, the levels of heat distribution start to slowly equalize over time. This can be also validated from where the thermocouple outputs for this simulation are plotted. Notably, in this case, the rapid temperature increase happens before the 15 second mark in comparison to the first scenario fire. The top engine room deck faces a larger temperature fluctuation than the others due to the large open vent present which contributes to turbulent air flow.
Figure A8. Thermocouple simulation outputs.
Toxicity and visibility levels
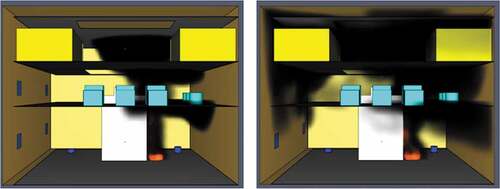
Because of the fuel’s larger soot coefficient and carbon reaction products, the smoke propagation and soot formation were much higher in comparison to the LNG fire. Indeed, the engine space was almost full of smoke at just 50 seconds from the start of the fire. For this reason, the large amounts of dark smoke produced by diesel impaired significantly the engine room visibility levels, causing objects more than 3 meters away from an observer to be near invisible after just 60 simulated seconds. Despite the present active and passive pre-specified ventilation, the rapid smoke propagation continued until the end of the simulation (see ).
Figure A9. Smoke development over time.
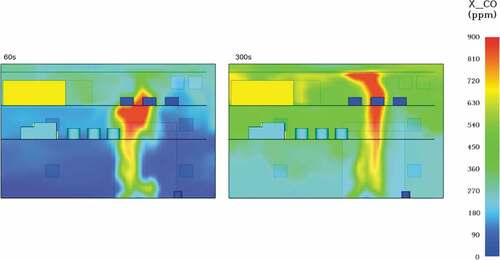
The observed toxicity levels were also substantial in this case. Diesel fire had large resultant carbon monoxide concentrations reaching average values of 200 ppm at 60 seconds and almost 600ppm at 300 seconds of the simulation (see ). According to OSHA, a continuous exposure at 800ppm can lead to loss of life at just 2 hours, meaning that the crew evacuation needs to be prioritized.
Figure A10. Carbon monoxide concentrations at 60 and 300 seconds respectively.
Carbon dioxide concentrations were also significant in this scenario, especially in comparison to the LNG fire in .
Figure A11. Carbon dioxide concentrations at 60 and 300 seconds respectively.
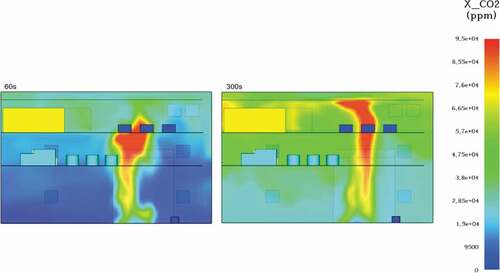
In detail, CO2 concentrations at 60 seconds averaged 14,000ppm, a value almost 3 times above the permissible OSHA limit, non-lethal however if exposure is kept to a minimum. At the end of the simulation, a CO2 level of over 70,000ppm meant that the engine room environment was at deadly within seconds of exposure. During the modelling, oxygen levels were greatly influenced by the toxic gases emitted. More specifically, O2 levels remained within the acceptable 190 to 200,000pmm range only for the first 40 seconds of the simulation. At 180 seconds an oxygen insufficiency was already starting to form at least on the top engine deck and at the 300 second mark, the engine space did not have enough oxygen for the support of life as oxygen levels continued to fell below 13% by volume air or 130,000ppm (see ).
Figure A12. Oxygen concentrations at: (a) 60 sec (b) 180 sec (c) 300 sec.