
 ?Mathematical formulae have been encoded as MathML and are displayed in this HTML version using MathJax in order to improve their display. Uncheck the box to turn MathJax off. This feature requires Javascript. Click on a formula to zoom.
ABSTRACT
Business process management distinguishes the actual “as-is” and a prescribed “to-be” state of a process. In practice, many different causes trigger a process’s drifting away from its to-be state. For instance, employees may “workaround” the proposed systems to increase their effectiveness or efficiency in day-to-day work. So far, ethnography or critical incident techniques are used to identify how and why workarounds emerge. We design a deep-learning-based method that helps detect different workaround types in event logs. Our method tracks indications of potential workarounds in the early stages of their emergence among deviating behaviour. Our evaluation based on four real-life event logs reveals that our method performs well and works best for business processes with fewer variations and a higher number of different activities. The proposed method is one of the first information technology artefacts to bridge the boundaries between the complementing research disciplines of organisational routines and business processes management.
1. Introduction
Aligning information systems and business processes is challenging because processes frequently change, for example, by adopting new digital technologies (Beerepoot & van de Weerd, Citation2018). Previous research has focused on investigating alignment in the implementation phase of information systems (Ignatiadis & Nandhakumar, Citation2009). However, considering the post-implementation phase is equally important, as employees frequently deviate from predefined business processes and organisational routines, thus adapting their day-to-day work over time. One type of behaviour that often occurs in organisations to overcome, bypass, or minimise the impact of obstacles or structural constraints are workarounds (Alter, Citation2015). They are “adaptions of work activities that are not expected or specified to be changed in this manner” (Laumer et al., Citation2017, p. 335), and they play an important role in almost all organisations (Alter, Citation2015; Röder et al., Citation2015b). For instance, nurses spend approximately 12% of their time overcoming operational failures and constraints (Tucker et al., Citation2014).
Even though workarounds can disrupt a business process’s efficiency and quality, they can also trigger innovation. Disruptions may manifest themselves as cumbersome (Alter, Citation2015) and inefficient processes that deviate from standard operating procedures (Röder et al., Citation2014). If workarounds remain undetected, they may become unofficially institutionalised in an organisation and may be difficult to change (Tucker et al., Citation2014). As a positive deviation, workarounds can lead to performance improvements (Röder et al., Citation2014) and thus provide profound opportunities to analyse and redesign a business process (Alter, Citation2015; Beerepoot et al., Citation2019).
Workarounds are complex phenomena that prime employees’ activities in business processes – and the closely related concept of organisational routines (Beverungen, Citation2014). Understanding workarounds and their effect on business processes and information systems might enable organisations to innovate their processes to establish and maintain a competitive advantage. Previous research has focused on categorising workarounds and explaining how and why employees perform workarounds (Röder et al., Citation2015b). Workarounds are often detected using qualitative empirical approaches, such as semi-structured interviews, direct observations, or document analysis (Beerepoot et al., Citation2018). Even though these methods can provide empirical evidence regarding the identification and emergence of workarounds, they presuppose that informants are aware of their workarounds and are willing to expose their deviation from standard business processes (Beerepoot et al., Citation2018), such that they are limited to identify a subset of all workarounds. Moreover, manual detection methods appear to be excessively labour-intensive and do not allow for large-scale identification of workarounds.
In digitised business processes, workarounds leave data traces in event logs that can be automatically identified and analysed. In business process management (BPM), a plethora of methods have been developed to, more generally, detect anomalies (e.g. Nolle et al. (Citation2018), Nolle et al. (Citation2019), and Pauwels and Calders (Citation2019)) or deviations (e.g. Lu et al. (Citation2016), Cuzzocrea et al. (Citation2016), and Folino et al. (Citation2020)) in business processes. However, even though workarounds, anomalies and deviations are related, they differ conceptually – i.e., in terms of subject, scope and effect – such that existing process mining (PM) methods cannot effectively detect them in event log data (Outmazgin, Citation2012). Nevertheless, initial research indicates that PM, particularly conformance checking or compliance checking (i.e. a rule-driven derivative of conformance checking (Dunzer et al., Citation2019; Ramezani et al., Citation2012)) may be suitable for detecting workarounds (Beerepoot et al., Citation2021; Beerepoot & van de Weerd, Citation2018; Outmazgin & Soffer, Citation2013, Citation2016), but shows limitations because these methods require either a “to-be” process model or use static rules. We set out to design a new method for automatically detecting potential workarounds that helps in the analysis of real-life event log data. For this purpose, we apply deep neural network (DNN) models with multiple levels of representation to detect workaround patterns in high-dimensional data (LeCun et al., Citation2015).
The contribution of this paper is twofold. First, following the design science research (DSR) paradigm as outlined by Hevner et al. (Citation2004) and Gregor and Hevner (Citation2013), we design a method that relies on deep learning (DL), enabling researchers and practitioners to detect and analyse workarounds automatically in a digitised business process. This method is a novel data analysis application that facilitates the innovation, exploration, and exploitation of business processes through workarounds. Second, by applying a BPM approach to identify workarounds in organisations, we contribute to spanning the boundaries between the two research streams of organisational routines and PM.Footnote1
The remainder of this paper is organised as follows. In Section 2, we present related research on workarounds and PM. In Section 3, we describe and justify our research method. In Section 4, we present the proposed method for identifying workarounds from event logs. In Section 5, we describe the evaluation of our method by analysing four public data sets. Subsequently, in Section 6, we present the results of the evaluation. While Section 7 discusses our method’s results, managerial implications, related work and limitations, Section 8 concludes the paper.
2. Theoretical background
2.1. Conceptual foundations of detecting workarounds
The concept of workarounds emerged in information systems (IS) research in the mid-1980s to describe the apparent mismatch between work requirements and design (Gasser, Citation1986). Workarounds are omnipresent in organisations and frequently occur when employees use digital technology for their day-to-day work (Röder et al., Citation2015b). Workarounds represent unexpected employee behaviour (Ejnefjäll & Ågerfalk, Citation2019) and manifest as “deviations from defined business processes that are carried out in the employees’ performances of routines in a work system” (Wolf & Beverungen, Citation2019, p. 1). Research about workarounds can be organised into literature that examines “why” workarounds are performed and “how” this happens.
Regarding “why” workarounds occur, the main rationale is to bypass misfits, do troubleshooting, avoid rules or limitations, mitigate poor information system design, or simply to cut time (Röder et al., Citation2016). Hence, employees perform workarounds to achieve specific organisational or individual goals (Ejnefjäll & Ågerfalk, Citation2019). Related research regarding “how” workarounds are performed points out that they are temporary deviations enacted by individuals (Azad & King, Citation2012). Occasionally, workarounds have been found to become a part of an employee’s daily routines, even if they conflict with established rules (Azad & King, Citation2012). As they become institutionalised over time, workarounds can unofficially spread across employees’ routines and affect the day-to-day work of other employees in an organisation (Röder et al., Citation2016; Wolf & Beverungen, Citation2019). Hence, it is essential to identify and resolve the root causes behind workarounds so that the corresponding business processes may be continuously understood, improved, adapted, or redesigned (Röder et al., Citation2015b).
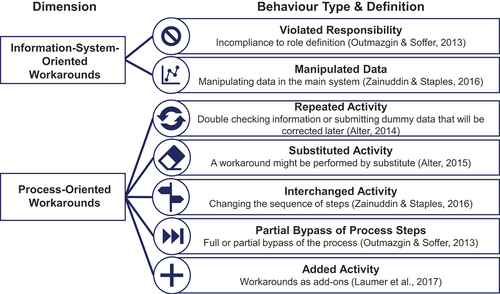
Workarounds are performed to change information technology (IT) artefacts or business processes (Wolf & Beverungen, Citation2019; Zainuddin & Staples, Citation2016) (). Regarding a deviant use of IT artefacts (Azad & King, Citation2012; Ignatiadis & Nandhakumar, Citation2009), workarounds are invoked through humans using an artefact in a manner that is inconsistent with the artefact’s original purpose (Azad & King, Citation2012). Through a workaround, employees attempt to adapt an IT artefact to their needs, compensating for its perceived deficiencies or offsetting their ignorance of system features (Boudreau & Robey, Citation2005). Even though deviance in using an IT artefact may conflict with the spirit of the artefact’s feature set (DeSanctis & Poole, Citation1994), it may also be a viable form of enacting it (Azad & King, Citation2012). Workarounds directed towards an IT artefact may be expressed by a violation of one’s responsibilities if they contradict pre-defined roles (Alter, Citation2014; Ignatiadis & Nandhakumar, Citation2009; Outmazgin, Citation2012; Zainuddin & Staples, Citation2016) or become apparent by generating manipulated data (Alter, Citation2015; Ignatiadis & Nandhakumar, Citation2009; Outmazgin & Soffer, Citation2013; Zainuddin & Staples, Citation2016). Regarding business processes, employees may apply workarounds to overcome dysfunctional or ill-defined standard operating procedures to complete tasks they deem essential for their day-to-day work (Outmazgin, Citation2012). Here, workarounds manifest themselves in handling exceptions, addressing grey spaces, or deviating from routines, processes, or methods (Alter, Citation2014). Employees may repeat activities (Alter, Citation2014), substitute activities (Alter, Citation2015; Laumer et al., Citation2017), interchange steps in a sequence of activities (Zainuddin & Staples, Citation2016), bypass activities (Alter, Citation2014; Outmazgin & Soffer, Citation2013, Citation2016; Röder et al., Citation2014), or add activities to a business process (Alter, Citation2015; Koopman & Hoffman, Citation2003; Laumer et al., Citation2017).
Workarounds can impact a business process in different ways, i.e., a process might continue with the most frequent path, an alternative path, or branch into a new path, leading to process drift (Pentland et al., Citation2020). If they remain undetected, workarounds may cause negative effects, such as a loss of control (Lapointe & Rivard, Citation2005), compliance issues (Da Cunha & Carugati, Citation2009) or inferior process quality (Boudreau & Robey, Citation2005). However, recent research emphasises that workarounds can also be a source of innovation, as they may remedy misfits and inefficiencies between IT artefacts and business processes (Wolf & Beverungen, Citation2019). For example, workarounds have been argued to be a vital element in software engineering (Safadi & Faraj, Citation2010). Workarounds may diffuse through an organisation if they affect the work of other employees (Leonardi, Citation2011; Pentland et al., Citation2017; Wolf & Beverungen, Citation2019); their diffusion amplifies their potential to affect organisations (positively or negatively). In any case, it is important to discover workarounds early so that the necessary actions may be taken (Outmazgin & Soffer, Citation2013), preventing undesirable consequences and promoting process innovation. Thus, detecting workarounds can result in multiple consequences, including process redesign, system improvement, employee training, or disciplinary actions (Outmazgin & Soffer, Citation2013).
Figure 1. Taxonomy of workarounds.
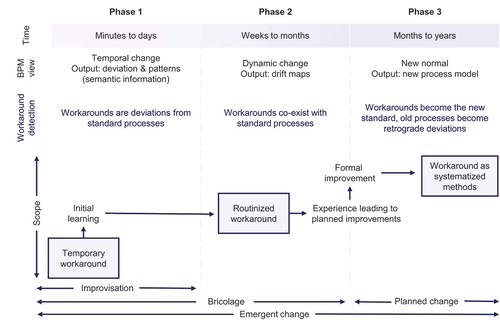
Workarounds are subject to temporality (Alter, Citation2014), establishing a kind of life-cycle. Workarounds may occur temporarily as an adaptation to a business process performed by an individual employee (Grisold et al., Citation2020). Over time, they can be routinised and might eventually stabilise as an established practice, transforming a business process’s nature. This life-cycle can span from months to years and might vary in its scope (Alter, Citation2014).
Subject to this life-cycle, PM seems suitable to detect workarounds in some stages but not in others. In the first phase of improvisation (), a workaround will manifest as a temporal change from a standard process. In the second phase of dynamic change, a workaround will be one variant that co-exists with a standard process and other variants, making it difficult to trace which variant is either standard or a deviation. If a workaround reaches the third stage and becomes the “new normal”, other variants – including the process constituting the old standard – will appear as retrograde deviations from the “new normal”. Since the nature of a workaround changes over time, we posit that methods for detecting workarounds can be used to identify innovative changes as well as old habits in performing a business process, while their detection might come with conceptual challenges in periods of dynamic change.
Figure 2. Temporality of workarounds (adapted from Alter (Citation2014)).
2.2. Process mining for detecting workarounds
PM is a prevalent process analysis method in BPM that involves the data-driven discovery, monitoring, and enhancement of processes (van der Aalst et al., Citation2011). However, even though detecting deviant or non-compliant behaviour in event log data has gained considerable attention, only Outmazgin and Soffer (Citation2016) and Beerepoot et al. (Citation2021) have addressed the automated detection of workarounds in event log data.
Besides workarounds, the concepts of anomaly and deviation seem similar at first glance but differ conceptually from workarounds in terms of their subject, scope, and effect, as shown in .
Table 1. Conceptual difference of workarounds from anomalies and deviations.
Workarounds have a strong human focus, which manifests intentionally in the behaviour of persons (Beerepoot et al., Citation2021) as goal-directed, flexible, and individually constructed work patterns to remedy misfits (Alter, Citation2014; Ejnefjäll & Ågerfalk, Citation2019; Röder et al., Citation2014). In contrast, anomalies and deviations refer to specific patterns that may be caused by dysfunctional machine actions that are primarily unintentional (Breuker et al., Citation2016; Chandola et al., Citation2009; Guo et al., Citation2019; Pimentel et al., Citation2014). Workarounds pass multiple learning and diffusion phases that can be concatenated to a life-cycle (Safadi & Faraj, Citation2010). Thereby, workarounds are interconnected with goals, activities, obstacles, and opportunities in every phase (Alter, Citation2014). In the beginning, workarounds may occasionally occur due to obstacles or be triggered by shocks. Through learning mechanisms of actors, workarounds can establish in routines and improve business processes. These properties set workarounds apart from deviations, anomalies, and non-compliant behaviour (Malaurent & Karanasios, Citation2020), all of which represent dysfunctional states that require corrective intervention. While workarounds and deviations can have positive or negative effects, anomalies are negative since they refer to non-compliance with general rules, methods, specifications, or results. As humans perform workarounds, the actual performance of workarounds is dependent on employees’ cognition and decisions. Hence, the spectrum and degree of deviance from business processes are much broader through the performance of workarounds, highlighting that workarounds are more complex and have a different scope compared to the other concepts. Since anomalies and deviations are generally not subject to temporality, they manifest as deviation patterns, which can be identified by analysing event logs. In contrast, workarounds are subject to a life-cycle that shifts the roles of standard processes and workarounds over time, provided that a workaround diffuses through an organisation. As an early paper to investigate the role of PM in workaround detection, we focus on workarounds’ first life-cycle phase.
To detect workarounds, Outmazgin and Soffer (Citation2016) develop a backward compliance checking method that uses six static rules; specifically, they propose one rule per workaround type. Nevertheless, this method is ineffective in detecting workarounds in (sequential) event log data because the rules are static, and workarounds belonging to a specific type can vary considerably (Bishop, Citation2006). For example, an employee may bypass not only a single step but ten or even more process steps when performing a business process; this highlights the need to detect workarounds that are highly flexible patterns. Beerepoot et al. (Citation2021) apply a multi-perspective conformance checking method requiring a “to-be” process model to detect workarounds in event log data. The authors differ between 51 workarounds, identified by observations and interviews with healthcare professionals in previous research. By applying their method, the authors detect eight of the 51 workarounds in event log data. As this approach checks the conformance of process instances in terms of control-flow, resource, time and data, concrete workaround patterns are not considered in the conformance check.
To detect anomalies, it is a common approach to apply conformance or compliance checking. To detect anomalies without a static process model or rules, that is, with higher flexibility, current research has proposed using neural networks, such as autoencoders (AEs) (Nolle et al., Citation2018) and recurrent neural networks (Nolle et al., Citation2019), or dynamic Bayesian networks (Pauwels & Calders, Citation2019), to determine whether a finished process instance includes an anomaly or not. Beyond binary classification, for example, Nolle et al. (Citation2019) use static rules to classify each process instance by a concrete anomaly type. Besides anomaly detection, a different research stream performs outlier detection. An outlier is conceptually similar to an anomaly, and the detection is based on classification and clustering techniques (Ghionna et al., Citation2008). Sub-types of anomalies are exceptions (abnormal or unusual execution but can be supported by business), noise (possibly caused by system failure or error in data input), or fraud (unusual executions that lead to undesirable results from a business point of view) (Bezerra et al., Citation2009). Depending on the conceptual properties of anomalies and workarounds, the underlying patterns differ from each other. Therefore, anomaly detection approaches seem only partially applicable for workaround detection.
In deviation detection, it is common to detect deviations on the process-instance-level or rely on a normative process model to locate deviating behaviour on the event-level. Since a process model cannot be available and the discovery from actual behaviour results in inaccurate diagnostics, methods (e.g. Lu et al. (Citation2016), Cuzzocrea et al. (Citation2016), and Folino et al. (Citation2020)) have been designed to detect deviations on event-level without discovering any normative model. However, since these approaches only differentiate normal and deviating behaviour, they cannot detect workaround patterns.
3. Research method
To organise the development of our IT artefact, we follow the DSR IS research paradigm outlined by Hevner et al. (Citation2004) and Gregor and Hevner (Citation2013). More specifically, our research process is led by the seven DSR guidelines outlined by Hevner et al. (Citation2004), and the structure of our paper follows the publication schema proposed by Gregor and Hevner (Citation2013).
As DSR is inherently a problem-solving process, we review the first step of descriptive and prescriptive knowledge in the area of interest (Hevner et al., Citation2004) and recognise that IS research lacks an automatic method for workaround detection. Consequently, as our research’s objective, we define the design of a DL-based method for detecting and classifying different types of workarounds in digitised business processes. Further, we identify seven types of workarounds from literature and examine existing workaround and related anomaly and deviation detection approaches in PM. Subsequently, we proceed with the design phase, in which we develop a workaround detection method that serves to detect all seven types of workarounds in an event log. After the instantiation, we evaluate the method in three regards. First, we apply our method to four public data sets – supplied for the business process intelligence (BPI) challenges 2012 (van Dongen, Citation2012), 2013 (Steeman, Citation2013), 2019 (van Dongen, Citation2019), and 2020 (van Dongen, Citation2020) – to quantitatively evaluate its detection quality. Second, we demonstrate our method based on the event log from the BPI challenge 2020 to evaluate its usefulness in an argumentative way. Third, we perform five expert interviews to evaluate our method’s usefulness in a naturalistic way. Through our evaluation, we justify our method’s ability to solve the previously identified problem of an automated workaround detection (Hevner et al., Citation2004). Finally, we offer prescriptive design knowledge regarding methods for workaround detection in event logs by presenting our results in this article.
4. Deep learning for detecting workarounds in event logs
We design a DL-based workaround detection method that comprises five phases (). For each process instance of a real-life event log, the method detects if a workaround of a particular type is present.
Figure 3. Five phases of the DL-based workaround detection method.
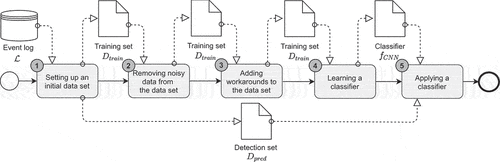
Initially, a vector-oriented data set, which is based on an event log, is generated to apply DNNs. In the second phase, noisy data (e.g. a workaround type and/or conspicuities such as simple typing errors caused by inattentive process participants) are removed from the data set using an AE, a specific type of DNN. In this phase, the noisy process instances removed from the data are compensated for process instances randomly selected from the remaining non-noisy data. In the third phase, workaround variations from a predefined set of workaround types are randomly added to the existing process instances in the data set. In the next phase, a classifier is learned using a convolutional neural network (CNN). The classifier maps a process instance to a workaround class. Finally, the learned classifier is applied to a left-out subset of the initial data set, in which noisy data have not been removed. Before we present, explain, and justify each phase of the proposed method, we introduce a set of preliminaries.
4.1. Preliminaries
The DL algorithms in the proposed method process data, which can be structured into vectors, matrices, and tensors. Thus, we first define these data structures.
Definition 4.1 (Vector). A vector is an array of numbers, in which the
th number is identified by
. If each number in vector
lies in
, and the vector
contains
numbers, then
lies in
, and its dimension is
.
Definition 4.2 (Matrix). A matrix is a two-dimensional array of numbers, where
We denote the
th row of a matrix by
and the
th column by
Definition 4.3 (Tensor). A tensor is an
-dimensional array of numbers. If
,
is a tensor of the third order with
, where
. We denote the
th matrix by
Further, the proposed PM method identifies workarounds in event log data. An event log is structured into traces, which are in turn structured into events. Thus, based on Polato et al. (Citation2014), we define the terms event universe, event, trace, and event log as follows:
Definition 4.4 (Event universe). is the event universe in which:
• is the set of process activities,
• is the set of process instances (cases),
• is the set of case IDs with the bijective projection
,
• is the set of timestamps, and
• is the set of data attributes.
Definition 4.5 (Event). An event is a tuple
, where
is the process activity,
is the case ID,
is its starting timestamp, and
are the data attributes. Given an event
, we define the projection functions
:
,
, and
.
Definition 4.6 (Trace). A trace is a non-empty sequence of events such that
for
. A trace can also be considered a sequence of vectors, in which a vector contains all or part of the information relating to an event (e.g., the activity of an event). Formally,
where
is a vector, and the index denotes the time-ordering of the vectors.
Definition 4.7 (Event log). An event log for time instant
is the set of traces such that
, there exists
so that
, we have
and
(i.e., all events of the observed cases that have already happened).Footnote2
Finally, the proposed method uses a labelled data set for training. Thus, we define the term label.
Definition 4.8 (Label). Given a trace , we can define its label as
. In this paper, the label reflects a set of workaround classes.
4.2. Setting up an initial data set
The first phase of the method transforms the data representation of the event log and generates an initial data set that is to be used by DNNs. Thereby, we follow a well-established generation process consisting of three steps as in the work of Weinzierl et al. (Citation2020)): load the event log, transform the event log into a data set, and encode the data attributes of the data set.
In the first step, an event log is loaded. Subsequently, a trace
of
can be expressed as:
where . Such a trace contains all information about its events. However, for detecting workarounds, information about the activity and the data attributes is sufficient. Thus, we apply to the events of each trace of
the projection functions
and
to retrieve the activity and additional data attributes. Thereby, we retain the temporal order of the events in each trace. After these functions have been applied, a trace
of the event log
can be expressed as:
with . In EquationEquation (2)
(2)
(2) ,
(
) represents the activity of the
th event of trace
, and
is the
th data attribute associated with the
th event. Typically, the number of data attributes associated with an event, and the number of events per process instance vary. In addition, we assume that the events have an explicit reference to a process instance; this assumption is often made in PM, and it has been reported to be typically satisfied in real-world event logs (van der Aalst, Citation2016). Subsequently, we use the event log
, as shown in EquationEquation (3)
(3)
(3) , as an example to demonstrate our artefact.
In the second step, the event log with a log-oriented representation is transformed into a data set
with a vector-oriented representation (Weinzierl et al., Citation2019), where
indicates the number of process instances, and
is the number of attributes. In most cases, event logs are encoded using a log-oriented representation, in the case of the popular XES format (Verbeek et al., Citation2010). However, the DNNs considered in this paper require a data set with a fixed-size structure as input (LeCun et al., Citation2015). For example, shows
(obtained from
) in the form of a two-dimensional data structure, in which each row has the same number of columns.
Table 2. Data set with a fixed-size structure.
In the last step of this phase, discrete values of activities and data attributes of the data set are transformed into numeric values. The DNNs used in this work are fully differential and require numerical data to compute forward and backward propagation (LeCun et al., Citation2015).
We first handle missing values. On the one hand, missing values of the activity attribute and each categorically scaled data attribute are replaced by the global constant “0” (Han et al., Citation2011). This constant does not affect the results of the DNNs because it differs from the existing values of a categorical attribute. On the other hand, we replace the missing values of each numerically scaled data attribute with the median of existing values (Han et al., Citation2011). In addition, the median does not affect the result of the DNNs because it represents the “middle” of the distribution of a numerically scaled data attribute. This step is necessary because a DNN, as used here, cannot handle missing values. Further, for each numerically scaled context attribute with a value range that is not equal to , a min-max normalisation is performed. Then, we apply binary encoding for the activity attribute and for each categorically scaled data attribute. Since attributes in event log data (especially context attributes like the resource) can have many values, a sparse encoding (e.g. one-hot encoding) results in data sets, which cannot be processed efficiently. shows the resulting data set
. Each categorical data attribute now has two different values.Footnote3
Table 3. Initial data set with a vector-oriented representation.
In the last step, the initial data set is divided into two subsets:
and
. The data set
is transferred to the subsequent step of the method, whereas
is left out for the last phase, in which workaround classification is performed. Regarding the running example
, we assign its first three process instances to
, and the last to
.
4.3. Removing noisy data from the data set
We assume that not only workarounds but also other forms of deviance (such as fraud, sabotage, or interpretive flexibility) of (un-)intentional divergent behaviour may be present in an event log, which we define as “noisy data”.Footnote4 Thus, in our method, all noisy data (i.e. workarounds and other deviations) are removed using an AE. Then, the removed data are compensated for normal data that are randomly selected from the remaining non-noisy data. This step is necessary to determine an appropriate threshold for noisy data removal through the AE. In the subsequent phase, we generate and reintegrate noisy data that are consistent with workarounds.
In general, a complete AE is a neural network trained to attempt copying its input to its output (Goodfellow et al., Citation2016). It comprises two components. The first is the encoder function , which maps the input
to an internal representation
. The second is the decoder function
, which maps the internal representation
to the reconstruction
.
Given the data set , the encoder function
, and the decoder function
, the reconstruction errors
as elements of the loss function are minimised during the learning process (Goodfellow et al., Citation2016). A formalism of the AE’s loss function, which first calculates the reconstruction error of each process instance to subsequently determine the overall normalised reconstruction error (for all process instances), can be found in Appendix A.
After the learning process is completed, the function , as shown in EquationEquation (4)
(4)
(4) , is applied to each process instance
(with
) to identify and remove noisy process instances from
.
In EquationEquation (4)(4)
(4) ,
is the reconstruction error of the process instance
, whereas
is the reconstruction error threshold. As proposed by Borghesi et al. (Citation2019), we select as threshold value the
th percentile of the reconstruction errors (i.e. for all process instances)
of the data set
. For example, in the case
, in which the value of the threshold
could be equal to
, 70% of the process instances in the data set have a reconstruction error that is less than or equal to this value. The value of the parameter
can be automatically retrieved through parameter search (e.g. grid or random search) or can be manually set by a domain expert. After applying the function
, the resulting data set
is shown in , where the second process instance is removed because its reconstruction error exceeds the threshold. The reconstruction error of this process instance is higher because the resource “Al” bypassed the activity “Create Inv.”.
Table 4. Data set without noisy data.
In the last step, the noisy process instances removed from the data set are compensated for randomly selected process instances from the same data set. Accordingly, different values of the reconstruction error threshold can be tested with the same data set size for
and the same number of added workarounds (see next section). shows the data set
, where the third process instance is a copy of the first.
Table 5. Data set with augmented data.
4.4. Adding workarounds to the data set
In this phase, noisy data related to workarounds are integrated into . We follow Nolle et al. (Citation2019), Böhmer and Rinderle-Ma (Citation2016), and Bezerra and Wainer (Citation2013), who detect anomalies in event logs, and add noisy data (representing anomalies) to
% of the process instances randomly selected from the data set
. Thus, we leave 70% of the process instances unchanged and assign them to the class No workaround (0) that does not represent a workaround type. We integrate a workaround representing one of the seven workaround types into each of the other
% of the process instances, and assign each process instance to a class that corresponds to the workaround type. Based on the workaround taxonomy presented in and inspired by Nolle et al. (Citation2019), we define the seven workaround types as shown in .
Table 6. Technical specification of the seven workaround types.
As shown in , a workaround of the type bypassed activity is integrated into the second process instance of the data set . Additionally, the last column of this table represents the label specifying the eight different workaround classes, which is not part of the data set
. The first class of the eight workaround classes is No workaround, and the other seven classes refer to the seven workaround types from .
Table 7. Data set without noisy data and the label specifying the workaround class.
4.5. Learning a classifier
To learn a classifier represented by a function that maps each process instance of to a workaround type, we use a CNN (LeCun, Citation1989), which is a neural network that includes at least one convolutional layer, consisting of three stages: convolutional, detection, and pooling stage (Goodfellow et al., Citation2016).
In the first stage, several convolutions are performed in parallel to produce a set of linear activations based on the input, for example, a sequence. A convolution is a filtering operation performed by a feature map. All units in a feature map share the same filter bank, in which the weights for this filter are stored (this principle is called parameter sharing). For each feature map, only one linear activation is calculated by element-wise multiplication of the filter-sized batch of the input and the filter bank, followed by summation. In the second stage, each linear activation is run through a nonlinear activation function. In the third stage, a pooling function is used to merge semantically similar features (LeCun et al., Citation2015) and to remove irrelevant features.
We opted for a CNN for two reasons. First, a CNN can process input data using a one-dimensional, sequential representation (LeCun et al., Citation2015); thus, it is suitable for the proposed method because the process instances of the data set have such a representation. After reshaping, the matrix
can be represented as a third-order tensor
, where
indicates the number of process instances,
is the number of the time steps of the longest process instance, and
is the number of attributes per time step. Second, a CNN typically provides the capability of sparse interactions by making the kernel (called filter) smaller than the input (Goodfellow et al., Citation2016). For example, a process instance of
featuring low-level encoded activities and data attributes may have more than 1,000 elements. However, we can detect specific workaround types that occupy only 10 or 100 of these elements.
4.6. Applying a classifier
In the last phase, the learned CNN model is applied to the subset
of the initial data set
, generated in the first phase. To apply the trained CNN model, the data set
, represented as a two-dimensional matrix, should be transformed into a third-order tensor
. Concerning
, noisy data in the data set remain unchanged. For each process instance
, the CNN model returns a classification output in the form of a probability distribution
, where
. The most likely workaround type for
is determined through the function
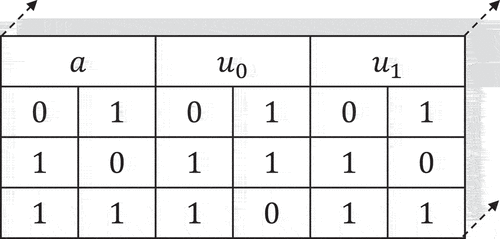
. For example, for the process instance in the detection set
(third-order tensor generated from the matrix
), shown in , the CNN model returns a probability distribution in which the value for the class No workaround (0) has the highest probability value.
Figure 4. Data set for workaround detection.
5. Evaluation
5.1. Event logs
We used for the evaluation the following four real-life event logs. The main properties of the event logs are exhibited in .
Table 8. Characteristics of the event logs used for the evaluation.
The bpi2019 (van Dongen, Citation2019) event log was acquired from a large multinational coating and paints company operating in the Netherlands. The data represent a mass transaction process, more specifically, a purchasing process. As the event log had an original size of 1,595,923 events, we used a sample of the first 80,003 events from activities performed by human actors to make the data set’s size comparable with those supplied in the bpi2013i, bpi2012w, and bpi2020p event logs. For two reasons, we removed process instances that included more than events (the longest sequence in the original event log is
). First, longer sequences could not be efficiently computed with the given resources. Second, longer sequences appeared unrealistic and were considered as exceptions. Finally, we selected the data attributes Event Org:Resource (human actor), Case Document Type, and Case GR-Based Inv. Verif (flag indicating if goods-receipt-based invoicing is required) for our evaluation.
The bpi2013i (Steeman, Citation2013) event log was supplied by Volvo IT in Belgium and contains data related to incident and problem management processes. More specifically, the Handle Incident Process describes the control flow from the emergence and reporting of a variety of IT-related incidents to their resolution on different service levels. For our evaluation, we used the data of all 7,554 process instances in this event log, comprising 65,533 events. We selected the data attributes Owner First Name (human actor), Involved ST Function Div (functional division of IT organisation), and Involved Org line 3 (business area of the user reporting the problem to help-desk) for the evaluation.
The bpi2012w (van Dongen, Citation2012) event log contains data from an application process for commercial products of a large financial institution. This process consists of three sub-processes, containing 13,087 instances and 262,200 events in total. For this paper, we considered the work item sub-process because it is the only sub-process in this data set that includes activities performed by humans rather than by machines. To evaluate the detection of different types of workarounds, we also selected the data attributes Org:Resource_Event (human actor) and Amount_Req_Trace (amount of money requested by the customer) for the evaluation. Additionally, we filtered out all events that did not exhibit the type complete, resulting in a data set comprising 9,658 instances and 72,413 events.
The bpi2020p (van Dongen, Citation2020) event log documents the travel permit process of a Dutch university. More specifically, it describes the process from issuing an application for a travel permit by employees to the applications’ approval by their supervisors to reimbursement handling. In total, the event log contains 7,065 instances and 86,581 events. We used all instantiated processes, but since the bpi2020p event log also contains activities performed by an information system (System), we only selected events for which the attribute Resource exhibited the value Staff Member, leading us to remove 17,388 events, while keeping 69,193 events in the data set. Here, we selected the data attributes org:role (human actor) and (case) overspent for our evaluation.
5.2. Evaluation procedure
For each of the four real-life event logs, a %-subset of the process instances was randomly selected as a hold-out detection set for the last phase of the method. From the other
% process instances, noisy data were removed, while normal data were augmented and workarounds were added. Subsequently, as recommended by Haykin (Citation1998) for neural networks, the remaining
of process instances were randomly split into a training set (
) and a test set (
).
In line with phase two of the proposed method, noisy data were removed from the %-subset of the original event log by using an AE. To better adjust the hyper-parameters of the AE model to the underlying training set during the training procedure, we performed a hyper-parameter optimisation method. Specifically, we selected tree-structured Parzen estimator (TPE), a sequential model-based optimisation approach, which was demonstrated to be more reliable for training DNNs than traditional approaches (e.g. random search) (Bergstra et al., Citation2011). We ran the TPE method ten times to obtain appropriate values for the hyper-parameters. For each run, the training set was randomly split into a training subset (
%) and a validation set (
%). After ten runs, the trained model with the lowest mean squared error was selected and then applied to analyse the testing set. Further details on the hyper-parameter configuration of the AE are documented in Appendix B.
In line with phase four of the method, a CNN was used to learn a mapping from the process instances of the training set to the workaround labels. As in the previous phase, we applied TPE with ten runs and the same random split to train the CNN. Here, the CNN model with the highest f1-score was selected. Further details on the hyper-parameter configuration of the CNN are provided in Appendix C.
After learning the CNN models in phase four, we tested their detection quality based on the test set. To this end, we used all four states provided by the confusion matrix to present and discuss the detection quality of the four classification models, in which we differentiated between the classes workaround and no workaround. The four states of the confusion matrix included true positives (TPs), true negatives (TNs), false positives (FPs), and false negatives (FNs). Moreover, we calculated the average accuracy, (macro) precision, (macro) recall, and (macro) f1-score of all workaround classes (seven workaround types and the class no workaround). All of these machine learning (ML) metrics are well-established in the PM community and in the IS literature, too (Breuker et al., Citation2016). In phase five, the trained and tested CNN models were applied to analyse the detection set, which included noisy data.
Finally, we implemented the proposed method using Python 3.6.8; we used the DL framework TensorFlow 2.3.0 (Abadi et al., Citation2016) to facilitate the process of constructing DL models. We published the source code on GitHub to make our approach transparent and replicable.Footnote5
6. Results
6.1. Determining a threshold for noisy data removal
To determine the noisy data removal threshold for which the CNN model achieves the highest f1-score, we conducted five experiments for each of the four data sets; one per reconstruction error threshold. We performed a grid search in addition to the TPE hyper-parameter search. To this end, we set the value of the reconstruction error threshold to the
,
, up to the
percentile of the reconstruction errors
. We did not investigate threshold values lower than the
percentile because these values would have removed an excessive amount of data from our event logs. Further, the case in which the threshold was set to the
percentile is not reported here since we used this setting as the baseline for workaround detection when no process instances were removed by the AE. exhibits the f1-scores for each event log and threshold value.
Figure 5. F1-Score of the CNN for different reconstruction error thresholds and data sets.
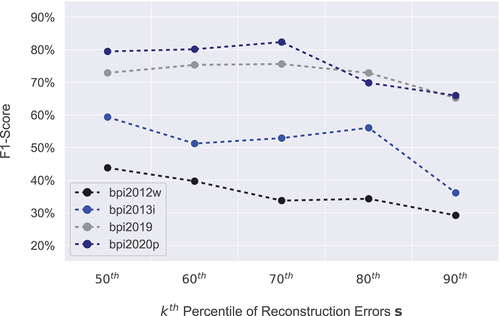
For the bpi2020p and bpi2019 event logs, the highest f1-score ( and
) was achieved at the
percentile of reconstruction errors
. The threshold indicates that the AE removed less than half of the process instances from the training sets of the event log. Then, per event log, the removed process instances were compensated for normal process instances that were randomly selected from the remaining training set. In contrast, for bpi2013i and bpi2012w, the highest f1-score (
and
) was achieved at the
percentile of the reconstruction errors
. Hence, the AE clearly removed more process instances from the training sets of the event log than in the case of bpi2020p and bpi2019. Consequently, more process instances were compensated for normal process instances that were randomly selected from the remaining training set.
Further, the identified reconstruction error threshold , indicating which process instances were removed or retained, differs for each event log. In the bpi2012w event log, the value of the error threshold
, representing the
percentile of the reconstruction errors
, is
. It was the lowest value across all data sets. In bpi2013i, the error threshold
, which is also the
percentile of the reconstruction errors
, exhibited the second-lowest value of
among the event logs. Concerning bpi2019, the error threshold value
was slightly higher than in bpi2013i and significantly higher than in bpi2012w. It represented the
percentile of the reconstruction errors
. Finally, in the bpi2020p event log, the threshold value was
, which was the highest among the event logs. Here, the threshold is also the
percentile of the reconstruction errors
.
6.2. Test results for workaround detection
We trained a classifier based on each training set, and these classifiers were subsequently tested using the corresponding test sets. presents the quality metrics for each classifier. In the following, we focus on the results obtained using the AE (for noise removal), as they are the best across all data sets and in terms of all metrics.
Table 9. Test results for workaround detection in four data sets.
The method correctly detected 379 process instances as workarounds in the case of bpi2019 and 362 process instances in bpi2020p. In contrast, it correctly detects fewer workarounds for the bpi2013i (275) and bpi2012w (254) event logs. Further, the number of false classifications is smaller for bpi2020p (66) and bpi2019 (108) than for bpi2013i (150) and particularly bpi2012w (255). We also obtain higher accuracy, precision, recall, and f1-score values for the bpi2020p and bpi2019 event logs than for bpi2013i and bpi2012w, even though more noisy data are removed from bpi2013i and bpi2012w. reports the detection quality for each workaround class based on the bpi2020p event log.
Figure 6. Test results for detecting each workaround class based on the bpi2020p event log.
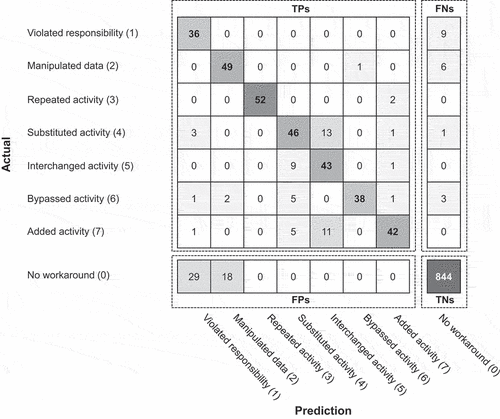
Regarding differentiating between a workaround (comprising the different workaround classes (1) to (7)) and no workaround (representing the class (0)), the number of FPs (47) was higher than the number of FNs (19) and included two erroneous classifications. First, the CNN incorrectly detected 29 process instances of the class no workaround to include a workaround, in particular a violated responsibility. Similarly, 18 process instances with no workaround were falsely classified as a workaround, particularly manipulated data. The number of FNs, however, was low and primarily consisted of not-detected workarounds referring to the types violated responsibility (9) and manipulated data (6).
In the entire group of TPs (i.e. the workaround classes (1) to (7)), there were only two obvious misclassifications. First, a substituted activity was occasionally misclassified as an interchanged activity (13) and vice versa (9). Second, 11 workarounds of the type added activity were misclassified as an interchanged activity. Overall, repeated activities were classified most reliably.
6.3. Results for workaround detection
The classifiers were applied not only to analyse the testing set but also to analyse the detection set itself. reports the results of this step. Again, in the following, we primarily focus on the results obtained using the AE since they were generally better across all data sets. The differences between the results obtained with and without the removal of noisy data were particularly extreme for bpi2013i and bpi2012w. Without using an AE, the number of detected workarounds dropped from 304 to 34 (dropping 89%) for the bpi2013i event log, and from 573 to 247 (dropping 57%) for the bpi2012w event log. In contrast, the drop for bpi2019 was from 162 to 34 (dropping 79%), whereas for bpi2020p it was 195 to 39 (dropping 80%).
Table 10. Results for workaround detection.
Overall, the detection of workarounds was effective across different workaround types, with the exception of manipulated data and violated responsibility, which were detected infrequently. Next to no workaround, repeated activities were detected most frequently by far, followed by bypassed activities.
Just like the results regarding the test set, the quality in the detection set varied across the event logs analysed. As before, we noticed differences between the event logs of bpi2012w and bpi2013i, and bpi2019 and bpi2020p in several regards. First, the number of process instances with no workaround appeared to be lower in the first two event logs. Second, the number of process instances classified as a repeated activity was distinctly higher than in the last two event logs. Also, the bpi2012w event log exhibited a particularly large number of instances that were classified as bypassed activities compared with the other event logs. We interpret that this is followed by removing noisy data.
In general, detecting workarounds in event logs using the proposed DNN-based method was particularly effective for the bpi2020p and bpi2019 event logs since their analysis revealed a larger number of workarounds detected for the former (195) than for the latter (162). Even though cases of manipulated data were detected infrequently in both event logs, bpi2020p exhibited by far the highest number of process instances classified as violated responsibilities. Generally, the proposed method detected more workarounds in the bpi2020p event log across most classes, except for repeated activities, bypassed activities, and manipulated data, which were more frequently discovered in the bpi2019 data set.
6.4. Demonstration of workaround detection
Besides the quantitative evaluation of our method, we evaluate the method’s usefulness. To this end, we present an exemplary process instance per workaround type detected with our method in the bpi2020p event log and provide an explanation as to why the example includes a certain type of workaround. Additionally, we discuss the benefit of detecting this specific workaround.
6.4.1. Violated responsibility
The declaration was rejected by the role missing (). This indicates a violated responsibility because no concrete role, such as employee or supervisor, was entered. It seems that someone who rejected the permit was not allowed to do it. Therefore, the role is missing, and the declaration had to be submitted again by an employee. Hence, the detection of this workaround can be considered as violated user rights.
Table 11. Exemplary process instance of bpi2020p with violated responsibility.
6.4.2. Manipulated data
The data attribute overspent has the value “false” although the budget owner is involved (). This indicates that data manipulation took place because the budget owner is typically involved when the budget is overspent. As this workaround is detected, it can be checked why the budget owner approved this declaration even though not too much budget was spent.
Table 12. Exemplary process instance of bpi2020p with manipulated data.
6.4.3. Repeated activity
The permit was submitted and approved twice. This indicates a repeated activity (). A viable explanation for this repetition may be the rejection of the initial permit because some details were missing. It can be argued that an employee submitted an incomplete permit on purpose. Typically, it is time-consuming to figure out all information, and in most cases, not all information is required. Therefore, only if the permit is rejected, the employee takes the time to find out the missing information. Based on this workaround, relevant details for permits can be discussed to avoid or reduce activity repetitions.
6.4.4. Substituted activity
The director performed the final approval of the permit instead of the supervisor (). This indicates a substituted activity because a supervisor typically approves the permit of an employee. However, a possible explanation could be that this trip is of high relevance, and therefore, the director approved the permit directly. Based on this information, we can see that the director intervenes to avoid possible rejection of this trip by the supervisor. As this workaround is detected in an organisation, the type of final approval should be discussed. Further, more transparency should exist, which can be achieved when supervisors only approve permits.
6.4.5. Interchanged activity
The permission was submitted and approved after the trip starts (). This indicates an interchanged activity. It seems that an employee forgot to submit the permit prior to the trip because the employee submitted it on the second day of the trip. However, based on this workaround, the employee can be asked why the permit was submitted with a delay of one day. This way, more context information can be gathered, e.g., if an employee got an oral confirmation from his supervisor before the trip, saving time by performing this workaround.
6.4.6. Bypassed activity
Although the permit was neither approved by the pre-approver and employee nor approved by the supervisor, the employee carried out the trip (). This indicates a bypass of activities. However, a possible explanation could be that the employee is also a supervisor. Consequently, the employee did not require approval from the supervisor as he can approve his own trips. As this workaround is detected, the organisation should allow switching roles from employee to supervisor within the system. This would increase transparency because the supervisor’s role can be documented.
6.4.7. Added activity
The employee requested pre-payment before the trip starts (). Therefore, three request-for-payment activities were added. It could be that this trip was very expensive, and the employee did not have sufficient funding to cover the travel expenses or cannot wait until the refund. Based on this workaround, we can see that employees with low liquidity will send a request for payment. Otherwise, they cannot carry out the trip.
7. Discussion
With our method for detecting workarounds, we specifically address a research gap identified by Breuker and Matzner (Citation2013). We demonstrate that event logs can be a valuable data source for studying workarounds – intentional deviations from organisational routines and business processes performed by humans. While related research centres on explaining how and why employees perform workarounds (Beerepoot & van de Weerd, Citation2018), an automatic detection method might identify additional information undiscoverable with empirical research methods and remedy biases that limit their applicability (Beerepoot et al., Citation2018; Röder et al., Citation2015a). Inspired by anomaly and deviation detection methods, we provided a new and highly requested approach for detecting and analysing workarounds in event logs.
7.1. Results
A quantitative evaluation with empirical data documented that the proposed method was capable of detecting most workarounds in the event logs. However, our results also show that detecting workarounds with high quality requires applying sound strategies for noisy data reduction. Noisy data represents any form of deviance in an event log and, therefore, may lead to a method to discover false positives and false negatives. For all event logs considered in the evaluation, the proposed method detected workarounds more accurately if noisy data was previously removed by using an AE. Unsurprisingly, we conclude that noisy data, which is inherently present in real-life event log data, can adversely affect the learning process of the CNN model for workaround classification.
Distinguishing two classes – workarounds and no workarounds – enabled us to achieve the highest detection quality for workarounds in the bpi2020p and bpi2019 event logs. In the former log, 379 process instances were correctly detected as workarounds, whereas 362 were detected in the latter log. Regarding the number of false classifications, 66 process instances were falsely detected in bpi2020p, compared with 150 in bpi2019. As we distinguished eight workaround classes, we achieved an accuracy of 90.40% (90.30%), a precision of 80.40% (76.60%), a recall of 80.40% (79.30%), and a f1-score of 82.30% (71.60%) for bpi2020p (bpi2019). All four metrics highlight that the method was effective in identifying workarounds in these two event logs.
In contrast, only 254 and 275 workarounds were correctly detected in the bpi2012w and bpi2013i event logs, respectively. The number of false classifications was also much higher for both event logs than for bpi2020p and bpi2013. Regarding the detection of different workaround types, the most noticeable difference in the bpi2020p and bpi2019 event logs was in terms of precision, recall, and f1-score. For bpi2020p (bpi2019), precision was more than 19% (15%) higher than for bpi2012w and bpi2013i. Likewise, the recall for bpi2020p (bpi2019) exceeded that for the other two logs by at least 14% (13%). The f1-score for bpi2020p (bpi2019) is also more than 23% (16%) higher than for the other two event logs.
Concerning our method’s main purpose – detecting potential workarounds – we conclude that it is riskier to misclassify process instances as false negatives than false positives. A false negative represents a process instance with a workaround that has been falsely detected as a normal process instance. This means that a potential workaround remains hidden in the event log data and is not explored further by a process analyst. In this case, the workaround will not lead to a formal improvement of a business process, while it will remain undiscovered and, potentially, misclassified as an anomaly or deviation. In contrast, a false positive is a normal process instance falsely classified to contain a workaround. While we assume that a process analyst will identify the false classification manually when inspecting the data, the approach would serve to filter out all instances not containing workarounds.
Further, the test detection results for the bpi2020p event log demonstrated that the proposed method occasionally misinterpreted no workarounds as violated responsibilities. This could be accounted for by the resource attribute’s semantic granularity, as the resource attribute differs between abstract roles and specific actors performing the activities. Moreover, the results demonstrated that workarounds of the type substituted activity were often mixed with workarounds of the type interchanged activity. This observation can be explained by the similarity of these workaround types, which is difficult to distinguish automatically without further context information.
Interestingly, concerning the detection results, two workaround types appeared to have lower detection rates. First, violated responsibility may be quite difficult to detect. Considering real-life scenarios of daily work, it is reasonable to assume that violated responsibility may not always be documented in event logs. For instance, an employee might provide a co-worker with access to a database, PC workstation, or other resources (e.g. by sharing their password), and this would not be detected by the system. In other processes, activities may be assigned to user roles such that they are mapped to a group of employees, complicating the detection of violations if an access control list is unavailable. Second, the detection rate of manipulated data is lower than the average detection rate of other workarounds. We conclude that this workaround type is not likely to occur in structured processes in which the control flow is strictly defined.
Our results demonstrate that workarounds can be detected very well in mass-transaction data and highly structured processes that exhibit fewer variations in the control flow of a process, such as the travel permit process documented in bpi2020p or the purchase-to-pay process documented in bpi2019 (). This finding can be attributed to the fact that employees often have relatively clear instructions, limited flexibility, and restrictive software tools limiting their ability, and maybe their need, to perform workarounds in these processes. In the case of processes with greater variability, employees are expected to instantiate process instances differently each time; in this case, the processes’ comparability is reduced and, therefore, distinguishing a workaround from the usual variance in a process is more complex. The event logs bpi2013i and bpi2012w (), which we used to evaluate our method, represent service processes that, by definition, need to be conducted cooperatively with customers. Therefore, it appears straightforward to assume that training a DNN requires significantly more data before an algorithm can distinguish a workaround from other deviations in a process.
Finally, data richness in an event log can, of course, affect the detection quality of workarounds. As shown in , the number of activities in the bpi2013i and bpi2012w event logs is lower than in bpi2020p or bpi2019. Hence, we assume that employees have fewer options to perform workarounds in these processes.
7.2. Managerial implications
Besides their scientific contribution as the first method guiding the detection of workarounds in event logs and their classification, our results provide profound value to managers. By detecting workarounds with our method, management has new opportunities to establish bottom-up process innovation in organisations. In a hyper-connected world, organisations are faced with an increasing need to innovate their processes, while the processes also become increasingly complex, involving unstructured data, additional participants, and, perhaps, even data from physical devices that are digitally networked (Beverungen et al., Citation2021). Resolving this paradox requires organisations to apply agile principles, e.g., by establishing teams of process managers and process participants that improve business processes in iterative cycles (Beverungen et al., Citation2021).
To inform cooperation and knowledge exchange for process improvement, workaround detection may be a useful tool to complement process participants’ tacit insights with hard field evidence, based on which workarounds, their consequences on a process, and their implications for the organisation can be assessed. Both interpersonal and data-driven aspects can enable workshop formats in which process managers and process participants decide if a workaround is accepted as a standard procedure, defined as a fallback solution, or discarded.
Besides process innovation, our method can also be used in organisations to trigger product innovation. For example, as employees or customers perform workarounds by using an information system differently than designed, managers can detect this deviation and deviate implications for a new system’s design with higher user-friendliness.
To further elicit our workaround detection method’s potential and limitations, we conducted expert interviews with employees from GEA,Footnote6 Process Inc.,Footnote7 Process&,Footnote8 CelonisFootnote9 and Software AGFootnote10 (). All interviews took place via video conferencing systems, were recorded, and transcribed.
Table 13. Exemplary process instance of bpi2020p with repeated activities.
Table 14. Exemplary process instance of bpi2020p with substituted activity.
Table 15. Exemplary process instance of bpi2020p with interchanged activity.
Table 16. Exemplary process instance of bpi2020p with bypassed activity.
Table 17. Exemplary process instance of bpi2020p with added activity.
Table 18. Details on interview partners.
An initial observation we derived from our interviews is a conscious distinction between workarounds and anomalies by our informants. For example, I1 distinguished workarounds from anomalies, emphasising that his understanding is that anomalies can, for example, be related to technical changes in a software that cannot be anticipated, whereas he consider[s] a workaround to be a deviation performed consciously by participants, leading them to, for example, do something differently or skip an activity. In a similar vein, I3 confirmed the idea that workarounds are typically human-driven. In light of the long-standing tradition of business process modelling and management in many companies, I4 assumed that there are few anomalies left. […] It’s more like a single person saying “I have my own workaround here”. […] That’s primarily where we see things pop up that deviate from the standard.
Thus, from the perspective of process managers, detecting and classifying workarounds, as done with our approach, is considered an important tool for improving business processes in close cooperation with process participants. Currently, workarounds are used to improve processes, but no tool-supported method is in place. Even so, workarounds are viewed as valuable input for implementing process innovation. As I1 stated, they introduced a new process to the participants. Then, somebody sitting in the last row said “I always do it that way”, and this was a much better process than the one we defined, such that we updated our process. On the other hand, people also deviate from processes for their own reasons, sometimes even resisting standard processes in a creative way. This creativity inherent in the concept of workarounds is also stressed by I4, mentioning the importance of differentiating between the creative deviations from the standard process and the intentionally malicious deviations.
This somewhat ambiguous nature of workarounds, which we stress in our conceptualisation, is also recognised by practice. On the one hand, workarounds may be expressions of employees’ reluctance to process innovation, resulting in using old ways of working instead of standard processes (e.g. I1 mentioned employees keeping documenting their working hours using the standard transaction KB21N in SAP instead of using SAP CATS; or using MS Project, while they were unable to use another project management tool). Interestingly, I2 shared the impression that usually, anomaly detection focuses on this negative side. On the other hand, in line with the previously discussed temporality of workarounds, several of the practitioners we consulted also acknowledged the innovative capacity provided by workarounds. A recurring theme in this regard was the impetus for the redesign of processes provided by the identification of best practices by people who live the process as part of their day-to-day work leading to adaptations of a process that may potentially be outdated and reality has moved on (I5).
Importantly, however, the assessment of whether a workaround is positive or negative is always in the eye of the beholder, as pointed out by I4, with the evaluation of workarounds never being black or white (I3). Workarounds can have consequences on other activities carried out in a process. Sometimes, their negative consequences can even outweigh their local advantages for a participant. Indeed, another informant (I1) stated that they often realised that local improvements could have adverse effects on a process level that manifest down the road. Thus, it is important to manage workarounds on a process level beyond the local context in which they are performed. For this purpose, GEA, for example, has established procedures to identify the consequences of individual changes on a process level.
While practitioners are typically well aware of workarounds, there is no structured approach for identifying and classifying them, even if such a method is highly desired. I1 highlighted that it is not easy to make workarounds visible. However, practitioners still employ different approaches to detect workarounds, with I5 stating that without such a data-driven method, a process analyst would probably only conduct a few interviews or only grasp a small slice of reality. As a result, the experts we consulted overall acknowledged the usefulness of our proposed method. For example, GEA has established Lean Boards as regular meetings to discuss improvements in their organisation. Sometimes, these meetings are used for knowledge exchange in process improvements (people learn from each other, and we (as process managers) learn how we can improve our processes (I1)). An approach such as the one introduced in this paper could enable GEA to introduce workarounds into their Lean Board meeting in a more complete and structured way since it can help to identify workarounds early, bring people together to discuss their ideas with a clear reference to a process, and back up practice with data on workarounds and their consequences on a process. Thus, I1 stated that it would be nice to have a tool in which we can see workarounds, such that we can talk to people to find out why they work differently. Classifying the type of workarounds – as done by our method – could help to focus these discussions, since sometimes we do not realise that people establish access rules to perform a process entirely, violating our standard processes. Similarly, I5 emphasised the importance of being able to differentiate between different classes of workarounds, thus stating that as a process mining vendor, I could definitely see us embed this into our offerings.
7.3. Related work
In line with the research gap identified by Breuker and Matzner (Citation2013), that is, the missing connection between PM methods and research on organisational routines, our intended knowledge contribution resides at the intersection of exaptation and invention (Gregor & Hevner, Citation2013). It can partly be classified as exaptation because dedicated ML-based methods for the detection of anomalies and deviations have already been developed in the field of PM. We transfer the core idea behind these ideas to the application domain of workarounds. However, our work also goes beyond pure exaptation, because our proposed workaround detection method displays differences to these related methods conceptually and in terms of its concrete design.
Conceptually, the starting point of our method is the peculiarities of workarounds, which differ from anomalies and deviations in three regards. As a first conceptual difference (), workarounds are driven by humans’ intentions, as opposed to concepts that describe (un-)intentional errors made by humans or machines. For this reason, workarounds are intention-driven, more complex to discover, and can manifest in other ways than anomalies and deviations. Second (
), workarounds evolve through a life-cycle spanning from their first appearance to their institutionalisation, whereas anomalies and deviations might re-appear over time but do not constitute temporal drift in a business process. Over time, the roles of a workaround and a standard process can shift if a workaround diffuses through an organisation and is adopted as the new standard process. This shift implies that workaround detection methods should consider the life-cycle stage of a workaround to deliver interpretable results, while methods for detecting anomalies and deviations are time-invariant. Because this paper is an early investigation of the role of PM in workaround detection, we only consider workarounds’ first phase of the life-cycle, focusing on the detection of temporal changes. Third (
), workarounds can yield positive effects in an organisation, while anomalies are per se undesirable deviations from pre-specified standard processes. Thus, process managers need to decide if unusual behaviour is a workaround that can provide process innovation or an undesirable deviation.
These conceptual peculiarities of workarounds guided the design of our method. Thus, they are reflected in some choices we made in contrast to other, state-of-the-art anomaly and deviation detection methods, such as the anomaly detection method by Nolle et al. (Citation2019) and the deviation detection method by Folino et al. (Citation2020). More specifically, these choices are related to data input, phases, and detection classes (). In view of the still-nascent character of our research endeavours to build a bridge between organisational routines and BPM, not all the conceptual differences are entirely integrated into our method. Nevertheless, we refer to them for guidance in the following to indicate the lines of thought that led us to deviate from existing approaches.
Table 19. Differentiation of our workaround detection method’s design from state-of-the-art anomaly and deviation detection methods.
, for example, is reflected in our method in terms of data input, as our method requires event log data with activities performed by human actors to detect workarounds. While such a limitation would theoretically also be possible through adaptations of other methods, the anomaly detection method of Nolle et al. (Citation2019) and the deviation detection method of Folino et al. (Citation2020) do not set such a focus but instead include other types of activities as well (
).
Especially also guided the design of several phases of our method in which we deviate from related work. More specifically, our conceptual focus on workarounds is primarily reflected in three differences with regard to the work of Nolle et al. (Citation2019) and Folino et al. (Citation2020). First, in the second phase, our method removes noisy data (i.e. all forms of divergent behaviour) using an AE. This is especially important for workaround detection because other forms of divergent behaviour, intentional or not, may blur workaround patterns. In contrast, Nolle et al. (Citation2019)’s anomaly and Folino et al. (Citation2020)’s deviation detection method do not include such a noisy-data-removal phase.
Second, in the third phase, our method adds workarounds to of the process instances that are randomly selected from the training set. To create these workarounds, the method uses rules with randomised elements to create complex workaround patterns that may be expected as a result of human behaviour. In contrast, Nolle et al. (Citation2019)’s anomaly and Folino et al. (Citation2020)’s deviation detection methods do not include a phase for adding anomalies and deviations to the training set. While Nolle et al. (Citation2019) evaluated their method with synthetic and anomaly-enriched real-life data sets, Folino et al. (Citation2020)’s method received as input real-life data sets with deviation labels created based on values of single data attributes (static rules).
Third, in the fourth phase, our method learns a CNN classification model to classify process instances directly based on eight concrete workaround classes. This enables our method to classify complex, temporal workaround patterns that, again, are the result of human behaviour. Whereas other state-of-the-art approaches also partially rely on ML, they often turn to static rules for the step of classification. For example, Nolle et al. (Citation2019) learned a multi-task DNN model with gated recurrent units to predict next events (i.e. activities and next values for all data attributes). Based on the probability distribution of predictions, the authors calculated scores to detect which attributes of a process instance indicate an anomaly or not. The classification of process instances into specific anomaly classes was subsequently achieved via static rules based on these scores. Further, Folino et al. (Citation2020) learned a meta classification model, including an ensemble of sub-classification models, to detect whether a process instance is a deviation or not. Deviations were not further classified by specific deviation classes.
Fourth and importantly, a meaningful assessment of workarounds along with their impact requires a rather granular classification. Thus, whereas many existing methods (e.g. Folino et al., Citation2020) merely rely on binary classification, our method uses a more differentiated approach. Of course, there have also been valuable approaches, such as the method proposed by Nolle et al. (Citation2019), which offer a more granular classification. Still, whereas some of the detected classes such as attribute (manipulated data), rework (repeated activity), skip (bypassed activity), and insert (added activity) are similar to our approach, we attempted to reflect the importance of workaround differentiation in additional classes and an implicit focus on intentional behaviour as opposed to, for example, machine errors.
Despite the guiding character of the conceptual differences between workarounds, anomalies, and deviations for our work, not all of the factors are evident in our method at first glance. Whereas is prominently reflected in the choices we made that are described above,
and
are nevertheless discernible in our method’s design. For example, the randomised addition of workarounds is, to a certain extent, intended to mimic the temporality of workarounds. Similarly, the premise of an unbiased assessment of workarounds as both potentially positive or negative guided the conceptualisation of our detection classes.
7.4. Limitations
Even though the proposed workaround detection method’s results and implications are encouraging, our method is subject to some limitations. First, the evaluation suggests that some workaround types may be more difficult to detect than others using PM methods (Outmazgin & Soffer, Citation2016). For instance, if employees use a mix of different information systems to perform a task, workarounds may no longer be detected based on event logs from one system only. Therefore, a triangulation of data from multiple sources provides a new lens for understanding workarounds. Second, we focused exclusively on workarounds that can be detected in an event log. Hence, we did not consider manual workarounds because such workarounds leave no digital data traces. Third, our method detects workarounds in event logs that do not include a ground truth workaround label. To the best of the authors’ knowledge, such a labelled event log does not exist yet. In addition to such an event log, a to-be process model for the underlying process could be beneficial because it facilitates the assessment of workarounds. However, event logs with a missing label are a common problem in PM, especially in the sub-field of anomaly detection (Nolle et al., Citation2019). To overcome this problem, developed methods were evaluated based on synthetic and/or manipulated event logs representing reality to a certain degree. Since our method’s CNN model is trained based on event log data with artificially added workarounds, the CNN can learn to recognise these patterns but not causal representations that could be learned from real-life event log data with a ground truth workaround label. Fourth, due to the absence of qualitative insights about the process instances performed by employees, it cannot be assured whether workarounds exist in the noisy data removed from the event logs, whether workarounds exist in the remaining normal portion of the event log data, or whether the noisy data include regular variations of a process that are not workarounds. Fifth, the implemented specification of the workaround types is subject to design decisions that were made during neural network training; these decisions may distort the nature of particular workarounds to a certain degree (), as workarounds may manifest themselves differently depending on the specific behaviour in an event log. As suggested by Nolle et al. (Citation2019), we alleviate this problem by using randomised elements in the specification of the different workaround types. As another, the imbalance of workaround classes can decrease the detection quality of the proposed method. In particular, the learning process of a CNN, as used here, can be negatively affected by class imbalance (Buda et al., Citation2018). Finally, despite the positive assessment of our proposed method by the consulted practitioners, stressing the importance of detecting workarounds at an early stage, it also became apparent that there is a need for further methodological support along the workaround life cycle.
8. Conclusion
Drawing on PM and ML, we designed the first DNN-based method for the automatic detection of the complex phenomenon of workarounds in event logs. An evaluation involving four public event logs demonstrated that the proposed method is capable of detecting workarounds with high accuracy, precision, recall, and f1-score, especially for business processes with fewer variants and a higher number of different activities. Workarounds are ubiquitous in organisations and frequently occur when information systems are used. Often, workarounds remain undetected because employees do not report deviations regarding a business process or the use of an IT artefact. A failure to detect a workaround can lead to an undesirable, gradual manifestation of the workaround in organisational structures (Tucker et al., Citation2014), exerting positive or negative consequences. Also, adding to the unawareness of the actions of their employees, managers often lack easily applicable methods and tools to analyse and improve their business processes. By providing a method for automatically detecting potential workarounds, we make a significant contribution to research and practice, as workarounds can be easily identified, and actions can be taken to either counteract or leverage them.
In summary, our work strengthens the connection between research on organisational routines and PM. Both disciplines prove to remain astonishingly separated, even if they investigate similar phenomena (Breuker & Matzner, Citation2014). Additional research is required to further study and establish a nexus between both disciplines. To extend our method’s scope of detection, additional workaround types can be specified. To further increase the detection quality of our method, the utility of more elaborated methods removing noisy data (e.g. an AE with long short-term memory cells (Hochreiter & Schmidhuber, Citation1997)) can be investigated, “traditional” ML algorithms (e.g. a “shallow” neural network) or other types of DL algorithms (e.g. a generative adversarial network, a transformer network or a graph neural network) can be used for workaround classification, or the class-imbalance problem of the CNN can be addressed (e.g. by applying an oversampling method (Buda et al., Citation2018)). Researchers can further analyse the noisy data that are removed from the event logs by using the AE to better understand the considered workaround types, or to identify additional workaround types or other forms of deviation. Another direction for future research is to decompose the learning problem of workaround classification. The present method uses a single CNN model for that purpose. Instead, workaround classification could be performed by two ML models; the first would detect whether a workaround occurs in a process instance or not, whereas the second would detect the concrete workaround type in the case of a workaround occurrence. Further, researchers can investigate the utilisation of methods from explainable artificial intelligence to determine which parts of a process instance constitute a detected workaround. For example, such a method can calculate a relevance value for each attribute of a process instance, describing the attribute importance regarding a detected workaround type (Stierle et al., Citation2021). This would be beneficial for the analysis of detected workarounds, especially in long process instances. Finally, researchers can extend the present method to detect multiple workarounds per process instance, even if the workaround types are different. To this end, a CNN, as used in this work, may be a promising solution because of its shared parameter capability, which enables using the same weight vector in a feature map to determine the same patterns at different positions in the event log data.
Disclosure statement
No potential conflict of interest was reported by the author(s).
Correction Statement
This article has been republished with minor changes. These changes do not impact the academic content of the article.
Additional information
Funding
Notes
1. This paper is an extended and revised version of a previous work published in the proceedings of the 28th European Conference on Information Systems (Weinzierl et al., Citation2020). This paper mainly differs from its previous version in three ways. First, we extended the theoretical background in this research by providing more in-depth insights regarding the temporality of workarounds and the difference between related concepts, such as anomalies and deviations. Second, we added a formalism to the artefact section to improve the traceability of our method’s phases and extended the evaluation by heuristically determining the threshold for removing noisy data and adding a demonstration for workaround detection to provide further evidence for our method’s usefulness. Third, this paper provides a broader discussion regarding results, managerial implications, differentiation from related work, and limitations.
2. Note: For better readability, we denote as
.
3. Note: In our running example, which is shown in , each column (e.g. ) represents two separate columns in a matrix.
4. Note: “Noisy data” is not equivalent to “noise”. “Noise” is a sub-type of anomalies (Section 2).
6. GEA Group AG is one of the world’s largest systems suppliers for the food, beverage and pharmaceutical sectors. The informant is a leading process manager in GEA’s central business process management office. He is responsible for tracing and improving end-to-end processes in the entire organisation.
7. Process Inc. is a pseudonym used for confidentiality reasons. The informant is a software engineer for PM solutions.
8. Process& GmbH is a software and consulting company focusing on PM and analytics. The informant is a data scientist responsible for the development of advanced analytics solutions.
9. Celonis SE is one of the world’s largest providers of PM solutions. The informant is a high-level manager responsible for the identification and realisation of value potentials through PM.
10. Software AG is a large provider of software solutions focusing to a large extent on the design and analysis of business processes. The informant is a high-level product manager for PM solutions.
References
- Abadi, M., Barham, P., Chen, J., Chen, Z., Davis, A., & Dean, J., … others. (2016). Tensorflow: A system for large-scale machine learning. In Proceedings of the 12th USENIX Symposium on Operating Systems Design and Implementation (OSDI2016) (pp. 265–283).
- Al-Jebrni, A., Cai, H., & Jiang, L. (2018). Predicting the next process event using convolutional neural networks. In Proceedings of the International Conference on Progress in Informatics and Computing (PIC2018) (pp. 332–338).
- Alter, S. (2014). Theory of workarounds. Communications of the Association for Information Systems, 34(55), 1041–1066. https://doi.org/10.17705/1CAIS.03455
- Alter, S. (2015). A workaround design system for anticipating, designing, and/or preventing workarounds. In Proceedings of the 16th International Conference on Enterprise, Business- Process and Information Systems Modeling (BPMDS2015) (pp. 489–498). Springer.
- Azad, B., & King, N. (2012). Institutionalized computer workaround practices in a mediterranean country: An examination of two organizations. European Journal of Information Systems, 21(4), 358–372. https://doi.org/10.1057/ejis.2011.48
- Beerepoot, I., Lu, X., Van De Weerd, I., & Alexander Reijers, H. (2021). Seeing the signs of workarounds: A mixed-methods approach to the detection of nurses process deviations. In Proceedings of the 54th Hawaii International Conference on System Sciences (HICSS2021) (pp. 3763–3772).
- Beerepoot, I., & van de Weerd, I. (2018). Prevent, redesign, adopt or ignore: improving healthcare using knowledge of workarounds. In Proccedings of the 26th European Conference on Information Systems (ECIS2018) (pp. 1–15).
- Beerepoot, I., van de Weerd, I., & Reijers, H. A. (2018). Detecting workarounds using domain knowledge-driven process mining. In Proceedings of the 39th International Conference on Information Systems (ICIS2018) (p. 1).
- Beerepoot, I., van de Weerd, I., & Reijers, H. A. (2019). Business process improvement activities: Differences in organizational size, culture, and resources. In Proceedings of the 17th International Conference on Business Process Management (BPM2019) (pp. 402–418).
- Bergstra, J. S., Bardenet, R., Bengio, Y., & Kégl, B. (2011). Algorithms for hyper-parameter optimization. In Proceedings of the 24th International Conference on Neural Information Processing Systems (NIPS2011) (pp. 2546–2554).
- Beverungen, D. (2014). Exploring the interplay of the design and emergence of business processes as organizational routines. Business & Information Systems Engineering, 6(4), 191–202. https://doi.org/10.1007/s12599-014-0335-3
- Beverungen, D., Buijs, J. C., Becker, J., Di Ciccio, C., van der Aalst, W. M., Bartelheimer, C., & others. (2021). Seven paradoxes of business process management in a hyper-connected world. Business & Information Systems Engineering, 63(2), 145–156. https://doi.org/10.1007/s12599-020-00646-z
- Bezerra, F., & Wainer, J. (2013). Algorithms for anomaly detection of traces in logs of process aware information systems. Information Systems, 38(1), 33–44. https://doi.org/10.1016/j.is.2012.04.004
- Bezerra, F., Wainer, J., & van der Aalst, W. M. (2009). Anomaly detection using process mining. In Enterprise, Business-Process and Information Systems Modeling (EMMSAD2018) (pp. 149–161). Springer.
- Bishop, C. M. (2006). Pattern recognition and machine learning. Springer.
- Böhmer, K., & Rinderle-Ma, S. (2016). Multi-perspective anomaly detection in business process execution events. In OTM Confederated International Conferences” On the Move to Meaningful Internet Systems” (OTM2016) (pp. 80–98).
- Borghesi, A., Bartolini, A., Lombardi, M., Milano, M., & Benini, L. (2019). Anomaly detection using autoencoders in high performance computing systems. In Proceedings of the 33rd Conference of the Association for the Advancement of Artificial Intelligence (AAAI2019) (pp. 9428–9433).
- Boudreau, M.-C., & Robey, D. (2005). Enacting integrated information technology: A human agency perspective. Organization Science, 16(1), 3–18. https://doi.org/10.1287/orsc.1040.0103
- Breuker, D., & Matzner, M. (2013). Statistical sequence analysis for business process mining and organizational routines. In Proceedings of the 21st European Conference on Information Systems (ECIS2013) (pp. 1–12).
- Breuker, D., & Matzner, M. (2014). Performances of business processes and organizational routines: Similar research problems, different research methods-a literature review. In Proceedings of the 22nd European Conference on Information Systems (ECIS2014) (pp. 1–13).
- Breuker, D., Matzner, M., Delfmann, P., & Becker, J. (2016). Comprehensible predictive models for business processes. MIS Quarterly, 40(4), 1009–1034. https://doi.org/10.25300/MISQ/2016/40.4.10
- Buda, M., Maki, A., & Mazurowski, M. A. (2018). A systematic study of the class imbalance problem in convolutional neural networks. Neural Networks, 106, 249–259. https://doi.org/10.1016/j.neunet.2018.07.011
- Chandola, V., Banerjee, A., & Kumar, V. (2009). Anomaly detection: A survey. ACM Computing Surveys, 41(3), 1–58. https://doi.org/10.1145/1541880.1541882
- Cuzzocrea, A., Folino, F., Guarascio, M., & Pontieri, L. (2016). A multi-view multi-dimensional ensemble learning approach to mining business process deviances. In Proceedings of the International Joint Conference on Neural Networks (IJCNN) (pp. 3809–3816).
- Da Cunha, J. V., & Carugati, A. (2009). Information technology and the first-line manager’s dilemma: Lessons from an ethnographic study. In Proceeding of the 17th European Conference on Information Systems (ECIS2009) (pp. 2834–2845).
- DeSanctis, G., & Poole, M. S. (1994). Capturing the complexity in advanced technology use: Adaptive Structuration theory. Organization Science, 5(2), 121–147. https://doi.org/10.1287/orsc.5.2.121
- Dunzer, S., Stierle, M., Matzner, M., & Baier, S. (2019). Conformance checking: A state-of-the-art literature review. In Proceedings of the 11th International Conference on Subject-Oriented Business Process Management (S-BPM2019) (pp. 1–10).
- Ejnefjäll, T., & Ågerfalk, P. J. (2019). Conceptualizing workarounds: Meanings and manifestations in information systems research. Communications of the Association for Information Systems, 45(1), 341–363.
- Folino, F., Folino, G., Guarascio, M., & Pontieri, L. (2020). A multi-view ensemble of deep models for the detection of deviant process instances. In Proceedings of the Joint European Conference on Machine Learning and Knowledge Discovery in Databases (ECML PKDD) (pp. 249–262).
- Gasser, L. (1986). The integration of computing and routine work. ACM Transactions on Information Systems, 4(3), 205–225. https://doi.org/10.1145/214427.214429
- Ghionna, L., Greco, G., Guzzo, A., & Pontieri, L. (2008). Outlier detection techniques for process mining applications. In Proceedings of the 17th International Symposium on Methodologies for Intelligent Systems (ISMIS2008) (pp. 150–159).
- Goodfellow, I., Bengio, Y., & Courville, A. (2016). Deep learning. MIT Press.
- Gregor, S., & Hevner, A. (2013). Positioning and presenting design science research for maximum impact. MIS Quarterly, 37(2), 337–355. https://doi.org/10.25300/MISQ/2013/37.2.01
- Grisold, T., Wurm, B., Mendling, J., & Vom Brocke, J. (2020). Using process mining to support theorizing about change in organizations. In Proceedings of the 53rd Hawaii International Conference on System Sciences (HICSS2020).
- Guo, S., Jin, Z., Chen, Q., Gotz, D., Zha, H., & Cao, N. (2019). Visual anomaly detection in event sequence data. In IEEE International Conference on Big Data (BigData2019) (pp. 1125–1130).
- Han, J., Pei, J., & Kamber, M. (2011). Data mining: Concepts and techniques (3rd ed.). Elsevier.
- Haykin, S. S. (1998). Neural networks: A Comprehensive foundation (2nd ed.). Pearson Prentice Hall.
- Hevner, A., March, S. T., Park, J., & Ram, S. (2004). Design science research in information systems. MIS Quarterly, 28(1), 75–105. https://doi.org/10.2307/25148625
- Hinton, G. E., & Salakhutdinov, R. R. (2006). Reducing the dimensionality of data with neural networks. Science, 313(5786), 504–507. https://doi.org/10.1126/science.1127647
- Hochreiter, S., & Schmidhuber, J. (1997). Long short-term memory. Neural Computation, 9(8), 1735–1780. https://doi.org/10.1162/neco.1997.9.8.1735
- Ignatiadis, I., & Nandhakumar, J. (2009). The effect of ERP system workarounds on organizational control: An interpretivist case study. Scandinavian Journal of Information Systems, 21(2), 59–90. https://aisel.aisnet.org/sjis/vol21/iss2/3
- Keskar, N. S., Mudigere, D., Nocedal, J., Smelyanskiy, M., & Tang, P. T. P. (2017). On large- batch training for deep learning: generalization gap and sharp minima. In Proceedings of the 5th International Conference on Learning Representations (ICLR2017) (pp. 1–16). openreview.net.
- Koopman, P., & Hoffman, R. R. (2003). Work-arounds, make-work, and kludges. IEEE Intelligent Systems, 18(6), 70–75. https://doi.org/10.1109/MIS.2003.1249172
- Lapointe, L., & Rivard, S. (2005). A multilevel model of resistance to information technology implementation. MIS Quarterly, 29(3), 461–491. https://doi.org/10.2307/25148692
- Laumer, S., Maier, C., & Weitzel, T. (2017). Information quality, user satisfaction, and the manifestation of workarounds: A qualitative and quantitative study of enterprise content management system users. European Journal of Information Systems, 26(4), 333–360. https://doi.org/10.1057/s41303-016-0029-7
- LeCun, Y. (1989). Generalization and network design strategies. In Connectionism in perspective. pp. 1-9. Elsevier: Citeseer.
- LeCun, Y., Bengio, Y., & Hinton, G. (2015). Deep learning. Nature, 521(7553), 436–444. https://doi.org/10.1038/nature14539
- Leonardi, P. M. (2011). When flexible routines meet flexible technologies: Affordance, constraint, and the imbrication of human and material agencies. MIS Quarterly, 35(1), 147–167. https://doi.org/10.2307/23043493
- Lu, X., Fahland, D., van Den Biggelaar, F. J., & van der Aalst, W. M. (2016). Detecting deviating behaviors without models. In Proceedings of the Business Process Management Workshops 2015 (BPMWS2015) (pp. 126–139). Springer.
- Malaurent, J., & Karanasios, S. (2020). Learning from workaround practices: The challenge of enterprise system implementations in multinational corporations. Information Systems Journal, 30(4), 639–663. https://doi.org/10.1111/isj.12272
- Nolle, T., Luettgen, S., Seeliger, A., & Mühlhäuser, M. (2018). Analyzing business process anomalies using autoencoders. Machine Learning, 107(11), 1875–1893. https://doi.org/10.1007/s10994-018-5702-8
- Nolle, T., Luettgen, S., Seeliger, A., & Mühlhäuser, M. (2019). BINet: Multi-perspective business process anomaly classification. Information Systems, 103:101772.
- Outmazgin, N. (2012). Exploring workaround situations in business processes. In Proceedings of the Business Process Management Workshops 2012 (BPM2012) (pp. 426–437). Springer.
- Outmazgin, N., & Soffer, P. (2013). Business process workarounds: What can and cannot be detected by process mining. In Proceedings of the 14th International Conference on Enterprise, Business-Process and Information Systems Modeling (BPMDS2013) (pp. 48–62). Springer.
- Outmazgin, N., & Soffer, P. (2016). A process mining-based analysis of business process workarounds. Software & Systems Modeling, 15(2), 309–323. https://doi.org/10.1007/s10270-014-0420-6
- Pauwels, S., & Calders, T. (2019). Detecting anomalies in hybrid business process logs. ACM SIGAPP Applied Computing Review, 19(2), 18–30. https://doi.org/10.1145/3357385.3357387
- Pentland, B. T., Liu, P., Kremser, W., & Hærem, T. (2020). The dynamics of drift in digitized processes. MIS Quarterly,(44(1), 19-48-. https://doi.org/10.25300/MISQ/2020/14458
- Pentland, B. T., Recker, J., & Wyner, G. (2017). Rediscovering Handoffs. Academy of Management Discoveries, 3(3), 284–301. https://doi.org/10.5465/amd.2016.0018
- Pimentel, M. A., Clifton, D. A., Clifton, L., & Tarassenko, L. (2014). A review of novelty detection. Signal Processing, 99, 215–249. https://doi.org/10.1016/j.sigpro.2013.12.026
- Polato, M., Sperduti, A., Burattin, A., & de Leoni, M. (2014). Data-aware remaining time prediction of business process instances. In Proceeding of the International Joint Conference on Neural Networks (IJCNN2014) (pp. 816–823). IEEE.
- Ramezani, E., Fahland, D., & van der Aalst, W. M. (2012). Where did i misbehave? Diagnostic information in compliance checking. In Proceedings of the 10th International Conference on Business Process Management (BPM2012) (pp. 262–278). Springer.
- Röder, N., Wiesche, M., Schermann, M., & Krcmar, H. (2014). Why managers tolerate workarounds-the role of information systems. In Proceedings of the 20th American Conference on Information Systems (AMCIS2014) (pp. 1–13). AIS.
- Röder, N., Wiesche, M., Schermann, M., & Krcmar, H. (2015a). Embracing a relational view of workarounds: An affordance perspective. In Proceedings of the 20th DIGIT Workshop (DIGIT2015). AIS.
- Röder, N., Wiesche, M., Schermann, M., & Krcmar, H. (2015b). Workaround aware business process modeling. In Proceedings of the 12th International Conference on Wirtschaftsinformatik (WI2019) (pp. 482–496). AIS.
- Röder, N., Wiesche, M., Schermann, M., & Krcmar, H. (2016). Toward an ontology of workarounds: A literature review on existing concepts. In Proceedings of the 49th Hawaii International Conference on System Sciences (HICSS2016) (pp. 5177–5186). IEEE.
- Safadi, H., & Faraj, S. (2010). The role of workarounds during an open source electronic medical record system implementation. In Proceedings of the 31st International Conference on Information Systems (ICIS2010) (pp. 1–10). AIS.
- Steeman, W. (2013). BPI Challenge 2013. Ghent University. Online;accessed 2019-03-29. https://data.4tu.nl/repository/\uuid:a7ce5c55-03a7-4583-b855-98b86e1a2b07
- Stierle, M., Weinzierl, S., Harl, M., & Matzner, M. (2021). A technique for determining relevance scores of process activities using graph-based neural networks. Decision Support Systems, 144(2021), 113511. https://doi.org/10.1016/j.dss.2021.113511
- Tucker, A. L., Heisler, W. S., & Janisse, L. D. (2014). Designed for workarounds: A qualitative study of the causes of operational failures in hospitals. The Permanente Journal, 18(3), 33. https://doi.org/10.7812/TPP/13-141
- van der Aalst, W. M. P. (2016). Process mining: Data science in action (2nd ed.). Springer.
- van der Aalst, W. M. P., Adriansyah, A., De Medeiros, A. K. A., Arcieri, F., Baier, T., & Blickle, T., … others. (2011). Process mining manifesto. In Proceedings of the Business Process Mangement Workshops (BPMWS2011) (pp. 169–194). Springer.
- van Dongen, B. F. (2012). BPI Challenge 2012. [Online;accessed 2020-10-06]. Eindhoven University of Technology. https://data.4tu.nl/repository/uuid:3926db30-f712-4394-aebc-75976070e91f
- van Dongen, B. F. (2019). BPI Challenge 2019. [Online;accessed 2020-10-06]. Eindhoven University of Technology. https://data.4tu.nl/repository/uuid:a7ce5c55-03a7-4583-b855-98b86e1a2b07
- van Dongen, B. F. (2020). BPI Challenge 2020. [Online;accessed 2020-10-06]. Eindhoven University of Technology. https://data.4tu.nl/collections/BPIChallenge2020/5065541
- Verbeek, H., Buijs, J., van Dongen, B., & van der Aalst, W. (2010). XES, XESame, and ProM 6. In Proceedings of the 22nd International Conference on Advanced Information Systems Engineering Forum (CAiSEForum2010) (pp. 60–75). Springer.
- Weinzierl, S., Revoredo, K. C., & Matzner, M. (2019). Predictive business process monitoring with context information from documents. In Proceedings of the 27th European Conference on Information Systems (ECIS2019) (pp. 1–10). AIS.
- Weinzierl, S., Stierle, M., Zilker, S., & Matzner, M. (2020). A next click recommender system for web-based service analytics with context-aware LSTMs. In Proceedings of the 53rd Hawaii International Conference on System Sciences (HICSS2020) (pp. 1542–1551). IEEE.
- Weinzierl, S., Wolf, V., Pauli, T., Beverungen, D., & Matzner, M. (2020). Detecting workarounds in business processes-a deep learning method for analyzing event logs. In Proceedings of the 28th European Conference on Information Systems (ECIS2020) (pp. 1–16). AIS.
- Wolf, V., & Beverungen, D. (2019). Conceptualizing the impact of workarounds-an organizational routines’ perspective. In Proceedings of the 27th European Conference on Information Systems (ECIS2019) (pp. 1–11). AIS.
- Zainuddin, E., & Staples, S. (2016). Developing a shared taxonomy of workaround behaviors for the information systems field. In Proceedings of the 49th Hawaii International Conference on System Sciences (HICSS2016) (pp. 5278–5287). IEEE.
Appendix
A: Mean squared error calculation of the AE
Algorithm 1 formulates the calculation of the mean squared error through the loss function of the AE. Here, the reconstruction error per process instance refers to the mean squared error, whereas the overall normalised reconstruction error
corresponds to the normalised mean squared error.
Algorithm 1: Mean squared error of the AE’s loss function.
Given:
1 // generated model output
2 // difference of matrices
3 // reconstruction errors
4 // number of attributes
5 // number of process instances
6 for to
do
7 // reconst. error (per instance)
8
9 end
10 // reconst. error (all instances).
B: Hyper-parameter configuration of the AE
summarises the optimised hyper-parameters (and their values) in the training phase of the AE.
Table B1. Hyper-parameter configuration for the AE.
Inspired by the work of Hinton and Salakhutdinov (Citation2006), the architecture of the AE consists of two components: an encoder and a decoder, where each component can be represented by dense layers. Thus, we check in the hyper-parameter optimisation AE architectures with three different settings of dense layers. In each setting, with layers,
layers are used for encoding, and
layers for decoding. Further, we vary the number of units (i.e. neurons) of all dense layers, except for the first and the last, through the parameter
. The value of
can be either set to
,
, or
. To ensure that the architecture has a balanced structure, we set the number of neurons of the first and the last layer to the number of attributes
of the receiving training set
, the number of neurons of the second and penultimate layer to
, and halve the number of neurons for the remaining layers. For example, if
has been assigned to the value
, and the architecture comprises five layers, the number of units assigned to the five layers are
,
,
,
, and
. Therefore, to reconstruct the input, the number of neurons in the input layer is equal to the number of neurons in the output layer. By default, the weights of the layers (i.e. kernels) are initialised with normal distributed values. In addition, we initialise the weights with uniformly distributed values. Regarding the activation function of the dense layers, we apply the three variants: linear, tanh, and relu, with tanh being the default. For optimisation, we use either adam or nadam for the AE models with a mean squared error loss. Regarding the other parameters of these algorithms (e.g. learning rate), we use the default values. Finally, to train the AE models, we set the batch size to
, where the gradients are updated after each 128th process instance because larger sizes tend to sharp minima, and generally, a sharp minimum results in reduced generalisability (Keskar et al., Citation2017).
C: Hyper-parameter configuration of the CNN
summarises the optimised hyper-parameters (and their values) in the training phase of the CNN.
Table B2. Hyper-parameter configuration for the CNN.
We first optimise the number of convolutional layers in the CNN architecture. In addition, to the input layer and the two dense layers at the end of the architecture, the number of convolutional layers could be two, three, four, or five. From a technical perspective, a flatten layer is used to transform the three-dimensional output of the last convolutional layer to a two-dimensional representation for the subsequent dense layer. However, the number of layers in does not include the flatten layer because it is a technical operation for transforming data structures rather than a neural network layer. Hence, the deepest CNN architecture consists of eight layers, whereas the shallowest has five layers. In line with Al-Jebrni et al. (Citation2018), we investigate deeper architectures with two or more convolutional layers to better discover structures in event log data that may indicate different workaround types. Further, each convolutional layer can be decomposed into a convolution, a detector, and a pooling stage (Goodfellow et al., Citation2016). Regarding the convolutional stage, we optimise the number of filters (i.e. ,
,
, or
), the kernel size (i.e.
,
,
, or
), and the padding (i.e. same or causal). In the detector stage (and the penultimate dense layer), the activation functions linear, tanh, and relu are considered. Concerning the last layer, we apply the activation function sigmoid to obtain probability distributions that correspond to different workaround classes. In the pooling stage, we use the pooling function max-pooling. For the penultimate dense layer, we optimise the number of neurons, which varies between
,
, and
. By contrast, we do not vary the number of neurons in the last layer because those neurons represent the workaround classes. For the CNN, we use either the adam or the nadam optimisation algorithm and calculate the categorical cross-entropy loss. As in the case of the AE, we use the default values for other parameters of the optimisation algorithms and set the batch size to
.