
 ?Mathematical formulae have been encoded as MathML and are displayed in this HTML version using MathJax in order to improve their display. Uncheck the box to turn MathJax off. This feature requires Javascript. Click on a formula to zoom.
Abstract
This paper aims to develop a multiple deferred state sampling plan for a time-truncated life test if the lifetime of the item follows exponentiated half logistic distribution. The optimal parameters of the proposed plan, such as the number of successive lots required for making the decision whether to accept or reject the current lot, sample size, the rejection and acceptance numbers are obtained using two points approach. The implementation of the proposed plan is illustrated with examples. Tables are constructed for various combinations of consumer’s and producer’s risks. Comparison is also made with existing sampling plans under exponentiated half logistic distribution.
PUBLIC INTEREST STATEMENT
The exponentiated half logistic distribution (EHLD) is a commonly used distribution in many fields, including quality control and reliability. Due to its flexibility, the EHLD is widely used to various sampling plans. Motivated by this piece of information, for the present article develops a design of multiple deferred state sampling plans for EHLD. The optimal parameters of the sampling plan are obtained using two point approaches. Further, the results are compared with existing sampling plans and showed that the proposed sampling plan is more efficient than the existing sampling plans. The practitioners need to fit the data for the EHLD first and they can apply the proposed sampling plan for the inspection of the product. The proposed plan can be applied in any manufacturing industry for the testing of the product.
1. Introduction
Quality is a vital factor in any manufacturing process, and to conserve the reputation of the product in the market, each producer should produce a product with a superior quality. Using control charts technique the improvement of product quality can be examined, and these charts cane applied if the process is ongoing. The sampling inspection will be useful to check the quality of the product for finished goods. The consumer conducts the sampling inspection, which is based on random samples, to create a belief on a product, as well as the producer also conducts the sample inspection to expose the quality of the product.
The sampling methodology in which an acceptance or non-acceptance decision on the submitted lot is done based on the random samples drawn from the concerned lot is known as acceptance sampling. The acceptance criteria and the sample size are recommended by the acceptance sampling plan for disposing the submitted lot based on the results of sample items. In guaranteeing the quality of the manufactured products acceptance sampling plays a vital role in statistical quality control. When enforcing the acceptance sampling, the decision on the inclination of the lot is immediately made by the inspection of the sample items, so that the cost is reduced and the time will be saved for the inspection. There will be a chance of accepting a bad lot or rejecting a good lot because the decision is made using the results of random samples drawn from the concerned lot. When the bad lot is accepted, the consumer will be affected and when the good lot is accepted, the producer will be affected. Thus, the probability of rejecting a good lot is known as producer’s risk (α) and the probability of accepting a bad lot is known as consumer’s risk (β). The acceptance quality level (AQL) and the limiting quality level (LQL) are appropriate quality levels corresponding to producer’s and consumer’s risks, respectively.
The sampling plans based on time-truncated life tests have been used to study the product reliability. In acceptance sampling, the concept of time-truncated life test is gaining more popularity. Usually, a life test can be used to furnish lifetime assurance and it will be conducted to examine the lifetime of the product under a predetermined time. These sampling plans were proposed by various authors using life tests under various situations with different distributions. Kantam et al. (Citation2001) developed acceptance sampling based on life tests for log-logistic model. Rao et al. (Citation2016) established new acceptance sampling plans based on percentiles for exponentiated Fréchet distribution, Rao et al. (Citation2019) studied new acceptance sampling plans based on percentiles for type-II generalized log logistic distribution. Al-Omari (Citation2018) developed the transmuted generalized inverse Weibull distribution in acceptance sampling plans based on life tests. Yen et al. (Citation2020) established a rectifying acceptance sampling plan based on the process capability index.
Various authors have developed generalization or exponentiation of the base distribution specifically with application of reliability [e.g., see Gupta et al. (Citation1998), Mudholkar and Srivastava (Citation1993), Mudholkar et al. (Citation1995)]. Here, we stick to the terminology of Mudholkar and Srivastava (1993) as the exponentiated half logistic distribution with base distribution consider as half logistic distribution. Cordeiro et al. (Citation2014) have developed an exponentiated half logistic distribution. More recently, Rao and Ramesh (Citation2013, Rao & Ramesh Naidu, Citation2014) studied exponentiated half logistic distribution in the area of reliability and quality control for the product lifetime percentiles.
If is a positive real number, the cumulative distribution function (cdf) of exponentiated half logistic distribution is given by
and the probability density function (pdf) of exponentiated half logistic distribution with and
is given by
Where, σ is the scale parameter and is shape parameter.
The 100q-th percentile of EHLD is given by:
Therefore, the quantile specified in EquationEquation (3)
(3)
(3) for the standard values of
, the function of scale parameter
that is
, where
Therefore, the median of EHLD becomes
Let p is the probability of getting a failure within the life test schedule , If the product lifetime follows an EHLD, then p = F(
). Usually, it would be appropriate to define the experiment termination time
as
for a constant
and the targeted 100q-th lifetime percentile,
. Suppose
is the true 100q-th lifetime percentile. Then, p can be rewritten as:
It is important to note that the median percentile depends on both the shape and scale parameter but the failure probability p is independent of scale parameter.
2. MDS sampling plan based on EHLD
The multiple deferred (dependent) state (MDS) sampling plan is known as an attribute inspection procedure where the decision is made for each lot based on one of the three conditions: (1) accept the lot; (2) reject the lot; or (3) conditionally accept or reject the lot based on the disposition of future-related lots. Wortham and Baker (Citation1976) introduced the MDS sampling concept. Since the decision is made using the results of the samples drawn from both the current and successive lots regarding the disposition of the current lot under the MDS plan and it is possible to reduce the sample size under this plan. Also, this plan is appropriate when the production is continuous and the lots are submitted serially for inspection in the order of production. Many authors have established MDS plans in different situations. For example, The MDS sampling plan using Bayesian methodology was studied by Balamurali et al. (Citation2016). The selection of MDS sampling plans for given AQL and LQL was proposed by Govindaraju and Subramani (Citation1993). For more details on MDS sampling plans, one may refer to Soundararajan and Vijayaraghavan (Citation1990), Subramani and Haridoss (Citation2012), and Aslam et al. (Citation2014). The MDS sampling plan based on measurement data was derived by Balamurali and Jun (Citation2007). Recently, the concept of MDS sampling has been used in control chart design. For example, Aslam et al. (Citation2015) proposed an attribute control chart for monitoring the manufacturing process based on an MDS sampling approach. Khan et al. (Citation2019) studied multiple dependent state repetitive sampling plans with or without auxiliary variable and Balamurali and Aslam (Citation2019) developed determination of multiple dependent state repetitive group sampling plan based on the process capability index.
In this paper, when the lifetime of an item follows an EHLD we suggest an MDS sampling plan to assure the median life of the product based on a time-truncated life test. The conversation of EHLD will be given and the functioning process of MDS sampling plan under EHLD is also given. Some important facts of the MDS sampling plan under EHLD are provided in terms tables for analysis purpose. The performance of both existing sampling plans and the proposed sampling plan is given for comparison purpose.
Here, the functional procedure and designing methodology of MDS sampling plan under EHLD is given.
2.1. Operating procedure
Step-1. Draw a random sample of n items from the current lot. Then put them on life test for specified time.
Step-2. Observe the number of items that failed before the test time and it will be denoted by d.
Step-3. If , accept the lot otherwise reject the lot then the test will be terminated. If
, accept the current lot provided that in m successive lots (preceding m lots in case of MDS sampling plan), the number of failures must be less than or equal to
before the test time
.
The proposed MDS sampling plan is totally characterized by four parameters, namely, and m where n is the sample size,
is the maximum number of allowable items that failed for unconditional acceptance
,
is the maximum number of additional items that failed for conditional acceptance
, and m is the number of successive lots (previous) needed to make decision. The attributes MDS sampling plan converges to
and/or
(say) and it is a general case of single sampling plan. The OC function can disclose the performance of a sampling plan. The OC function of the MDS sampling plan under EHLD for the time-truncated life test is defined using binomial probability law as given below:
The probability of lot acceptance at failure probability p under binomial probability distribution can be attained using EquationEquation (7)(7)
(7) .
2.2. Designing methodology
Usually, the available sampling plans have been designed to minimize the average sample number (ASN). Generally, the major objective of any sampling plan is to minimize the ASN because the analogous inspection time and inspection cost will be reduced. Similarly, we proposed the MDS sampling plan to minimize the ASN for EHLD under-truncated life tests. We use optimization technique to obtain optimal parameters and to minimize the ASN of the proposed MDS sampling plan as given below:
Minimize
Subject to
Where, and
are the quality levels corresponding to producer’s and consumer’s risks, respectively. These probabilities can be obtained using the following equations:
and
We expressed the quality level as the percentile ratio of the median lifetime to the specified median lifetime. The percentile ratio
is considered to be 1 for consumer’s risk and 0.25, 0.10, 0.05, and 0.01 for the producer’s risk. The optimal parameters of the proposed MDS sampling plan for EHLD with known shape parameter
under truncated life tests are given in Tables by assuming that the consumer’s risk
, producer’s risk
and at 50th percentile. Also the optimal parameters of the proposed MDS sampling plan for EHLD with estimated shape parameter
for the real-time data are given in . The termination ratio is considered as
,
, and
. From , 3, and 4, we can observe that when the termination ratio increases for specific values of
,
, and
the required sample size
decreases. From , we can observe that when the termination ratio increases for specific values of
,
, and
the required sample size
decreases, but at particular value of
when the termination ratio increases the required sample size
also increases.
Table 1. Optimal parameters of the proposed MDS plan for EHLD with = 2
Table 2. Optimal parameters of the proposed MDS plan for EHLD with = 2.5
Table 3. Optimal parameters of the proposed MDS plan for EHLD with = 3
Table 4. Optimal parameters of the proposed MDS plan for EHLD with = 1.728
To illustrate the tables, the optimal parameters are selected from are n = 32, =2,
=4, and m = 1 with shape parameter value of
=2,
=0.05,
=0.10,
=2 and a = 1.0. The multiple deferred state sampling plans is established as follows: A sample of 32 observations will be selected at random for the submitted lot and put them on life test for 1000 hours. If the number of failed units before 1000 hours is less than or equal to 2 then the lot will be accepted and the lot will be rejected if the number of failed units is greater than 4. There will be disposition of the present lot is deferred until the next successive lot will be tested in case of the number of failed units are in between 2 and 4.
3. Application of the proposed MDS sampling plan in industry
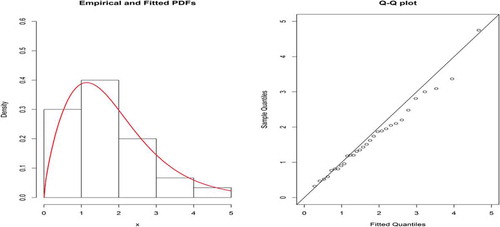
Here, we describe the implementation of the proposed MDS sampling plan where the lifetime of the product follows EHLD with the shape parameter is unknown . If the shape parameter is unknown then we can estimate it using the past lifetime data. For example, we consider a real data set reported by Cordeiro et al. (Citation2017) to estimate the unknown shape parameter. The data consists of 30 observations of March precipitation (in inches) in Minneapolis/St Paul. The observations are: 0.77, 1.74, 0.81, 1.20, 1.95, 1.20, 0.47, 1.43, 3.37, 2.20, 3.00, 3.09, 1.51, 2.10, 0.52, 1.62, 1.31, 0.32, 0.59, 0.81, 2.81, 1.87, 1.18, 1.35, 4.75, 2.48, 0.96, 1.89, 0.90 and 2.05.
The data set was used to demonstrate the goodness of fit for the given model and by plotting it shows that the exponentiated half logistic distribution is a best fit from the below graph and goodness of fit is underlined with Q-Q plot presented in ) and also the multiple deferred state sampling plans for EHLD has not yet implemented. The MLE of the parameter of EHLD for March precipitation (in inches) in Minneapolis/St Paul are =0.7280 and from the Kolmogorov–Smirnov test, we found that the maximum distance between the data and the fitted of the EHLD is 0.1192 with p-value is 0.7874.
Suppose that the researcher would like to use the proposed multiple deferred state sampling plan to implement the median life percentile of the product where the product lifetime follows an exponentiated half logistic distribution with the shape parameter =1.728. The producer suggests that given median life of his product is 800 hours but the researcher want to run the test for 600 hours. The consumer’s risk is 0.10 if the actual median life is 800 hours and the producer’s risk is 0.05 if the actual median life is 1,600 hours. With these constraints the optimal parameters are selected from as n = 12,
,
, and m = 1 with values of
,
,
,
,
at a = 1.0. The multiple deferred state sampling plans is established as follows.
Figure 1. Histogram superimposed empirical density plots and Q-Q Plot of the fitted EHLD for precipitation (in inches) in Minneapolis/St Paul data
A sample of 30 observations will be selected at random for the submitted lot and put them on life test for 600 hours. If the number of failed units before 600 hours is less than or equal to 3 then the lot will be accepted and the lot will be rejected if the number of failed units is greater than 5. There will be disposition of the present lot is deferred until the next successive lot will be tested in case of the number of failed units are in between 3 and 5.
4. Comparative study
Here, we compare the effectiveness of the proposed MDS sampling plan with existing sampling plans such as single sampling plan (SSP), group acceptance sampling plan based on resubmitted lots (RSP), etc. The ASN values of the respective sampling plans have been given in . shows that the ASN of the proposed MDS sampling plan is smaller than that of the existing sampling plans such as SSP, RSP for different combinations of ,
,
at a = 1.0. For example, the ASN of the proposed MDS sampling plan for
,
,
at a = 1.0 is 12 whereas the ASN of the SSP, RSP for
,
,
at a = 1.0 are 19 and 135, respectively. Therefore, we conclude that the proposed MDS sampling plan will be economical than the sampling plans SSP and RSP.
Table 5. ASN of the proposed MDS sampling plan, SSP, RSP for EHLD at a = 1.0
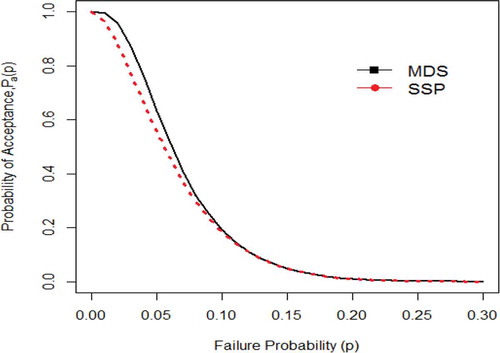
The shows the OC curve of the proposed MDS sampling plan along with SSP under exponentiated half logistic distribution with known shape parameter. In the MDS sampling plan parameters are considered as ,
,
, and
and also for the SSP the parameters are
and
. The two plans MDS and SSP are selected under the time-truncated life test with the same sample size. From , we can observe that the probability of acceptance of the lot is more at lower failure probability under the MDS sampling plan than that of SSP and also when the failure probability increases the OC curve of the MDS sampling plan move toward the OC curve of the SSP. The probability of acceptance of the lot for the two plans MDS and SSP will be almost same at higher failure probability. So, we conclude that at higher quality level the MDS sampling plan gives protection to the producer as compared to SSP.
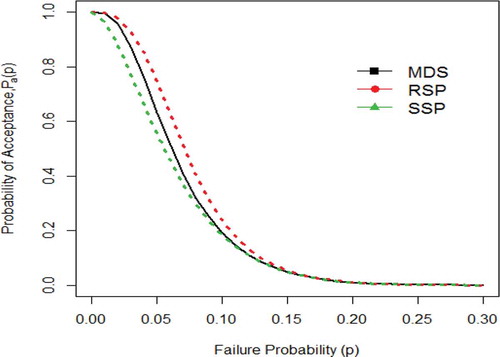
Similarly, shows the OC curve of the proposed MDS sampling plan along with SSP and RSP (Resubmitted sampling plan) under exponentiated half logistic distribution with known shape parameter. The MDS sampling plan parameters are considered as ,
,
, and
and also for the SSP the parameters are
and
and for the RSP are
,
,
.
Figure 2. OC curves for comparison between MDS and SSP
The OC curves have constructed for the same sample size and acceptance number at . More specifically, we can observe from that the MDS sampling plan more appropriate than the SSP and RSP and also it protects the producer at higher quality level and also safeguard to the consumer at lower quality level.
Figure 3. OC curves for comparison between MDS, RSP and SSP
5. Conclusions
In this article, a multiple deferred state sampling plan under the assumption that the lifetime of the product follows an exponentiated half logistic distribution for truncated lifetime tests is developed. The optimal parameters of the proposed sampling plan are obtained using two points approach. A comparative study of the proposed MDS sampling plan have been performed using OC curves along with single sampling plan and group acceptance sampling plan based on resubmitted lots. The proposed MDS plan parameters are obtained by satisfying the respective consumer’s and producer’s risks simultaneously. We conclude that the proposed MDS sampling plan is more effective than the existing sampling plans like SSP, RSP, etc.in order to secure the consumer and prouder with less inspection. The limitation of this study is lifetime percentile quality characteristics should follow exponentiated half logistic distribution.
Declaration of competing interest
The authors declare that they have no known competing financial interests or personal relationships that could have appeared to influence the work reported in this paper.
Acknowledgements
The authors sincerely thank to the anonymous reviewers and editor for their valuable suggestions and remarkable comments to improve the content of this manuscript.
Additional information
Funding
Notes on contributors

Gadde Srinivasa Rao
Gadde Srinivasa Rao is presently working as Professor, Dept. of Mathematics and Statistics, University of Dodoma, Tanzania. He boasts more than 125 publications in different peer-reviewed and reputed journals. He is the reviewer for various reputed international journals. His research interests include statistical inference, statistical process control, applied Statistics, acceptance sampling plans and reliability estimation.
Kanaparthi Rosaiah has completed PhD in Statistics in 1990 from Acharya Nagarjuan University (A.N.U.), Guntur, India. He joined as lecturer in the Dept. of Statistics, A.N.U in 1985 and promoted as Professor in 2002. He has published 74 research articles in peer reviewed journals.
Ramesh Naidu Chukka is a Lecturer in Statistics in the department of Statistics, Dilla University, Ethiopia. He received his MSc in Statistics in the year 2003, and pursuing PhD in Statistics at Acharya Nagarjuna University. His research interests include in life testing and reliability estimation in statistical quality control.
References
- Al-Omari, A. I. (2018). The transmuted generalized inverse Weibull distribution in acceptance sampling plans based on life tests. Transactions of the Institute of Measurement and Control, 40(16), 4432–14. https://doi.org/10.1177/0142331217749695
- Aslam, M., Nazir, A., & Jun, C. H. (2015). A new attribute control chart using multiple dependent state sampling. Transactions of the Institute of Measurement and Control, 37(4), 569–576. https://doi.org/10.1177/0142331214549094
- Aslam, M., Yen, C. H., Chang, C. H., & Jun, C. H. (2014). Multiple dependent state variable sampling plans with process loss consideration. The International Journal of Advanced Manufacturing Technology, 71(5–8), 1337–1343. https://doi.org/10.1007/s00170-013-5574-9
- Balamurali, S., & Aslam, M. (2019). Determination of multiple dependent state repetitive group sampling plan based on the process capability index. Sequential Analysis, 38(3), 385–399. https://doi.org/10.1080/07474946.2019.1648930
- Balamurali, S., Jeyadurga, P., & Usha, M. (2016). Designing of bayesian multiple deferred state sampling plan based on gamma–poisson distribution. American Journal of Mathematical and Management Sciences, 37(1), 77–90. https://doi.org/10.1080/01966324.2015.1086708
- Balamurali, S., & Jun, C. H. (2007). Multiple dependent state sampling plans for lot acceptance based on measurement data. European Journal of Operations Research, 180(3), 1221–1230. https://doi.org/10.1016/j.ejor.2006.05.025
- Cordeiro, G., Alizadeh, M., & Ortega, E. (2014). The exponentiated half logistic family of distributions: Properties and applications. Journal of Probability and Statistics, 2014, 1–21. https://doi.org/10.1155/2014/864396
- Cordeiro, T. A., de Andrade, N., Marcelo, B., & da Silva, F. S. G. (2017). The exponentiated generalized standardized half-logistic distribution. International Journal of Statistics and Probability, 6(3), 24–42. https://doi.org/10.5539/ijsp.v6n3p24
- Govindaraju, K., & Subramani, K. (1993). Selection of multiple deferred (dependent) state sampling plans for given acceptable quality level and limiting quality level. Journal of Applied Statistics, 20(3), 423–428. https://doi.org/10.1080/02664769300000041
- Gupta, R., C., Gupta, P., L., and Gupta, R., D. (1998). Modeling failure time data by Lehman alternatives, Communications in Statistics – Theory and Methods, 27(4), 887–904.
- Kantam, R., Rosaiah, K., & Rao, G. (2001). Acceptance sampling based on life tests: Log-logistic model. Journal of Applied Statistics, 28(1), 121–128. https://doi.org/10.1080/02664760120011644
- Khan, N., Aslam, M., Ahmad, L., & Jun, C. H. (2019). Multiple dependent state repetitive sampling plans with or without auxiliary variable. Communications in Statistics -simulation and Computation, 48(4), 1055–1069. https://doi.org/10.1080/03610918.2017.1406506
- Mudholkar, G., S., and Srivastava, D., K. (1993). Exponentiated Weibull family for analyzing bathtub failure data, IEEE Transactions on Reliability, 42, 299–302
- Mudholkar, G., S., Srivastava, D., K., and Freimer, M. (1995). The exponentiated Weibull family: A reanalysis of the bus-motor failure data, Technometrics, 37, 436–445.
- Rao, G., & Ramesh Naidu, C. (2014). Acceptance sampling plans for percentiles based on the Exponentiated half logistic distribution. Applications and Applied Mathematics, 9(1), 39–53.
- Rao, G., Rosaiah, K., & Prasad, S. (2019). New acceptance sampling plans based on percentiles for type-II generalized log logistic distribution. American Journal of Applied Mathematics and Statistics, 7(4), 131–137. https://doi.org/10.12691/ajams-7-4-2
- Rao, G., Rosaiah, K., Sridhar Babu, M., & Sivakumar, D. C. U. (2016). New acceptance sampling plans based on percentiles for exponentiated fréchet distribution. Stochastics and Quality Control, 31(1), 37–44. https://doi.org/10.1515/eqc-2015-0011
- Rao, G. S., and Ramesh Naidu, C. (2013). Estimation of reliability in multicomponent stress–strength based on exponentiated half logistic distribution, Journal of Statistics: Advances in Theory & Applications, 9, 19–35.
- Soundararajan, V., & Vijayaraghavan, R. (1990). Construction and selection of multiple deferred (dependent) state sampling plan. Journal of Applied Statistics, 17(3), 397–409. https://doi.org/10.1080/02664769000000012
- Subramani, K., & Haridoss, V. (2012). Development of multiple deferred state sampling plan based on minimum risks using the weighted Poisson distribution for given acceptable quality level and limiting quality level. International Journal of Quality Engineering and Technology, 3(2), 168–180. https://doi.org/10.1504/IJQET.2012.049699
- Wortham, W. A., & Baker, R. C. (1976). Multiple deferred state sampling inspection. International Journal of Production Research, 14(6), 719–731. https://doi.org/10.1080/00207547608956391
- Yen, C. H., Lee, -C.-C., Lo, K.-H., Shiue, Y.-R., & Li, S.-H. (2020). A rectifying acceptance sampling plan based on the process capability index. Mathematics, 8(1), 141. https://doi.org/10.3390/math8010141