
 ?Mathematical formulae have been encoded as MathML and are displayed in this HTML version using MathJax in order to improve their display. Uncheck the box to turn MathJax off. This feature requires Javascript. Click on a formula to zoom.
Abstract
The doping process of TiO2 using a combination method, sol-gel and hydrothermal, has been conducted. The presence of anatase and rutile phase of TiO2 and doped TiO2 has been confirmed using UV-DRS, XRD, Raman spectroscopy, and EPR. The Nitrogen-doped TiO2 (N-TiO2) showed the highest photoactivity in the powder form than the as-prepared TiO2 (rutile), anatase and Vanadium-doped TiO2 (V-TiO2). The influence of pH during the preparation of N-TiO2 showed that pH gives a big effect to the morphology and photoactivity of the photocatalyst. The N-TiO2 at pH 2 showed higher photoactivity than N-TiO2 at pH 4 and it also showed a fine morphology. The N-TiO2 also showed the highest photoactivity when it was immobilized in the DPNR matrix. After being immobilized, the photoactivity of the as-prepared photocatalyst was decreased to be 0–30%.
1. Introduction
Titanium oxide (TiO2) is categorized as semiconductor material that has been widely investigated especially its photoactivity during the degradation of organic compound. In addition, titanium oxide has been applied as membrane for water purification process because of its antibacterial activity (Leong, Monash, Ibrahim, & Pichiah, Citation2014; Sousa et al., Citation2013; Velmurugan, Krishnakumar, Subash, & Swaminathan, Citation2013). In several advanced investigations, TiO2 has been studied for its properties as a gas sensor (Gao et al., Citation2018) and solar photovoltaic (Hou et al., Citation2011) conversion based on its promising application results. Titanium oxide as photocatalyst material has some advantageous properties such as low cost, non-toxicity, high photo-stability and activity under UV light (Guarino, Costa, & Porro, Citation2008; Wang et al., Citation2016).
Unfortunately, TiO2 also has some disadvantages such as low surface area, high recombination, and large band gap, that make it photoactive only in the UV region (Mathews, Cortes Jacome, Angeles-Chavez, & Toledo Antonio, Citation2015). In order to overcome those limitations, a number of adjustments have been made, such as surface modification, sensitization with plasmonic metal and doping with anion or cation (Ramchiary & Samdarshi, Citation2015; Serpone, Citation2006; Stathatos, Lianos, Falaras, & Siokou, Citation2000; Sudeep, Takechi, & Kamat, Citation2007). These adjustments were conducted to achieve the new material based on TiO2 that can be used across a broad spectrum, i.e. visible light and reduction of the band gap value (Ramchiary & Samdarshi, Citation2015). Such treatment was performed based on the following background: the composition of the exposed sunlight on the earth’s surface only consists of 4% of UV light, 42% of visible light and 54% dominated with infrared. From the data, many studies have been conducted to enhance the properties of the photocatalytic material TiO2; naturally, TiO2 cannot be applied in solar or room light (Ohno, Mitsui, & Matsumura, Citation2003; Seery, George, Floris, & Pillai, Citation2007). Numerous studies have been conducted to develop the material based on TiO2 that can harvest visible light (Choi, Umebayashi, & Yoshikawa, Citation2004; Di Valentin, Pacchioni, & Selloni, Citation2004; Nagalakshmi & Radhika, Citation2017; Nigussie et al., Citation2018; Ohno et al., Citation2003). These materials were prepared by doping one or several atoms of metals and non-metals into the lattice of TiO2, i.e. vanadium, boron, sulphur, and nitrogen (Batzill, Morales, & Diebold, Citation2006; Bettinelli et al., Citation2007; Kokorin et al., Citation2016; Tian, Ma, Li, & Li, Citation2009; Went, Leu, & Bell, Citation1992; Yang & Zhou, Citation2007).
In the current research, the doping was processed with the presence of metal and non-metal substances, i.e. vanadium and nitrogen. These two elements were chosen due to the similarity of their atomic radius to the Ti and O atom radius. Further, the doping process of nitrogen into the lattice of TiO2 using various precursors has been performed by many researchers for different applications (Di Valentin et al., Citation2004; Jagadale et al., Citation2008; Razali & Othman, Citation2017). The doping process of nitrogen gives a positive improvement in the photoactivity of TiO2, i.e. the photocatalysis TiO2 can be applied under UV and visible light; it is an impact of the overlapping of the p and 2p orbital of nitrogen and oxygen, and this process resulted in a reduction of band gap of the modified TiO2 (Batzill et al., Citation2006; Nakamura, Tanaka, & Nakato, Citation2004; Wang et al., Citation2009). The other study reported, photocatalyst material with high activity in a visible light region, has been reported based on the doping process of vanadium into the TiO2 and the impact of that process is improvement of photocatalytic ability under the visible range (Bettinelli et al., Citation2007; Kokorin et al., Citation2016; Martin, Morrison, & Hoffmann, Citation1994; Went et al., Citation1992).
To the best of our knowledge, few reports are published on the preparation of N- and V-doped TiO2 using a hydrothermal method assisted with the sol-gel method. This method has many advantages, such as 1) various forms of TiO2 that are different in mixture phase composition, crystalline structure and morphology could be obtained by changing the condition during a hydrothermal process that includes temperature, time, concentration and additive; 2) a low energy consumption and eco-friendly process. In the present study, the aim of this research was1) to characterize the as-prepared photocatalyst TiO2 and doped TiO2 that were prepared using a combination of hydrothermal and sol-gel methods in the dyes degradation; 3) to evaluate its photocatalytic properties in powder form and immobilized form; and 4) to determine the influence of pH during the synthesis using the most active photocatalyst. The as-prepared photocatalysts were characterized using several instruments such as XRD, UV-Vis reflectance, Raman spectroscopy, and SEM. The effect of metal and non-metal doping on the photocatalytic decomposition rate of cationic and anionic azo dye, such as direct blue 71 (DB 71), methylene blue (MB), and reactive black 5 (RB5) solutions is discussed.
2. Materials and methods
2.1. Materials
Titanium isopropoxide (TTIP, 97%) and TiO2 (anatase) were obtained from Sigma-Aldrich. Urea and ammonium metavanadate were purchased from Merck. Absolute ethanol was purchased from Guangdong Guanghua Sci-Tech Co. Ltd. Dyes in this research were obtained from Sigma-Aldrich. All chemicals were used without further purification.
2.2. Preparation of TiO2 and doped TiO2
TTIP, (NH2)2CO and NH4VO3, were used as starting materials for N and V-doped TiO2. In a typical synthesis, 5 wt.% solution of N and V precursor was added dropwise into a mixture of absolute ethanol (1.5 mol) and TTIP (0.1 mol). The pH was adjusted to 2 and 4 by the addition of HNO3 0.25 M. During this process, the sol-gel phase was obtained. After 24 h, the mixture was poured into a Teflon-lined stainless autoclave with 100 ml capacity. The autoclave was then sealed and heated up to 180 °C, and kept for 24 h, then cooled to room temperature naturally. Finally, the product was separated by centrifugation, and washed with distilled water and ethanol several times, then dried at 60 °C. The obtained powder was calcined at 550 °C for six hours. The pure TiO2 samples were also prepared by repeating the above procedure without adding N and V precursor.
2.3. Characterization
The crystallography of the as-prepared TiO2 and doped TiO2 was determined using an X-ray diffractometer (Bruker D8 Advance X-ray diffractometer). The morphology and nanosize of the as-prepared TiO2 and doped TiO2 were analysed using Scanning Electron Microscopy (Hitachi TM4000). The molecular vibration and phase of the as-prepared TiO2 and doped TiO2 was analysed using Raman Spectroscopy (AvaRaman-785 TEC). The optical data of the as-prepared TiO2 and doped TiO2 was measured using UV-Vis Diffuse Reflectances Spectrophotometry (Shimadzu UV-2600 Series). The magnetic properties of the as-prepared photocatalyst were determined using Electron Paramagnetic Resonance Spectroscopy (EMX micro Bruker Series).
2.4. Photoactivity measurements
The performance of TiO2 and doped TiO2 for dyes degradation was investigated using a 350 mL cylindrical glass reactor with a cooling jacket to control the reaction temperature. An amount of as-prepared photocatalyst, 40 mg/L, was suspended in 10 ppm of dyes solution (Aldrich, 50% dye content) as the organic pollutant model. For the first 30 min, the suspended system was stirred without the presence of near-UV and visible light source to obtain the equilibrium of desorption-adsorption (Choi et al., Citation2004; Kokorin et al., Citation2016) The suspended system was then irradiated with a 125 W high-pressure Hg lamp (Osram) equipped with a cylindrical pyrex tub to ensure that the reaction was only irradiating by near-UV and visible light source (Razali & Othman, Citation2017). All the system was surrounded by a circulating water jacket to cool and stabilise the temperatures of the lamp and dye solution. To measure the photoactivity of the as-prepared TiO2 and doped TiO2, 10 ml aliquots was taken every fiveminutes. The obtained aliquots were centrifuged to separate the as-prepared TiO2 and doped TiO2 with the solution. The discoloration performance was determined at the maximum wavelength of DB71, MB and RB5 by UV-Vis spectrophotometer(Hitachi UH5300). In order to study the effect of light irradiation oni dyes degradation, the photolysis experiment was conducted by irradiation of the dyes without the addition of as-prepared TiO2 and doped TiO2.
3. Result and discussion
3.1. XRD analysis
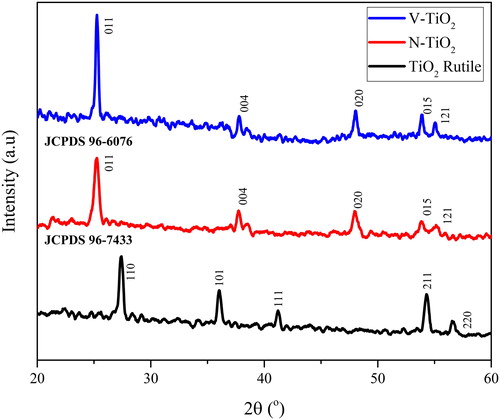
The XRD patterns of the as-prepared TiO2 (rutile) and doped TiO2 are shown in , that reveals the presence of rutile phase on the as-prepared TiO2 spectrum and anatase phase on the TiO2 doped with nitrogen and vanadium. The change of crystalline phase from rutile to anatase of undoped to doped-TiO2 is caused by the introduction of N and V into the lattice of TiO2, but the mechanism and the clear explanation of this transformation has not been found yet (Batzill et al., Citation2006; Bettinelli et al., Citation2007; Breeson, Sankar, Goh, & Palgrave, Citation2016; Went et al., Citation1992). The corresponding peaks of rutile phase were shown at 27.44 (110), 36.06 (101), 39.11 (200), 41.2 (111), 44.05 (120), 54.34 (211), 56.65 (220), 62.77 (002), and 64.28 (130) degrees (JCPDS 96-7433). As observed at the XRD data of the doped TiO2, the main peak of rutile at 27.44° disappeared, whereas the main peak of anatase appeared at 25.27°. The corresponding peaks of anatase phase for those doped TiO2 were shown at 25.27, 37.91, 48.05, 54.04, 55.10, 62.14, 62.75, 68.66, 70.38, and 75.06 degrees corresponding to (011), (004), (020), (015), (121), (123), (024), (116), (220) and (125) planes, respectively (JCPDS 96-6076). The crystallite size of TiO2, N-TiO2 and V-TiO2 that calculated from the Scherrer formula along (101) and (110) plane for anatase and rutile phase were found to be 5.03, 2.02 and 1.52 nm, respectively. The crystallite size of TiO2 doped with nitrogen and vanadium is less than the undoped TiO2, this impact is also discussed in several studies (Cong, Zhang, Chen, & Anpo, Citation2007; Martin et al., Citation1994; Yang & Zhou, Citation2007). The d spacing value of the as-prepared photocatalyst is 3.25, 3.52 and 3.52 Å for TiO2 (rutile), N-TiO2 (anatase) and V-TiO2 (anatase), respectively. In addition, the introduction of N and V into the lattice of TiO2 has effect to the unit cell dimension, as the impact of the d spacing value for the doped TiO2 is increased.
Figure 1. XRD spectra of as-prepared TiO2 and doped TiO2.
3.2. SEM images
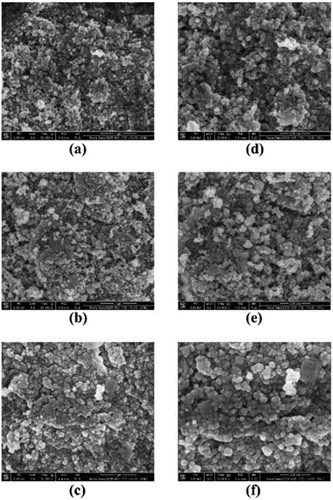
shows the SEM images of the as-prepared TiO2 and doped TiO2. The scanning electron microscope images show that the as-prepared TiO2 and doped TiO2 have irregular nanostructure. Those results indicate that the morphology structure of TiO2 cannot be changed by the addition of (NH2)2CO and NH4VO3, the precursor material for the doping process. Based on SEM images, the particle size of the as-prepared TiO2 and doped TiO2 is 6.24–49.89 and 6.00–48.59 nm, respectively. Also, the obtained nanoparticle has an agglomerated structure; the agglomeration of the doped TiO2 is less than 160 nm while the undoped TiO2 has agglomerates over 500 nm. The particle size has a significance effect to the photoactivity of photocatalyst material and the smaller particle size will have a higher surface area that will provide more photocatalytic sites.
Figure 2. SEM images of the as-prepared TiO2 (a, d), N-TiO2 (b, e) and V-TiO2 (c, f) with ×30,000 and ×50,000 magnification.
3.3. UV-Vis diffuse reflectance spectrometric analysis
The UV-Vis DRS of the anatase, the as-prepared TiO2 (rutile), N-TiO2 and V-TiO2 are shown in . The DRS image show the absorption onset of band gap for anatase, N-TiO2, the as-prepared TiO2 (rutile), and V-TiO2 at 375, 385, 410 and 434 nm. Those absorption onsets are corresponding to the energy band gaps of 3.31, 3.24, 2.99 and 1.95 eV, respectively. After the doping process using nitrogen and vanadium, the optical absorption of the N and V – TiO2 shifts to the wavelengths from 400 to 700 nm. The doping process using nitrogen and vanadium has a big contribution to the reduction of the TiO2 band gap value (Di Valentin et al., Citation2004; Jagadale et al., Citation2008; Kokorin et al., Citation2016; Martin et al., Citation1994; Razali & Othman, Citation2017; Sathish, Viswanathan, Viswanath, & Gopinath, Citation2005; Xing, Zhang, & Chen, Citation2009; Yang & Zhou, Citation2007).
Figure 3. UV-Vis diffuse reflectance spectra of the as-prepared catalyst (a) and band gap energy of the as-prepared TiO2 and doped TiO2 (b).
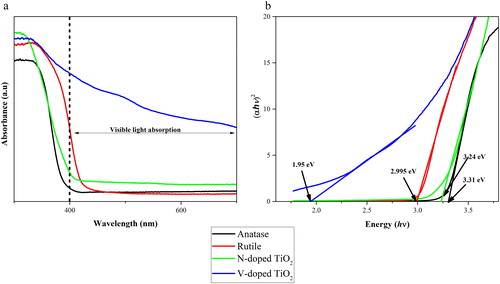
The decrease in the band gap value by the effect of the doping process has been reported in previous works by several authors. For the vanadium doping, the decrease of band gap is caused by the overlapping of 3d and 2p orbital of vanadium and oxygen; those overlapping initiated the formation of intermediate bands (Liu et al., Citation2009; Mathews et al., Citation2015). In addition, for the nitrogen doping, the decrease is explained as the overlapping of the p and 2p orbital of nitrogen and oxygen (Batzill et al., Citation2006; Nakamura et al., Citation2004; Wang et al., Citation2009).
3.4. Raman analysis
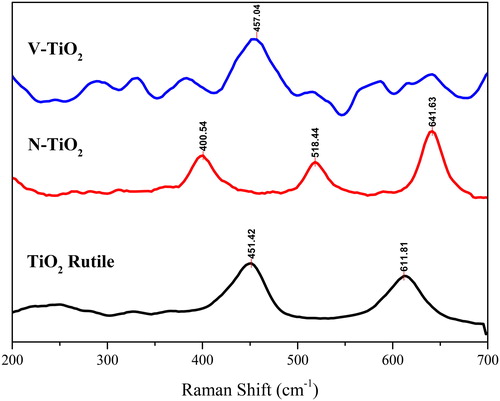
The crystalline structure of the as-prepared TiO2 and doped TiO2 that has been analysed by XRD pattern showed as rutile and anatase phase. Those results are corroborated by Raman spectroscopy (); using this technique, the presence of the different phase of TiO2 can be determined. Based on references, the anatase phase has four Raman signals, such as 399 (B1g), 513 (A1g), 519 (B1g) and 639 cm−1 (Eg). On the other hand, the rutile phase shows two Raman signals at 447 (Eg) and 612 (A1g) (Ohsaka, Izumi, & Fujiki, Citation1978). The Raman spectra of the as-prepared TiO2 in the range 200–700 cm−1 shows the Raman signal of rutile phase at 451 (Eg) and 611 (A1g). Then the N and V-doped TiO2 samples show the Raman signal of anatase phase at 400 (B1g), 518 (B1g) and 641 (Eg) cm−1. However, in the V-TiO2 sample, there were some additional signals around 200–300 and 400–500 cm−1 that indicated the presence of V5+ in the form of NH4VO3. Additionally, those Raman signals indicated the presence of V-O-V of the polymeric linkages in bending and symmetric stretching (Deo, Hardcastle, Richards, Hirt, & Wachs, Citation1990; Went et al., Citation1992).
Figure 4. Raman spectra of the as-prepared TiO2 and doped TiO2.
3.5. Electron paramagnetic resonance (EPR) analysis
The electron paramagnetic resonance (EPR) spectra of the as-prepared TiO2, N-TiO2 and V-TiO2 are shown in . The EPR spectra of the as-prepared TiO2 that has a rutile phase, showed some response of paramagnetic signal, although normally for the anatase and rutile phase they do not show any signal because Ti4+ species is not an active paramagnetic. From some references, Ti3+ is reported as one of the EPR active species that can be obtained from TiO2. The presence of Ti3+ can be found around 3.5 kG that is assigned to the defect of oxygen vacancy. In the EPR spectra of N-TiO2, at 3.5 kG also can be found a broad signal that refers to the presence of Ti3+ (Dogan, Chao, Peng, & Greenbaum, Citation2014). However, in the EPR spectra of N-TiO2 the signals at 0.8 and 1.2 kG have disappeared; this happened because those signals are fingerprints for the rutile phase. Meanwhile, for the N-TiO2, it has an anatase phase. The phase structure of these samples is suitable with XRD and Raman spectra.
Figure 5. EPR spectra of the as-prepared TiO2 and doped TiO2.
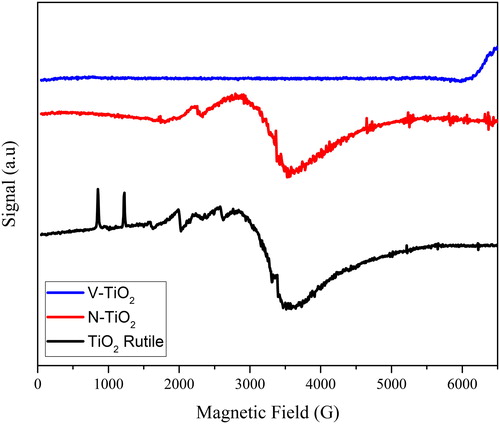
Compared to undoped, the as-prepared TiO2 and N-TiO2 EPR spectra of the V doped sample are significantly different. Even the XRD and Raman spectra indicated the V-TiO2 to have an anatase phase, but the signal that indicated the presence of rutile, anatase and TiO2 (0.8, 1.2, 2.0, 2.6 and 3.5 G) has disappeared. The EPR spectra of V-TiO2 show no signal that indicated there is no EPR active species. This is probably caused by the presence of V5+ on the surface of TiO2 as explained in the SEM analysis. Vanadium ion (V5+) is an EPR inactive species (Dogan et al., Citation2014). The broad signal of Ti3+ also disappeared and that caused by the presence of V5+ on the surface of TiO2.
3.6. Photocatalytic degradation of the dyes using UV-Vis light
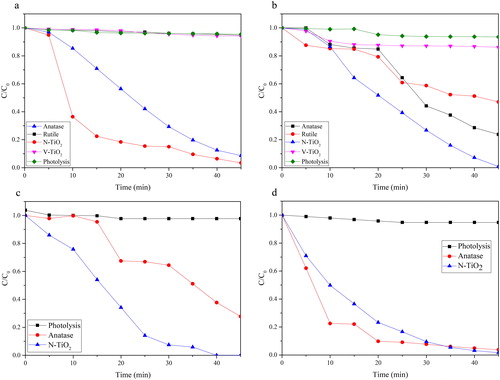
The photoactivity of the as-prepared TiO2, N-TiO2 and V-TiO2 was assessed by photodegradation of four dyes, such as acid yellow (AY), direct blue 71 (DB71), reactive black 05 (RB05), and methylene blue (MB). Photolysis was also performed to evaluate the possibility of the dyes degradation that were caused only by the UV-Vis source light. The photoactivity of the as-prepared photocatalyst was also compared to the photoactivity of TiO2 anatase (Sigma-Aldrich). In , after 45 min of treatment using UV-Vis source light, the impact of photolysis treatment among the dye samples is less than 5%. The photoactivity after correction of photolysis indicates that the photoactivity of N-TiO2 is slightly increased after the doping process with nitrogen and it has the highest photoactivity, which can be the impact of the reduced band gap value. From the XRD data, the crystal structure of N-TiO2 only consists of anatase phase, which has a better photoactivity than rutile. Moreover, N-TiO2 has band gap value at ∼3.24 eV, which is lower than the band gap of TiO2 anatase (∼3.31 eV). The unique result was obtained on the photoactivity of V-TiO2 that was almost similar to rutile. The band gap value of V-TiO2 is ∼1.95 eV and the crystal structures are dominated with anatase phase. This phenomenon is caused by the presence of bulk vanadium (V4+ or V5+) on the surface of TiO2 () (Bettinelli et al., Citation2007). In the , the surface of TiO2 is covered by black spot (vanadium species); the presence of vanadium on the surface of TiO2 can increase the surface area and improve the photoactivity. However, here within the bulk amount of vanadium on the surface of TiO2, the photoactive site of TiO2 is covered by these particles and it reduces the photoactivity of TiO2. The photodegradation of DB71 by anatase, the as-prepared TiO2, N-TiO2 and V-TiO2 are 76.24; 52.95; 99.13 and 13.83%, respectively, while for acid yellow 96.57; 5.30; 91.38 and 5.80% are respectively for anatase, the as-prepared TiO2, N-TiO2 and V-TiO2. In the photodegradation of methylene blue and reactive black 05, the photoactivity of N-TiO2 is 98.34 and 100%, respectively, and the photoactivity of anatase is 96.25 and 72.21%.
Figure 6. Photocatalytic degradation of (a) AY, (b) DB71, (c) RB05 and (d) MB over the as-prepared catalyst under visible light radiation.
There is a correlation between photoactivity and EPR spectra that is the influence of Ti3+ to the photocatalyst activity. The photoactivity of the as-prepared photocatalyst can be arranged as N-TiO2 > TiO2 (rutile) > V-TiO2. From the EPR spectra, the Ti3+ can be found in the N-TiO2 and TiO2 (rutile), but not in V-TiO2. The presence of Ti3+ in the surface of TiO2 based photocatalyst can easily react with oxygen to form some radical species, such as •O2-, HO2• and •OH. The presence of Ti3+ in the photocatalyst material can influence the photocatalyst activity of TiO2 and the doped TiO2. This argument is supported by some previous studies, such as that the high photoactivity of N-TiO2 is the impact of the synergistic effect of Ti3+ and nitrogen (Ramchiary & Samdarshi, Citation2015; Wang et al., Citation2009; Xiong, Li, Yang, & Yu, Citation2012). The proposed mechanism of the formation of Ti3+ and those radical species may follow these equations:
(1)
(1)
(2)
(2)
(3)
(3)
(4)
(4)
(5)
(5)
Based on the proposed mechanism for the formation of radical species, the photocatalyst of N-TiO2 can produce more active species during the process of photoactivity. The production of these radical species can enhance the photoactivity of photocatalyst material.
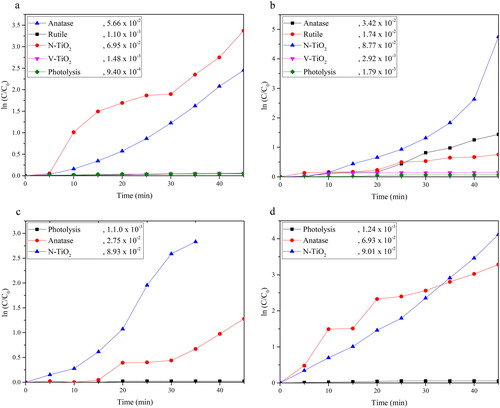
The photocatalytic degradation of AY, DB71, RB05 and MB is shown in . The plot of ln C/C0 vs. time in illustrates that the reaction rate of all the as-prepared photocatalyst follows pseudo-first order kinetics. The N-TiO2 shows the highest photocatalytic degradation which has 6.95 x 10⁻², 8.77 x 10⁻², 8.93 x 10⁻² and 9.03 x 10⁻² of k value for acid yellow, direct blue 71, reactive black 05 and methylene blue, respectively. The improvement of the N-TiO2 photoactivity is attributed to the presence of Ti3+ on the surface of TiO2 and the overlapping of p and 2p orbital of nitrogen and oxygen.
Figure 7. Photocatalytic rate of (a) AY, (b) DB71, (c) RB and (d) MB over the as-prepared catalyst under visible light radiation.
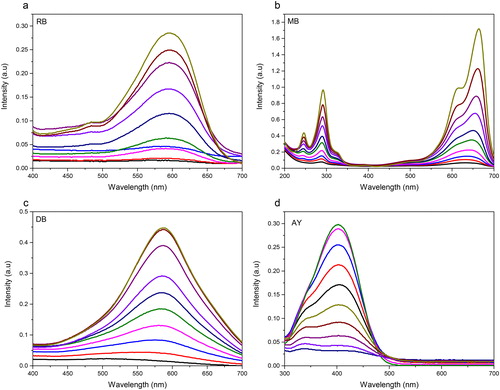
The influence of N-TiO2 photocatalyst on the chemical structure of synthetic dyes AY, DB71, RB05 and MB during the photocatalytic process was investigated by observing the absorption spectral changes of the dyes every five minutes in the range of 400–700 nm wavelength. The photodegradation process of AY, DB71, RB05 and MB is shown in . These processes show blue shift and the maximal peak broadens with the increase of the reaction time. From the absorption spectra pattern shown in , the dyes decomposed quickly and no new absorption bands appeared in both visible and ultraviolet regions, which indicates that no aromatic moieties and other similar intermediates were produced (Gao & Liu, Citation2005).
Figure 8. Wavelength shift of dyes during photocatalytic process.
3.7. Photocatalytic activity of DPNR/TiO2 and doped TiO2 composites
A disadvantage of photocatalyst material in powder form is the difficulty in the recovery process and reuse of the catalyst after treatment. Methods have been developed to overcome this, such as coating the photocatalyst as thin film, combination with polymer based on plastic, and magnetic material. However, all of these processes lack industrial application.. To date, the research on elucidating the most suitable matrix for immobilized photocatalyst that can be applied for industrial purposes is still in a development process.
In the present work, the composite DPNR/TiO2 and DPNR/doped TiO2 were prepared by a blending process between deproteinized natural rubber DPNR (obtained from rubber latex with 30% dry rubber content) and the as-prepared TiO2 (1 wt. %) using an internal mixer (Toyo Seiki, Labo Plastomil 4M150) for 10 min with a rotation speed 50 rpm. The morphology of DPNR composite and its photoactivity on several dyes, such as AY, DB71, RB05 and MB were evaluated.
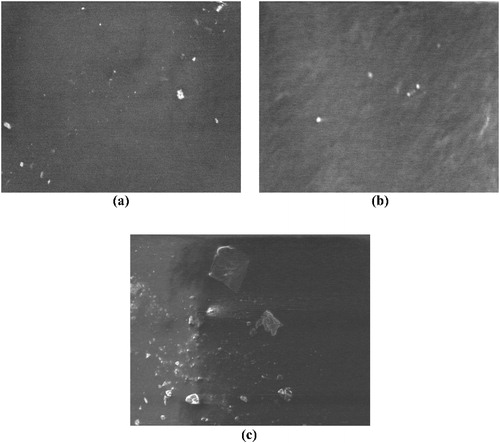
The morphology analysis of DPNR composite is shown in . Only few particles can be observed on the surface of DPNR and no aggregation was observed in any of the SEM microphotographs. Although not an aggregate, the distribution of the as-prepared TiO2 and doped TiO2 are not homogenous. From , it can be observed that the TiO2 and doped TiO2 particle centred at some points. This morphology result can give a negative impact to the photocatalytic degradation.
Figure 9. The microphotograph of surface morphology of (a) DPNR/TiO2, (b) DPNR/N-TiO2 and (c) DPNR/V-TiO2.
Results from the photocatalytic degradation of AY, DB71, RB05 and MB dye solution by the DPNR composite are shown in . The photocatalytic degradation does not involve the adsorption process (data not showed). It implies that the photoactivity during the degradation process of dyes is caused by the as-prepared TiO2 and doped TiO2. The photoactivity of all DPNR composites has a lower value than the photocatalyst in powder form. The lower photoactivity of the composite is caused by the lack of material on the DPNR surface, it can be observed from the SEM images. Most of photocatalyst is well-dispersed in the DPNR matrix.
Figure 10. Photoactivity of DPNR composite.
3.8. pH dependence in the N-TiO2 synthesized
The preparation condition, e.g. pH, is one factor that has a big influence on the properties of photocatalyst material. For example, in the previous study about the preparation of TiO2, the temperature, synthesis method, precursor, and reaction time have an important role in determining the crystal phase. The current work took a study of the influence of pH to the properties of N-TiO2 – as the most active photocatalyst material in this work. The N-TiO2 has been prepared in pH 2 and 4 by a combination method between hydrothermal and sol-gel as explained in the Methods section.
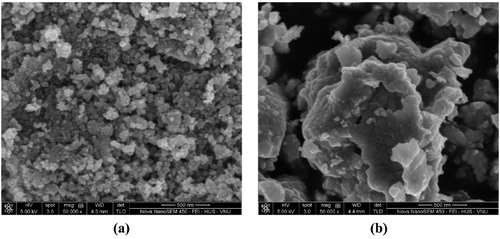
In , the as-prepared N-TiO2 at pH 2 and 4 has a different morphology, especially on the size of the agglomerate. At pH 4, the N-TiO2 cannot be found as single particle, and all of the TiO2 particle is found as agglomerate. The agglomerate size of N-TiO2 prepared in pH 2 is less than 160 nm, but at pH 4 it is up to 1-micron size. The different result on the morphology may has an influence on the photoactivity.
Figure 11. The microphotograph of surface morphology of N-TiO2 prepared at (a) pH 2 and (b) pH 4 with magnification ×50,000.
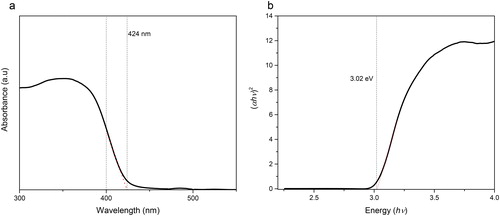
The XRD analysis has been performed to determine the phase structure of the as-prepared N-TiO2. Based on XRD spectra (), photocatalyst N-TiO2 that is prepared at pH 2 and 4 has different signals. The as-prepared N-TiO2 at pH 2 is the anatase phase.
Figure 12. The XRD spectra of the as-prepared N-TiO2.
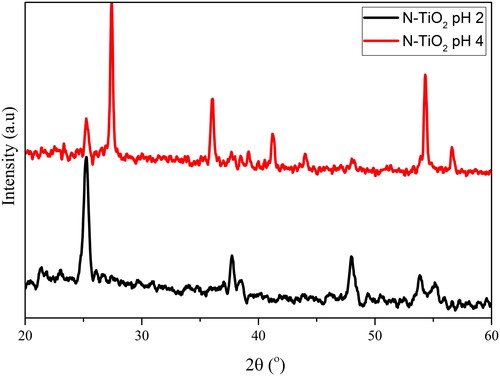
However, at pH 4, the N-TiO2 consists of two kinds of crystalline phase and from the XRD spectra at this pH the crystalline phase was dominated with rutile (85%) and anatase (15%) phases. The obtained TiO2 crystalline phase is highly dependent on the chosen synthesis method. As shown in the previous work, nanoparticle TiO2 was prepared using the sol-gel method at varying pH (3, 7 and 9) and it has varying results in which the anatase phase is only found at pH 3 and the mixture phase at pH 7 and 9 with a different composition of rutile and anatase (Santana-Aranda, Moran-Pineda, Hernandez, & Castillo, Citation2005). The composition of the mixture phase is an important factor in the context of photoactivity. In several studies, the TiO2 with mixture phase will give a higher photoactivity than the pure anatase, but the percentage composition is mostly dominated with the anatase phase. Here, the mixture phase is dominated with rutile. The change of crystalline phase structure of N-TiO2 that is prepared at pH 4, from anatase to amixture phase of anatase/rutile, will cause a change on the band gap value of this material. shows the optical transmittance profile of N-TiO2 prepared at pH 4. The absorption onset of the band gap appeared at 424 nm with a band gap value 3.02 eV. The band gap value of this photocatalyst is between the as-prepared TiO2 (rutile, 2.99 eV) and N-TiO2 prepared at pH 2 (3.24 eV).
Figure 13. UV-Vis diffuse reflectance spectra of N-TiO2 at pH 4 (a) and band gap energy of N-TiO2 at pH 4 (b).
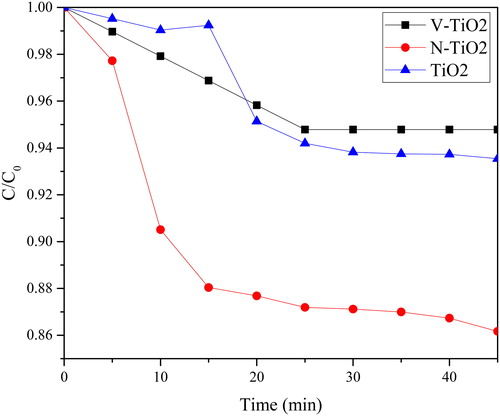
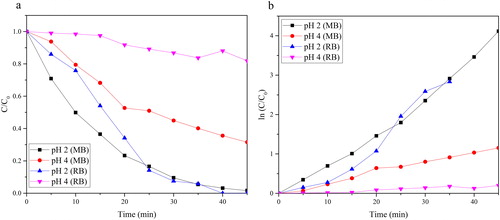
The photoactivity of the as-prepared N-TiO2 is shown in . The as-prepared N-TiO2 at pH 4 has the lowest photoactivity in both kinds of dyes, MB and RB05. This result is the impact of the high composition of rutile in the mixture phase of N-TiO2. After 45 min of photocatalytic process, the N-TiO2 at pH 4 only showed 72.42% and 20.73% of the degradation ratio for MB and RB05, respectively. The kinetic rate constants of N-TiO2 on the photocatalytic process of MB and RB05 are 2.65 × 10⁻² and 4.63 × 10⁻³, respectively. That constant value is lower than the kinetic rate constant of N-TiO2 prepared at pH 2.
Figure 14. Photocatalytic degradation (a) and rate (b) of N-TiO2 pH 2 and pH 4.
4. Conclusion
The as-prepared TiO2 and doped TiO2, using a combined hydrothermal and sol-gel method resulted in rutile and anatase phases. The presence of anatase and rutile phases of TiO2 and doped TiO2 has been confirmed using UV-DRS, XRD, Raman spectroscopy, and EPR. The N-TiO2 showed the highest photoactivity in powder form compared with the as-prepared TiO2 (rutile), anatase and V-TiO2. The influence of pH during the preparation of N-TiO2 has a big effect on the morphology and photoactivity of the photocatalyst. The N-TiO2 at pH 2 showed a higher photoactivity than N-TiO2 at pH 4 and it also showed a fine morphology. The N-TiO2 also showed the highest photoactivity when it was immobilized in the DPNR matrix. However, after being immobilized, the photoactivity of the as-prepared photocatalyst decreased to 0–30%.
Disclosure statement
No potential conflict of interest was reported by the authors.
Additional information
Funding
Related Research Data
References
- Aita, Y., Komatsu, M., Yin, S., & Sato, T. (2004). Phase-compositional control and visible light photocatalytic activity of nitrogen-doped titania via solvothermal process. Journal of Solid State Chemistry, 177(9), 3235–3238. doi: 10.1016/j.jssc.2004.04.048
- Batzill, M., Morales, E. H., & Diebold, U. (2006). Influence of nitrogen doping on the defect formation and surface properties of TiO2 rutile and anatase. Physical Review Letters, 96, 1–4. doi: 10.1103/PhysRevLett.96.026103
- Bettinelli, M., Dallacasa, V., Falcomer, D., Fornasiero, P., Gombac, V., Montini, T., … Speghini, A. (2007). Photocatalytic activity of TiO2 doped with boron and vanadium. Journal of Hazardous Materials, 146(3), 529–534. doi: 10.1016/j.jhazmat.2007.04.053
- Breeson, A. C., Sankar, G., Goh, G. K. L., & Palgrave, R. G. (2016). Rutile to anatase phase transition induced by N doping in highly oriented TiO2 films. Physical Chemistry Chemical Physics, 18(35), 24722–24728. doi: 10.1039/C6CP04003A
- Choi, Y., Umebayashi, T., & Yoshikawa, M. (2004). Fabrication and characterization of C-doped anatase TiO2 photocatalysts. Journal of Materials Science, 39(5), 1837–1839. doi: 10.1023/B:JMSC.0000016198.73153.31
- Cong, Y., Zhang, J., Chen, F., & Anpo, M. (2007). Synthesis and characterization of nitrogen-doped TiO2 nanophotocatalyst with high visible light activity. The Journal of Physical Chemistry C, 111(19), 6976–6982. doi: 10.1021/jp0685030
- Deo, G., Hardcastle, F. D., Richards, M., Hirt, A. M., & Wachs, I. E. (1990). Raman spectroscopy of vanadium oxide supported on alumina. In R. Terry, K. Baker, L. L. Murrell (Eds.), Novel materials in heterogeneous catalysis (pp. 317–328). Washington, DC: American Chemical Society. doi: 10.1021/bk-1990-0437.ch029
- Di Valentin, C., Pacchioni, G., & Selloni, A. (2004). Origin of the different photoactivity of N-doped anatase and rutile TiO2. Physical Review B: Condensed Matter and Materials Physics, 70, 1–4. doi: 10.1103/PhysRevB.70.085116
- Di Valentin, C., Pacchioni, G., Selloni, A., Livraghi, S., & Giamello, E. (2005). Characterization of paramagnetic species in N-doped TiO2 powders by EPR spectroscopy and DFT calculations. The Journal of Physical Chemistry B, 109(23), 11414–11419. doi: 10.1021/jp051756t
- Dogan, F., Chao, S., Peng, J., & Greenbaum, S. G. (2014). Vanadium doped nanostructured TiO2 dielectrics. Materials Research Society, 1645. doi: 10.1557/opl.2014.256
- Gao, L., Gan, W., Qiu, Z., Cao, G., Zhan, X., Qiang, T., & Li, J. (2018). Biomorphic carbon-doped TiO2 for photocatalytic gas sensing with continuous detection of persistent volatile organic compounds. ACS Applied Nano Materials, 1(4), 1766–1775. doi: 10.1021/acsanm.8b00209
- Gao, Y., & Liu, H. (2005). Preparation and catalytic property study of a novel kind of suspended photocatalyst of TiO2-activated carbon immobilized on silicone rubber film. Materials Chemistry and Physics, 92(2–3), 604–608. doi: 10.1016/j.matchemphys.2005.02.018
- Guarino, M., Costa, A., & Porro, M. (2008). Photocatalytic TiO2 coating-to reduce ammonia and greenhouse gases concentration and emission from animal husbandries. Bioresource Technology, 99(7), 2650–2658. doi: 10.1016/j.biortech.2007.04.025
- Hou, Q., Zheng, Y., Chen, J. F., Zhou, W., Deng, J., & Tao, X. (2011). Visible-light-response iodine-doped titanium dioxide nanocrystals for dye-sensitized solar cells. Journal of Materials Chemistry, 21(11), 3877–3883. doi: 10.1039/c0jm03327h
- Jagadale, T. C., Takale, S. P., Sonawane, R. S., Joshi, H. M., Patil, S. I., Kale, B. B., & Ogale, S. B. (2008). N-doped TiO2 nanoparticle based visible light photocatalyst by modified peroxide sol-gel method. The Journal of Physical Chemistry C, 112(37), 14595–14602. doi: 10.1021/jp803567f
- Kokorin, A. I., Sukhanov, A. A., Gromov, O. I., Arakelyan, V. M., Aroutiounian, V. M., & Voronkova, V. K. (2016). EPR Study of TiO2 (Rutile) Doped with Vanadium. Applied Magnetic Resonance, 47(5), 479–485. doi: 10.1007/s00723-016-0762-z
- Leong, K. H., Monash, P., Ibrahim, S., & Pichiah, S. (2014). Solar photocatalytic activity of anatase TiO2 nanocrystals synthesized by non-hydrolitic sol–gel method. Solar Energy, 101, 321–332. doi: 10.1016/j.solener.2014.01.006
- Lin, Z., Orlov, A., Lambert, R. M., & Payne, M. C. (2005). New insights into the origin of visible light photocatalytic activity of nitrogen-doped and oxygen-deficient anatase TiO2. The Journal of Physical Chemistry B, 109(44), 20948–20952. doi: 10.1021/jp053547e
- Liu, B., Wang, X., Cai, G., Wen, L., Song, Y., & Zhao, X. (2009). Low temperature fabrication of V-doped TiO2 nanoparticles, structure and photocatalytic studies. Journal of Hazardous Materials, 169(1–3), 1112–1118. doi: 10.1016/j.jhazmat.2009.04.068
- Martin, S. T., Morrison, C. L., & Hoffmann, M. R. (1994). Photochemical mechanism of size-quantized vanadium-doped TiO2 particles. The Journal of Physical Chemistry, 98(51), 13695–13704. doi: 10.1021/j100102a041
- Mathews, N. R., Cortes Jacome, M. A., Angeles-Chavez, C., & Toledo Antonio, J. A. (2015). Fe doped TiO2 powder synthesized by sol gel method: Structural and photocatalytic characterization. Journal of Materials Science: Materials in Electronics, 26(8), 5574–5584. doi: 10.1007/s10854-014-2294-3
- Nagalakshmi, P., & Radhika, G. B. (2017). Synthesis of Fe doped titania nanoparticles for the removal of hexavalent chromium from synthetic Cr (VI) solution. International Journal of Engineering Technology Science and Research, 4, 1038–1044.
- Nakamura, R., Tanaka, T., & Nakato, Y. (2004). Mechanism for visible light responses in anodic photocurrents at N-doped TiO2 film electrodes. The Journal of Physical Chemistry B, 108(30), 10617–10620. doi: 10.1021/jp048112q
- Nigussie, G. Y., Tesfamariam, G. M., Tegegne, B. M., Weldemichel, Y. A., Gebreab, T. W., & Gebrehiwot, D. G. (2018). Antibacterial activity of Ag-doped TiO2 and Ag-doped ZnO nanoparticles, 2018, 5927485. doi: 10.1155/2018/5927485
- Ohno, T., Mitsui, T., & Matsumura, M. (2003). Photocatalytic activity of S-doped TiO2 photocatalyst under visible light. Chemistry Letters, 32(4), 364–365. doi: 10.1246/cl.2003.364
- Ohsaka, T., Izumi, F., & Fujiki, Y. (1978). Raman spectrum of anatase, TiO2. Journal of Raman Spectroscopy, 7(6), 321–324. doi: 10.1002/jrs.1250070606
- Ramchiary, A., & Samdarshi, S. K. (2015). Hydrogenation based disorder-engineered visible active N-doped mixed phase titania. Solar Energy Mater Solar Cells, 134, 381–388. doi: 10.1016/j.solmat.2014.12.031
- Razali, N. A., & Othman, S. A. (2017). Synthesis and characterization of nitrogen doped with titanium dioxide at different calcination temperature by using sol-gel method. Journal of Science and Technology, 9, 124–130.
- Santana-Aranda, M. A., Moran-Pineda, M., Hernandez, J., & Castillo, S. (2005). Physical properties of TiO2 prepared by sol-gel under different pH conditions for photocatalysis. Soc Mex Cienc y Technol Superf y Mater, 18, 46–49.
- Sathish, M., Viswanathan, B., Viswanath, R. P., & Gopinath, C. S. (2005). Synthesis, characterization, electronic structure, and photocatalytic activity of nitrogen-doped TiO2 nanocatalyst. Chemistry of Materials, 17(25), 6349–6353. doi: 10.1021/cm052047v
- Seery, M. K., George, R., Floris, P., & Pillai, S. C. (2007). Silver doped titanium dioxide nanomaterials for enhanced visible light photocatalysis. Journal of Photochemistry and Photobiology A: Chemistry, 189(2–3), 258–263. doi: 10.1016/j.jphotochem.2007.02.010
- Serpone, N. (2006). Is the band gap of pristine TiO2 narrowed by anion- and cation-doping of titanium dioxide in second-generation photocatalysts? Journal of Physical Chemistry B, 110(48), 24287–24293. doi: 10.1021/jp065659r
- Sousa, M. A., Gonçalves, C., Pereira, J., Vilar, V. J. P., Boaventura, R. A. R., & Alpendurada, M. F. (2013). Photolytic and TiO2-assisted photocatalytic oxidation of the anxiolytic drug lorazepam (Lorenin® pills) under artificial UV light and natural sunlight: A comparative and comprehensive study. Solar Energy, 87, 219–228. doi: 10.1016/j.solener.2012.10.013
- Stathatos, E., Lianos, P., Falaras, P., & Siokou, A. (2000). Photocatalytically deposited silver nanoparticles on mesoporous TiO2 films. Langmuir, 16(5), 2398–2400. doi: 10.1021/la981783t
- Sudeep, P. K., Takechi, K., & Kamat, P. V. (2007). Harvesting photons in the infrared. Electron injection from excited tricarbocyanine dye (IR-125) into TiO2 and Ag@TiO2 core-shell nanoparticles. Journal of Physical Chemistry C, 111(1), 488–494. doi: 10.1021/jp0665022
- Tian, H., Ma, J., Li, K., & Li, J. (2009). Hydrothermal synthesis of S-doped TiO2 nanoparticles and their photocatalytic ability for degradation of methyl orange. Ceramics International, 35(3), 1289–1292. doi: 10.1016/j.ceramint.2008.05.003
- Tokudome, H., & Miyauchi, M. (2004). N-doped TiO2 nanotube with visible light activity. Chemistry Letters, 33(9), 1108–1109. doi: 10.1246/cl.2004.1108
- Velmurugan, R., Krishnakumar, B., Subash, B., & Swaminathan, M. (2013). Preparation and characterization of carbon nanoparticles loaded TiO2 and its catalytic activity driven by natural sunlight. Solar Energy Materials Solar Cells, 108, 205–212. doi: 10.1016/j.solmat.2012.09.018
- Wang, J., Tafen, D. N., Lewis, J. P., Hong, Z., Manivannan, A., Zhi, M., … Wu, N. (2009). Origin of photocatalytic activity of nitrogen-doped TiO2 nanobelts. Journal of the American Chemical Society, 131(34), 12290–12297. doi: 10.1021/ja903781h
- Wang, W. K., Chen, J. J., Zhang, X., Huang, Y. X., Li, W. W., & Yu, H. Q. (2016). Self-induced synthesis of phase-junction TiO2 with a tailored rutile to anatase ratio below phase transition temperature. Scientific Reports, 6, 1–10. doi: 10.1038/srep20491
- Went, G. T., Leu, L. J., & Bell, A. T. (1992). Quantitative structural analysis of dispersed vanadia species in TiO2 (anatase)-supported V2O5. Journal of Catalysis, 134(2), 479–491. doi: 10.1016/0021-9517(92)90336-G
- Xing, M., Zhang, J., & Chen, F. (2009). New approaches to prepare nitrogen-doped TiO2 photocatalysts and study on their photocatalytic activities in visible light. Applied Catalysis B Environmental, 89(3–4), 563–569. doi: 10.1016/j.apcatb.2009.01.016
- Xiong, L.-B., Li, J.- L., Yang, B., & Yu, Y. (2012). Ti 3+ in the surface of titanium dioxide: Generation, properties and photocatalytic application. Journal of Nanomaterials, 2012, 831524. doi: 10.1155/2012/831524
- Yang, Z., & Zhou, A. (2007). Effects of nitrogen doping on microstructure and photocatalytic activity of nanocrystalline TiO2 powders. Journal of Wuhan University of Technology-Mater. Sci. Ed., 22(3), 457–461. doi: 10.1007/s11595-006-3457-8