
 ?Mathematical formulae have been encoded as MathML and are displayed in this HTML version using MathJax in order to improve their display. Uncheck the box to turn MathJax off. This feature requires Javascript. Click on a formula to zoom.
Abstract
The present study was undertaken to determine the physicochemical characteristics of eleven Moroccan honey samples from various floral origins (acacia, carob, eucalyptus, harmal, jujube, lavender, orange, reseda, rosemary, spurge and thyme). The water content was found to be between 14.55 and 20.99%; the water activity level varied between 0.49 and 0.58% while the total acidity which is directly associated to pH and free acidity, presented values from 23.55 to 43.53meq/kg and revealed the absence of inappropriate fermentation. Citric acid was the predominant organic acid followed by lactic, malic, succinic and oxalic acids and trace amount of fumaric acid. The highest ratio of fructose to glucose (>1.5) belonged to eucalyptus and reseda honey samples. Based on diastase activity, proline content and hydroxymethylfurfural content, rosemary honey showed the best quality. Strong and positive correlation between ash content and colour, therefore harmal which is a dark amber contained high mineral content. Potassium was the predominate mineral followed by Na, Ca and Mg which were found in a highest amount in carob honey. Iron, zinc, manganese and cupper were found also in analysed honeys but in trace amount. Quite low amounts of Pb, Cd and Ni found in these honeys indicate the uncontaminated environment where they are produced. The results demonstrated that nine of eleven examined samples appeared to be within the limits established by the European legislation. Moreover, there is great a variability in the composition of honey from different species. However, it was not possible to identify the real factor influencing its features.
1. Introduction
Honey is a sweet and flavourful product made by honey bees from plants nectar and honeydew. It was using by people for long time as the most interesting and dependable sweetener without processing. Honey is a complex mixture containing approximately 181 substances including sugars (which are the main compounds), enzymes, amino acids, organic acids, carotenoids, vitamins, minerals, and aromatic substances (Da Silva, Gauche, Gonzaga, Costa, & Fett, Citation2016). The composition, flavour, aroma and colour of honey depend on the plant species from which the nectar is collected, climatic conditions, geographical regions, beekeeping practices and processing, storage conditions as well as honeybee species involved in its production (Guler, Bakan, Nisbet, & Yavuz, Citation2007). Monofloral honeys, made up of nectar belonging to a single plant are more expensive than honeys from mixed botanical sources (Feás, Pires, Iglesias, & Estevinho, Citation2010). These honeys are more requested by consumers (Feás et al., Citation2010). Several types of monofloral honeys are produced in Morocco (Chakir, Romane, Marcazzan, & Ferrazzi, Citation2016) and some of them are more appreciated than others due to their flavour and aroma or their therapeutic attributes. It is noteworthy that melissopalynology was the first technique used to ascertain the botanical origin of honey. However, its limitations have led researchers to investigate the physicochemical parameters, which may determine more appropriately the honey botanical origin (Aazza, Lyoussi, Antunes, & Miguel, Citation2014). Therefore, it appears very interesting to examine the physicochemical composition of such monofloral honeys in order to determine the botanical origin as well as their quality.
Thus, the purpose of the present study was to investigate the quality of eleven monofloral honey samples produced in Morocco, by the analysis of their physicochemical characteristics including sugar, moisture, pH, free lactonic, total acidity, organic acids, ash content, electrical conductivity, mineral contents (K, Na, Ca, Mg, Fe, Zn, Cu, Mn), hydroxymethylfurfural (HMF), diastase activity and proline content.
2. Materials and methods
2.1. Honey samples
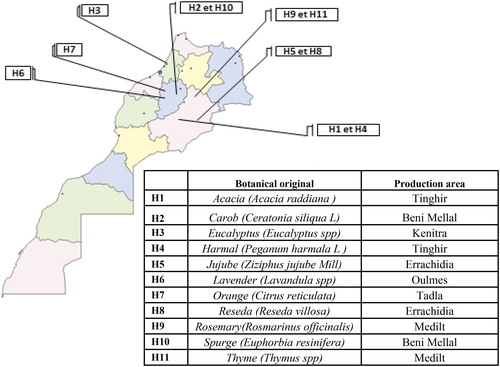
The present study was conducted using 11 unifloral honey samples acquired from honey producers in various areas of Morocco in 2017 during different seasons of the year depending on floral sources. The selected samples represented the most common varieties available in Morocco. Sensory assessment and melissopalynological analysis carried out by the official laboratory for analysis and chemical research (OLACR), was used for the determination of the botanical origin. Honey samples were kept at 20–25 °C until analysis. The information about samples are presented in .
Figure 1. Production area of analysed honeys.
2.2. Physicochemical parameters
Moisture was determined by measuring the refractive indices at 20 °C using a Digital Handheld Refractometer (DR201-95) and the determination of corresponding percentage of moisture (g/100 g honey) was evaluated following a previously reported protocol (Bogdanov, Martin, & Lullmann, Citation2000). The water activity (AW) was measured using a water activity meter (AquaLab 3TE, Pullman, WA, USA). Five grams of each honey sample was used to determine the AW. Electrical conductivity was measured at 20 °C by a conductivity meter (Jenway 4510) in solution containing 20 g of honey in 100 mL of distilled water (Bogdanov et al., Citation2000). Free acidity, pH, lactone acidity and total acidity measurements were performed according to IHC guidelines (Bogdanov et al., Citation2000). Briefly, 10 g of honey were dissolved in 75 mL of distilled water, and the pH was read. Then, the volume of sodium hydroxide (0.05M) used to reach pH 8.50 was used to determine the free acidity. Immediately, a volume of 10 mL of sodium hydroxide (0.05M) was added and, without delay, the volume of hydrochloride acid (0.05M) needed to achieve a pH 8.30 was used to determine the lactonic acidity. Total acidity results were obtained by adding free and lactone acidities.
2.3. Analysis of organic acids composition
The evaluation of organic acids levels was performed by using the method of Scherer et al. (Citation2012). Briefly, 1 mL of a mixture containing 5 g of honey dissolved in 50 mL of deionized water was filtered through a 0.45 μm syringe filter into an autosample vial for HPLC analysis. The Shimadzu liquid chromatography consisted of an autosampler (SIL-20A), a diode array detector (SPD-20A) monitored at 210 nm, pump (model LC-20AD), online degasser (DGU-20A), column oven (CTO-10AS). The column used in this experiment/analysis was a NUCLEOSIL (5 μm 4.6 × 300 mm) and the elution was carried out isocratically using phosphate buffer solution (0.01 mol/L with a pH = 2.60) as mobile phase with a flow rate of 0.5 mL/min. The injection volume was 20 µL. Identified organic acids were quantified based on peak areas compared with a calibration curve obtained with the corresponding standards.
2.4. Determination of sugar composition
The sugar content (sucrose, d-glucose and d-fructose) was determined by liquid chromatography according to Bouhlali et al. (Citation2017). Five grams of honey sample was weighed and dissolved in 100 mL of water and transferred to a volumetric flask. The homogenate was then kept in a water bath at 40 °C for 10 min (stirring frequently to aid dissolving sugars). The solution was filtered through a 0.45 µm membrane filter (Millipore) before injection into the HPLC column. The equipment consisted of a LC-10 AT Shimadzu pump, (HP 1047A) refractive index detector, Shimadzu SIL 10ADVP auto sampler, and Shimadzu C-R8A integrator. The column temperature was set at 30 °C. The mobile phase was acetonitrile/water (75/25, v/v) and the elution was performed at a flow rate of 1 mL/min. The injection volume was 20 µL. The column was Supelcosil LC-NH2 (25 cm × 4.6 mm × 5 µm, Sigma, USA). Identified sugars were quantified based on peak areas compared with a calibration curve obtained with the corresponding standards.
2.5. Determination of hydroxymethylfurfural content
The hydroxymethylfurfural (HMF) content of honey samples was analysed using the modified method of Kováčik, Grúz, Biba, and Hedbavny (Citation2016). Briefly, 5 g of honey sample was dissolved in 25 mL of deionized water and transferred to a 50 mL volumetric flask, diluted to 50 mL with deionized water, filtered through a 0.45 µm membrane filter before injection into the HPLC column. The high-pressure liquid chromatography system consisted of a Shimadzu LC-20A HPLC system (Shimadzu Co., Kyoto, Japan) equipped with: pump, on-line degasser autosampler, column oven and PDA detector. Separation was performed on a reversed phase Hypersil HyPurity C18 (250 × 4.6 mm, 5 µm). Elution was conducted using water methanol (90:10) as the mobile phase, at a flow rate of 1 mL/min. The column was maintained at 30 °C. The injection volume was 20 µL. The detection was carried out at 285 nm. The HMF content was quantified based on peak areas compared with a standard HMF.
2.6. Determination of ash and mineral composition
Ash and mineral composition were determined using the method described by Bouhlali et al. (Citation2017). Briefly, 5 g of each honey sample was placed in a previously weighed porcelain crucible and heated in furnace at 550 °C, until constant mass. The resulting ashes were dissolved in five milliliters of concentrated hydrochloric acid and the mixtures were heated in hot plate until a complete dryness. Then, some drops of H2O2 and 5 mL of de-ionized water were added and made up to 25 mL in a calibrated flask. The resulting solution was then used for the determination of mineral content. Atomic absorption spectrometry (Perkin Elmer Analyst 300) was used to determine Mg, Fe, Mn, Cu, Ca, K, Na and Zn as well as Al, Pb, Cd and Ni levels.
2.7. Colour analysis
The honey colour was determined according to the method of Kaškonienė et al. (Citation2009). Briefly, 20 mL of water was added to 10 g of honey and heated up to 40 °C to dissolve sugar crystals then the colour was determined by reading the absorbance at 635 nm. The Pfund values were calculated using the following formula (1) reported by Kaškonienė et al. (Citation2009).
(1)
(1)
2.8. Determination of diastase activity
Diastase activity was evaluated by using the Phadebas amylase test tablets according to the Harmonized Methods of the European Commission of Honey (Bogdanov et al., Citation2000). Briefly, 5 mL of honey solution containing 1 g dissolved in 100 mL of acetate buffer (0.1M, pH 5.2), was transferred to the test tube and incubated in a water bath at 40 °C for a few minutes. The test tube containing 5.0 mL of the acetate buffer solution and treated in the same manner was used as a blank. The Phadebas tablets were added into both test tubes, stirred until the tablets disintegrate. After 15 min, 1 mL sodium hydroxide solution (1M) was added to each test tube to stop reaction. The test tubes were stirred again and filtered through filter papers and the absorbance was measured at 620 nm using water as reference. The absorbance of the blank was subtracted from that of the sample solution (ΔA620). The diastase activity, expressed as DN or diastase number, was calculated from the absorbance value using EquationEquations (2)(2)
(2) and Equation(3)
(3)
(3) for high (8–40 diastase units) or low (up to 8 diastase units), respectively. EquationEquations (2)
(2)
(2) and Equation(3)
(3)
(3) were proposed by the Harmonised Methods of the European Commission of Honey (Bogdanov et al., Citation2000).
(2)
(2)
(3)
(3)
2.9. Determination of proline content
Proline content was determined spectrophotometrically using the ninhydrin which form a coloured complex measured at 510 nm according to the harmonized method of International Honey Commission (Bogdanov et al., Citation2000). Briefly, 1 mL of formic acid and 1 mL of 3% ninhydrin solution prepared in ethylene glycol monomethylether were added to three tests tubes containing 0.5 mL of deionized water (blank), 0.5 mL of proline standard solution (0.008%) (standard) and 0.5 mL of honey dilution (5% sample). The test tubes were capped, shaken and placed in boiling water bath for 15 min and then transferred to a water bath at 70 °C for 10 min. 5 mL of the 2-propanol–water–solution (50%) was added to each test tube 45 min after removing from the water bath and the absorbance was measured at 510 nm. Proline content (mg/kg) was calculated according to the following formula (4) proposed by the Harmonised Methods of the European Commission of Honey (Bogdanov et al., Citation2000).
(4)
(4)
where Es is the absorbance of the sample solution, Ea is the absorbance of the proline standard solution (average of 2 readings), E1 is the mg of proline taken for the stoke solution, E2 is the weight of honey in grams and 80 is the dilution factor.
2.10. Statistical analysis
The results were analyzed by ANOVA followed by Fisher's PLSD test using StatView 5.0 software. Differences were considered statistically significant when p < 0.05. Data are represented as mean of three repetitions for all the experiments ± standard deviation. Squared correlation coefficient (R2) was used to measure the association between two variables.
3. Results and discussion
3.1. Moisture and water activity (AW)
The water content in honey is very important since it affects its sensorial quality, microbiological stability, physical characteristics and shelf life (Stevenson et al., Citation2015). As shown in , the water content of honey ranged from 14.55% in Harmal honey to 20.99% in Reseda honey which was the only one that exceeds the maximum amount allowed by international legislations (≤ 20%) (Da Silva et al., Citation2016). These values are similar to those reported by Aazza et al. (Citation2014) and Chakir et al. (Citation2016) for Moroccan honey samples. These differences may be due to the botanical source of honey, collecting season, climatic conditions and the degree of maturity reached in the hive and beekeeping practices (Silva, Videira, Monteiro, Valentão, & Andrade, Citation2009). Despite this high amount of water content, honey contains sugars, which can interact with water molecule and decrease the water availability for microorganisms. High moisture content could accelerate crystallisation in certain types of honey and increase its water activity to values where certain yeasts could grow. The values of the water activity () varied from 0.489 in spurge honey to 0.577 in Reseda honey. These values are in agreement with previous studies reported by Abramovič, Jamnik, Burkan, and Kač (Citation2008). The majority of microbes cannot multiply below 0.900 AW and the cell division of extremophile species is repressed below ∼0.61 AW (Stevenson et al., Citation2015). These results indicate a good storage ability of these honeys, since high moisture content could lead to fermentation during storage.
Table 1. Moisture, water activity, colour, diastase and proline data obtained from honey samples.
3.2. Free acidity, pH, lactone acidity and total acidity
Honey acidity is due to the presence of organic acids mainly the gluconic acid and their lactones or internal esters and inorganic ions such as phosphate, sulphate and chloride (Silva et al., Citation2009). The free acidity of the analysed honeys was found to be ranged from 10.93 meq/kg for Acacia honey to 36.67 meq/kg for Reseda honey. These results are within the limits of EC regulation (below 50 meq/kg), indicating the absence of disagreeable fermentation.
Determination of lactones content is of interest since their hydrolysis induces a rise in free acids (Cavia, Fernández-Muino, Alonso-Torre, Huidobro, & Sancho, Citation2007). In the present study, the lactone acidity level was ranged between 4.17 meq/kg for Jujube honey and 14.73 meq/kg for Rosemary honey. The total acidity, which is the sum of free and lactone acidities, was found to be ranged between 23.55 meq/kg for Lavender honey and 43.53 meq/kg for Reseda honey (). The results of the present study are in agreement with those reported by Chakir et al. (Citation2016) but lower than those reported by Alqarni, Owayss, and Mahmoud (Citation2016) and Bettar et al. (Citation2015) for Moroccan and Saudi honeys, respectively. Moreover, the lactonic acidity found in our study are similar to those reported for Mexican (Mondragón-Cortez, Ulloa, Rosas-Ulloa, Rodríguez-Rodríguez, & ResendizVázquez, Citation2013) and Portuguese honeys (Silva et al., Citation2009), lower than those reported for Turkish honeys (Özkök, Yüksel, & Sorkun, Citation2018) and very higher than those reported for Greek honeys (Karabagias, Badeka, Kontakos, Karabournioti, & Kontominas, Citation2014). The high values in lactonic acidity observed in Rosemary honey as compared to the rest of the samples may be related to its high content of d-gluconic acid and glyconolactone. Alqarni et al. (Citation2016) have stated that the pH value in honey is not directly associated to free acidity because of the buffering action of numerous acids and minerals that contains. However, in the present study, linear relationship was found between pH and total acidity with a correlation coefficient (R2=0.81, p < 0.05). The highest pH value (4.90) was found in Lavender honey while the lowest pH value (3.54) was observed in Reseda honey. These values are in accordance with those reported by Bettar et al. (Citation2015) and Chakir et al. (Citation2016) for Moroccan honeys. The low pH in honeys is an important factor, which influences texture, stability and shelf-life through the inhibition of microorganism’s growth as bacteria require pH values that are between 4 and 8 for growth and survival (Soares, Amaral, Oliveira, & Mafra, Citation2017).
Table 2. Free acidity, pH, lactone acidity, and total acidity results obtained from honey samples.
3.3. Organic acids composition
The organic acids represent a small proportion of honey (0.5%) but assume a crucial role in its sensory properties such as flavour and colour (Mato, Huidobro, Simal-Lozano, & Sancho, Citation2006). Organic acids are derived from carbohydrates by enzymes secreted by honeybees or by the action of honey yeasts during fermentation (Cavia et al., Citation2007; Cherchi, Spanedda, Tuberoso, & Cabras, Citation1994). Mean contents of each organic acid found in the analysed honeys are illustrated in and . Among the organic acids tested, citric acid was the predominant. Citric acid level ranged from 50.46 in Lavender honey to 298.48 mg/kg in Reseda honey. Lactic acid was the second most abundant and ranged between 103.95 in Orange honey to 179.25 mg/kg in Carob honey. The third most abundant was malic acid, which ranged between 60.38 observed in Harmal honey and 180.19 mg/kg found in Reseda honey. The highest amount of succinic and oxalic acids was found in Thyme honey, by 190.06 and 177.03 mg/kg respectively, while the lowest level was found in Carob and Lavender honeys, by 37.89 and 22.83 mg/kg respectively. Fumaric acid was found to be the least abundant of the analysed organic acids in honey samples. The lowest fumaric acid content (0.26 mg/kg) was observed in Lavender honey by 0.26, whereas the highest content was noticed in Eucalyptus honey by (5.93 mg/kg). Succinic acid was not detected in both Harmal and Lavender honeys while citric acid was not found in Acacia honey. These results are within the range reported previously by Cherchi et al. (Citation1994), Mato et al. (Citation2006), and Suarez-Luque, Mato, Huidobro, Simal-Lozano, and Sancho (Citation2002). The high amount of lactic acid found in analysed honeys may be due to the high content of lactic acid bacteria community present in the honey stomach of honeybees (Olofsson et al., Citation2016). The studied honey samples are a good source of malic, citric, succinic and oxalic acids which behave as antioxidants because they have the ability to chelate metals. They are, therefore, classified as preventive or synergistic (Pereira, Valentão, & Andrade, Citation2009). Moreover, the presence in honeys of organic acids such as citric, lactic, acetic, and malic acids, can contribute to the solubilization of copper and iron and increase the bioavailability of these elements (Teucher, Olivares, & Cori, Citation2004; Wapnir, Citation1998). This dissimilarity in composition of organic acids may be due to the differences in floral and/or geographical origin of honeys.
Figure 2. Chromatogram of organic acid found in eucalyptus honey. Peak numbers: oxalic acid (1); malic acid (2); lactic acid (3); citric acid (4); succinic acid (5); fumaric acid (6).
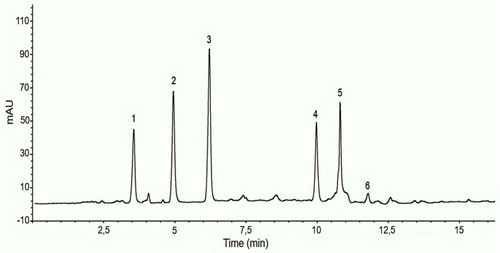
Table 3. Sugar and organic acids content of honey samples.
3.4. Sugar composition
As shown in and -fructose and d-glucose were the main carbohydrates found in the analysed honey samples. The d-fructose content was between 33.95% in Rosemary honey and 48.70% in Harmal honey while the d-glucose content ranged from 23.60% found in Reseda honey and 38.03% observed in Acacia honey. As expected, d-fructose was the predominant carbohydrate in analysed honeys. The proportion of d-fructose to d-glucose is fundamentally related to the nectar source and it is used to assess honey granulation due to less water solubility of d-glucose than d-fructose (Tornuk et al., Citation2013). The fact that all samples present high levels of d-fructose in comparison to d-glucose and sucrose suggests that these honeys might have a low glycemic index (GI). The insulin regulating benefits of eating a low GI diet for individuals with established diabetes are well known. Indeed, studies have reported that diets with low glycemic index are relevant to the prevention and management of diabetes and coronary heart disease (Augustin et al., Citation2015). Therefore, one may suggest that specific honey varieties such as used in the present study with low GI may be recommended for subjects with impaired glucose tolerance instead of saccharose in food preparations (Deibert, König, Kloock, Groenefeld, & Berg, Citation2010) to prevent the development of diabetes and artery coronary diseases.
Figure 3. Chromatogram of sugar found in orange honey. Peak numbers: fructose (1); glucose (2); sucrose (3).
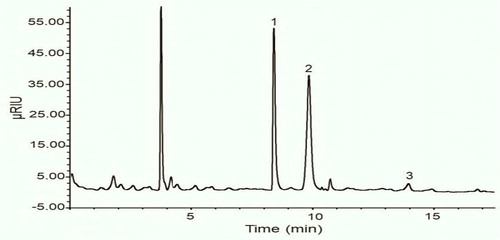
The sucrose content ranged between 0.92% in Eucalyptus honey to 2.35% in Orange honey. This parameter is used to detect improper handling of honey; high levels may be due to inadequate maturation or prolonged artificial feeding of bees with sucrose syrups. Low sucrose contents indicate that sucrose from flower nectar is completely converted into glucose and fructose, and the honey can be labelled as mature honey. Invertase enzymes are produced by hypopharyngeal glands of foraging bees and the amount is dependent to several factors such as age, diet and physiological stage of the bees, the strength of the colony, temperature and abundance of nectar flow (Shamsudin et al., Citation2019). The data found in this study are in conformity with the limits established by the European codex honey standards, which is 5 g/100 g of sucrose in honeys (Codex Alimentarius Committee on Sugars, Citation2001). These results are similar to those previously reported in honeys from Morocco (Chakir et al., Citation2016), Spain (Escuredo, Míguez, Fernández-González, & Seijo, Citation2013) and Turkey (Tornuk et al., Citation2013). Sugar composition depends for the most part on the honey’s plant source, geographical area, and is influenced by climate, processing and storage (Da Silva et al., Citation2016; Escuredo et al., Citation2013).
3.5. Hydroxymethylfurfural content
Hydroxymethylfurfural (HMF) is produced through Maillard reactions and caramelization or when the hexose undergoes dehydration in an acid medium (Shapla, Solayman, Alam, Khalil, & Gan, Citation2018). This aldehyde is widely recognized as an indicator of honey samples freshness. As shown in , the HMF content of studied honeys varied between 8.30 mg/kg observed in Rosemary honey and 68.92 mg/kg depicted in Acacia honey which is above the European standard limit (40 mg/kg) (Shapla et al., Citation2018; Silva et al., Citation2009). The high level of this organic component observed in Acacia and Thyme honeys may be the results of storage conditions or inadequate processing as well as falsification with sugar additives. Our data are in agreement with those reported by Aazza et al. (Citation2014) and Silva et al. (Citation2013), lower than those reported by Alqarni et al. (Citation2016) and higher than those found for honeys from Slovenia (Kováčik et al., Citation2016). The high temperature in harvested area may be the reason of these high HMF content in some Moroccan honeys compared to other honeys from other countries known for their low temperature. Moreover, the high temperature in extraction and during storage may also be critical in this respect. At the preclinical level, no toxic effects have been observed at daily doses ranging from 80 to 100 mg/kg body weight (Shapla et al., Citation2018). Moreover, HMF was found to be beneficial to human health by providing anti-oxidative, anti-allergic, anti-inflammatory, anti-hypoxic, anti-sickling, and anti-hyperuricemic effects (Shapla et al., Citation2018).
3.6. Electrical conductivity and ash content
As shown in , the electrical conductivity values varied between 137.12 μS cm−1 for Reseda and 824.45 μS cm−1 for Harmal. The obtained results for all honey samples except Harmal are below the maximum limit indicated by England legislation for honey (800 μS cm−1). The present results are in agreement with those reported previously by Chakir et al. (Citation2016) and Ouchemoukh, Louaileche, and Schweitzer (Citation2007) for Moroccan and Algerian honeys respectively. Strong correlation was observed between ash content and electrical conductivity (R2=0.93, p < 0.05) which is in agreement with previously reported study by Silva et al. (Citation2009).
Table 4. Electrical conductivity, ash and mineral content of honey samples.
Ash content is a quality benchmark used for the determination of the botanical and geographical origins of honey samples. The maximum ash content was found in Harmal (0.57%), while Reseda (0.17%) contains the minimum content (). It is noteworthy that the Ash value below (0.6%) represents the allowed limit for floral honeys indicating a lack of adulterations with molasses (Soares et al., Citation2017). These findings are slightly higher than those reported by Aazza et al. (Citation2014) and Bettar et al. (Citation2015) for Moroccan honey samples. Beekeeping techniques, collecting processes and the material collected by the bees foraging on the flowers can affect the ash composition of honeys.
3.7. Mineral composition
The mineral content in honey is an important directory of possible environmental pollution, especially for heavy metals, and represents a potential indicator of geographical origin of honey (Soares et al., Citation2017). As appeared in , there were significant differences (p < 0.05) in minerals content between the analysed honey samples. The potassium was the predominant mineral ranged between 263.40 and 1487.71 ppm, followed by sodium between (45.40 and 297.55 ppm), calcium (44.39 and 242.36 ppm), magnesium (27.03 and 113.60 ppm), iron (2.44 and 16.62 ppm), zinc (2.59 and 9.47 ppm), manganese (2.35 and 9.93 ppm) and cupper in the lowest amount (0.59 and 2.33 ppm). The mineral contents in this study were within the range reported in honeys from Tunisia (Boussaid et al., Citation2018), Italy (Di Bella et al., Citation2015) and Morocco (Aazza et al., Citation2014). Calcium content was higher than that of sodium in Acacia, Reseda, Rosemary honeys. Among the analysed honeys, Carob was found to contain the highest amount of potassium, sodium, calcium and magnesium. The fact that carob honey contains both high Na and K levels makes it less dangerous for the hypertensive patients to consume this honey type. Moreover, the consumption of carob honey might be recommended for patients with hypertension. Indeed, studies have reported that the increased intake of minerals such as potassium, magnesium, and calcium by dietary means was found to reduce blood pressure in hypertensive patients (Houston & Harper, Citation2008). The highest amount of manganese and zinc was observed in orange honey and the highest amount of iron and cupper was observed respectively in Thyme and Jujube honeys. In accordance with these results, Aazza et al. (Citation2014) have found also the highest content of potassium, calcium and magnesium in carob honey. The mean concentration of K (885.74 mg/kg) and Ca (113.84 mg/kg) in our honey samples was higher than those reported for honeys from Portugal (Silva, Sousa, & Taveira, Citation2017), Saudi Arabia (Alqarni et al., Citation2016), Morocco (Chakir et al., Citation2016) and lower than those reported for honeys from Malaysia (Moniruzzaman, Chowdhury, Rahman, Sulaiman, & Gan, Citation2014). The mean level of Fe (8.30 mg/kg), Zn (5.92 mg/kg), Mn (5.77 mg/kg) and Cu (1.18 mg/kg) was very high compared to those reported for honeys from Portugal (Silva et al., Citation2017), Italy (Di Bella et al., Citation2015), Brazil (Liberato et al., Citation2013) and much lower compared to those reported for honeys from Malaysia (Moniruzzaman et al., Citation2014). Moreover, Alqarni et al. (Citation2016) have reported a highly iron content in comparison to honey samples investigated in the present study. The amount of minerals is small and the contribution of honey to the recommended daily intake (RDI) of the different trace substances is marginal. Interestingly, the highest amount of manganese, zinc, copper and iron found in Moroccan honey samples may help to reduce oxidative stress-induced cell damage since these minerals are a part of the anti-oxidant enzyme superoxide dismutase (SOD) (Ighodaro & Akinloye, Citation2018). The differences observed in mineral composition between our results and those reported by other authors (Aazza et al., Citation2014; Chakir et al., Citation2016) for Moroccan honey samples from the same botanical origin and using the same method suggest that the mineral profile cannot be used as potential indicator of floral source of honey. This variability in mineral content can be attributed to floral origin, climatic condition, environment, geographical area, soil type as well as beekeeping practice and materials used for storage.
3.8. Toxic metal content
The toxic metal content of honey is of high interest mainly as a quality indicator. These minerals may threaten the health of human as a consumer when they accumulate to a toxic concentration level (Aghamirlou et al., Citation2015). Interestingly, quite low amount of Pb, Cd and Ni were found in our analysed honeys (). The high amount of these toxic metals was established in Eucalyptus honey collected from Kenitra, which is a heavily industrialized Moroccan city. Moreover, the lead mines in Midelt area may explain the high amount of lead in honeys collected from Midelt especially Rosemary and Thyme honeys. The lowest amount of these metals in the other honeys is attributed to the uncontaminated environment located in mountain pasture far from the road and the factories where these honeys were extracted. The highest content of aluminium in analysed honeys may be due to beekeeping practice and materials used mainly storage containers. It is noteworthy that the overall values of these metal levels were below the maximum permissible given by the World Health Organization (WHO)/Food and Agricultural Organization (FAO) (Aghamirlou et al., Citation2015).
Table 5. Toxic metals content of honey samples.
3.9. Honey colour
Colour is the physical property perceived most immediately by the consumer, which may influence the price of honey in the world market. The colour of the tested honeys varied from extra white observed in orange honey to dark amber depicted in both Acacia and Harmal honeys (). In agreement with the findings of Malacalza, Caccavari, Fagúndez, and Lupano (Citation2005), the colour of honey is highly correlated with its ash content (R2=0.78, p < 0.05). According to Kaškonienė et al. (Citation2009), pigments such as chlorophylls, carotenoids, flavonoids and derivatives of tannins as well as polyphenols present in honeys may affect their colour intensity. However, very low significant correlation was found between colour/polyphenols (R2=0.451, p < 0.05) and colour/flavonoids (R2=0.373, p < 0.05) based on our previous study conducted to explore the anti-oxidant capacities of the same honey samples (Bouhlali et al., Citation2017). The same honey samples were found to contain a high amount of polyphenols (239.47–1138.53 mg GAE/Kg Fw) and flavonoids (11.72–179.08 mg RE/Kg FW) (Bouhlali et al., Citation2017). These polyphenols which are well known for their anti-oxidant properties exert beneficial effects on human health by reducing the risk of heart attacks, strokes and some types of cancer (Khalil & Sulaiman, Citation2010). In addition, studies have reported that honey ameliorates the lipid profile in humans by reducing the triglycerides, total cholesterol and LDL cholesterol and raising the HDL cholesterol levels (Majid et al., Citation2013). These beneficial effects of honey are probably mediated through its high phenolic content. According to Alam, Islam, Gan, and Khalil (Citation2014) and Miguel, Antunes, and Faleiro (Citation2017), honeys such as Acacia and thyme promote burn and wound healing due to their anti-bacterial, anti-inflammatory and immunomodulatory effects. Honey delays cancer development and improve the health of the gut by acting as a probiotic agent (Miguel et al., Citation2017). Several studies have shown that honeys from diverse floral sources including Acacia, citrus, rosemary and thyme possess potential anti-cancerous activities (Miguel et al., Citation2017).
3.10. Diastase activity
Diastase (α-amylase and β-amylase mixture) is an enzyme naturally present in honey, which serves to digest the starch molecule to a mixture of maltose (disaccharide) and maltotriose (trisaccharide) (Furkan Yardibi & Gumus, Citation2010). As shown in , the highest diastase content was found in Harmal honey (29.30°Gothe) while the lowest diastase level was observed in Carob honey (7.40°Gothe). Among the analysed honey samples, only one presented an inappropriate diastase activity, which is below 8° Gothe (Da Silva et al., Citation2016). However, according to Codex Alimentarius Committee on Sugars (Citation2001), when honeys present up to 15 mg kg–1 of HMF, a minimum of 3 Göthe units can be tolerated. Similar results have been reported by Chakir et al. (Citation2016) and Juan-Borrás, Domenech, Hellebrandova, and Escriche (Citation2014) for Spanish and Moroccan honeys. Diastase concentration depends on geographic and floral source of honey. Diastase is a thermolabile enzyme hence the overheating of honey during processing and storage factors may reduce their diastase content.
3.11. Proline content
Proline is an important amino acid, which comes mainly from the salivary secretions of A. mellifera during the conversion of nectar into honey (Manzanares, García, Galdón, Rodríguez, & Romero, Citation2014). Proline content is considered as a measure for ripeness of honey and in some cases as a pointer of sugar adulteration. The proline content varied from 441.67 mg/kg observed in Spurge honey to 1207.55 mg/kg depicted in Eucalyptus honey (). These results are higher than the minimum permissible proline concentration (200 mg/kg) fixed by the international honey commission (Manzanares et al., Citation2014) which corroborate the ripeness state and the absence of sugar adulteration of the studied honeys. The proline values observed in the present study are very close to those reported by Aazza et al. (Citation2014) for Moroccan honeys, but much higher than those of Nanda, Singh, Kukreja, and Bawa (Citation2009) who studied Indian honeys.
4. Conclusion
The results of the present study showed that almost 82% of the examined honey samples were inside the limits established by the European legislation demonstrating satisfactory processing, great maturity and freshness. Potassium, sodium, calcium and magnesium found in highest amount in carob honey were the most abundant of the determined elements. The very low amount of toxic metals in these honeys indicates the uncontaminated environment where they are produced while the highest amount of these metals was found in eucalyptus honey produced in industrial city. The high HMF content observed in acacia and thyme honeys indicates inadequate storage conditions. The studied honey samples are a good source of malic, citric, succinic and oxalic acids which behave as anti-oxidants because they have the ability to chelate metals.
Disclosure statement
No potential conflict of interest was reported by the authors.
References
- Aazza, S., Lyoussi, B., Antunes, D., & Miguel, M. G. (2014). Physicochemical characterization and antioxidant activity of 17 commercial Moroccan honeys. International Journal of Food Sciences & Nutrition, 65(4), 449–457. doi:10.3109/09637486.2013.873888
- Abramovič, H., Jamnik, M., Burkan, L., & Kač, M. (2008). Water activity and water content in Slovenian honeys. Food Control, 19(11), 1086–1090.
- Aghamirlou, H. M., Khadem, M., Rahmani, A., Sadeghian, M., Mahvi, A. H., Akbarzadeh, A., & Nazmara, S. (2015). Heavy metals determination in honey samples using inductively coupled plasma-optical emission spectrometry. Journal of Environmental Health Science & Engineering, 13(1), 39.
- Alam, F., Islam, M. D., Gan, S. H., & Khalil, M. (2014). Honey: A potential therapeutic agent for managing diabetic wounds. Evidence-Based Complementary & Alternative Medicine, 2014, 1. doi:10.1155/2014/169130
- Alqarni, A. S., Owayss, A. A., & Mahmoud, A. A. (2016). Physicochemical characteristics, total phenols and pigments of national and international honeys in Saudi Arabia. Arabian Journal of Chemistry, 9(1), 114–120. doi:10.1016/j.arabjc.2012.11.013
- Augustin, L. S. A., Kendall, C. W. C., Jenkins, D. J. A., Willett, W. C., Astrup, A., Barclay, A. W., … Poli, A. (2015). Glycemic index, glycemic load and glycemic response: An International Scientific Consensus Summit from the International Carbohydrate Quality Consortium (ICQC). Nutrition, Metabolism & Cardiovascular Diseases, 25(9), 795–815.
- Bettar, I., González-Miret, M. L., Hernanz, D., Marconi, A., Heredia, F. J., & Terrab, A. (2015). Characterisation of Moroccan Spurge (Euphorbia) honeys by their physicochemical characteristics, mineral contents and colour. Arabian Journal of Chemistry. doi:10.1016/j.arabjc.2015.01.003
- Bogdanov, S., Martin, P., & Lullmann, C. (2000). Harmonised Methods of the International Honey Commission. Liebefeld: Swiss Bee Research Centre, FAM, Liebefeld.
- Bouhlali, E. D. T., Ramchoun, M., Alem, C., Ghafoor, K., Ennassir, J., & Zegzouti, Y. F. (2017). Functional composition and antioxidant activities of eight Moroccan date fruit varieties (Phoenix dactylifera L.). Journal of the Saudi Society of Agricultural Sciences, 16(3), 257–264. doi:10.1016/j.jssas.2015.08.005
- Boussaid, A., Chouaibi, M., Rezig, L., Hellal, R., Donsì, F., Ferrari, G., & Hamdi, S. (2018). Physicochemical and bioactive properties of six honey samples from various floral origins from Tunisia. Arabian Journal of Chemistry, 11(2), 265–274. doi:10.1016/j.arabjc.2014.08.011
- Cavia, M. M., Fernández-Muino, M. A., Alonso-Torre, S. R., Huidobro, J. F., & Sancho, M. T. (2007). Evolution of acidity of honeys from continental climates: Influence of induced granulation. Food Chemistry, 100(4), 1728–1733. doi:10.1016/j.foodchem.2005.10.019
- Chakir, A., Romane, A., Marcazzan, G. L., & Ferrazzi, P. (2016). Physicochemical properties of some honeys produced from different plants in Morocco. Arabian Journal of Chemistry, 9(2), 946–954.
- Chepulis, L., & Francis, E. (2013). The glycaemic index of Manuka honey. e-SPEN Journal, 8(1), e21–e24. doi:10.1016/j.clnme.2012.11.002
- Cherchi, A., Spanedda, L., Tuberoso, C., & Cabras, P. (1994). Solid-phase extraction and high-performance liquid chromatographic determination of organic acids in honey. Journal of Chromatography A, 669(1–2), 59–64. doi:10.1016/0021-9673(94)80336-6
- Codex Alimentarius Committee on Sugars. (2001). Codex standard 12, Revised Codex Standard for Honey. Standards & Standard Methods, 11, 1–7.
- Da Silva, P. M., Gauche, C., Gonzaga, L. V., Costa, A. C. O., & Fett, R. (2016). Honey: Chemical composition, stability and authenticity. Food Chemistry, 196, 309–323. doi:10.1016/j.foodchem.2015.09.051
- Deibert, P., König, D., Kloock, B., Groenefeld, M., & Berg, A. (2010). Glycaemic and insulinaemic properties of some German honey varieties. European Journal of Clinical Nutrition, 64(7), 762. doi:10.1038/ejcn.2009.103
- Di Bella, G., Turco, V. L., Potortì, A. G., Bua, G. D., Fede, M. R., & Dugo, G. (2015). Geographical discrimination of Italian honey by multi-element analysis with a chemometric approach. Journal of Food Composition & Analysis, 44, 25–35. doi:10.1016/j.jfca.2015.05.003
- Escuredo, O., Míguez, M., Fernández-González, M., & Seijo, M. C. (2013). Nutritional value and antioxidant activity of honeys produced in a European Atlantic area. Food Chemistry, 138(2–3), 851–856. doi:10.1016/j.foodchem.2012.11.015
- Feás, X., Pires, J., Iglesias, A., & Estevinho, M. L. (2010). Characterization of artisanal honey produced on the Northwest of Portugal by melissopalynological and physico-chemical data. Food & Chemical Toxicology: An International Journal Published for the British Industrial Biological Research Association, 48(12), 3462–3470. doi:10.1016/j.fct.2010.09.024
- Furkan Yardibi, M., & Gumus, T. (2010). Some physico-chemical characteristics of honeys produced from sunflower plant (Helianthus annuus L.). International Journal of Food Science & Technology, 45(4), 707–712. doi:10.1111/j.1365-2621.2010.02184.x
- Guler, A., Bakan, A., Nisbet, C., & Yavuz, O. (2007). Determination of important biochemical properties of honey to discriminate pure and adulterated honey with sucrose (Saccharum officinarum L.) syrup. Food Chemistry, 105(3), 1119–1125. doi:10.1016/j.foodchem.2007.02.024
- Houston, M. C., & Harper, K. J. (2008). Potassium, magnesium, and calcium: Their role in both the cause and treatment of hypertension. Journal of Clinical Hypertension (Greenwich, Conn.), 10(7 Suppl 2), 3–11. doi:10.1111/j.1751-7176.2008.08575.x
- Ighodaro, O. M., & Akinloye, O. A. (2018). First line defence antioxidants-superoxide dismutase (SOD), catalase (CAT) and glutathione peroxidase (GPX): Their fundamental role in the entire antioxidant defence grid. Alexandria Journal of Medicine, 54(4), 287–293. doi:10.1016/j.ajme.2017.09.001
- Juan-Borrás, M., Domenech, E., Hellebrandova, M., & Escriche, I. (2014). Effect of country origin on physicochemical, sugar and volatile composition of acacia, sunflower and tilia honeys. Food Research International, 60, 86–94. doi:10.1016/j.foodres.2013.11.045
- Karabagias, I. K., Badeka, A. V., Kontakos, S., Karabournioti, S., & Kontominas, M. G. (2014). Botanical discrimination of Greek unifloral honeys with physico-chemical and chemometric analyses. Food Chemistry, 165, 181–190. doi:10.1016/j.foodchem.2014.05.033
- Kaškonienė, V., Maruška, A., Kornyšova, O., Charczun, N., Ligor, M., & Buszewski, B. (2009). Quantitative and qualitative determination of phenolic compounds in honey. Cheminėtechnologija, 52(3), 74–80.
- Khalil, M. L., & Sulaiman, S. A. (2010). The potential role of honey and its polyphenols in preventing heart disease: A review. African Journal of Traditional, Complementary & Alternative Medicines, 7(4), 315–321. doi:10.1016/j.foodcont.2007.11.008
- Kováčik, J., Grúz, J., Biba, O., & Hedbavny, J. (2016). Content of metals and metabolites in honey originated from the vicinity of industrial town Košice (eastern Slovakia). Environmental Science & Pollution Research, 23(5), 4531–4540. doi:10.1007/s11356-015-5627-8
- Liberato, M. D. C. T. C., Morais, S. M. D., Magalhães, C. E. D. C., Magalhães, I. L., Cavalcanti, D. B., & Silva, M. M. D. O. (2013). Physicochemical properties and mineral and protein content of honey samples from Ceará State, Northeastern Brazil. Food Science & Technology (Campinas), 33(1), 38–46. doi:10.1590/S0101-20612013000100007
- Majid, M., Younis, M. A., Naveed, A. K., Shah, M. U., Azeem, Z., & Tirmizi, S. H. (2013). Effects of natural honey on blood glucose and lipid profile in young healthy Pakistani males. Journal of Ayub Medical College Abbottabad, 25(3–4), 44–47.
- Malacalza, N. H., Caccavari, M. A., Fagúndez, G., & Lupano, C. E. (2005). Unifloral honeys of the province of Buenos Aires, Argentine. Journal of the Science of Food & Agriculture, 85(8), 1389–1396. doi:10.1002/jsfa.2105
- Manzanares, A. B., García, H., Galdón, B. R., Rodríguez, E. R., & Romero, C. D. (2014). Physicochemical characteristics of minor monofloral honeys from Tenerife, Spain. Food Science & Technology, 55, 572–578.
- Mato, I., Huidobro, J. F., Simal-Lozano, J., & Sancho, M. T. (2006). Analytical methods for the determination of organic acids in honey. Critical Reviews in Analytical Chemistry, 36(1), 3–11. doi:10.1080/10408340500451957
- Miguel, M. G., Antunes, M. D., & Faleiro, M. L. (2017). Honey as a complementary medicine. Integrative Medicine Insights, 12, 117863371770286–1178633717702869. doi:10.1177/1178633717702869
- Mondragón-Cortez, P., Ulloa, J. A., Rosas-Ulloa, P., Rodríguez-Rodríguez, R., & ResendizVázquez, J. A. (2013). Physicochemical characterization of honey from the West region of México. CYTA: Journal of Food, 11(1), 7–13. doi:10.1080/19476337.2012.673175
- Moniruzzaman, M., Chowdhury, M. A. Z., Rahman, M. A., Sulaiman, S. A., & Gan, S. H. (2014). Determination of mineral, trace element, and pesticide levels in honey samples originating from different regions of Malaysia compared to Manuka honey. Biomed Research International, 2014, 1. doi:10.1155/2014/359890
- Nanda, V., Singh, B., Kukreja, V. K., & Bawa, A. S. (2009). Characterisation of honey produced from different fruit plants of northern India. International Journal of Food Science & Technology, 44(12), 2629–2636. doi:10.1111/j.1365-2621.2009.02094.x
- Olofsson, T. C., Butler, È., Markowicz, P., Lindholm, C., Larsson, L., & Vásquez, A. (2016). Lactic acid bacterial symbionts in honeybees: An unknown key to honey's antimicrobial and therapeutic activities. International Wound Journal, 13(5), 668–679. doi:10.1111/iwj.12345
- Ouchemoukh, S., Louaileche, H., & Schweitzer, P. (2007). Physicochemical characteristics and pollen spectrum of some Algerian honeys. Food Control, 18(1), 52–58. doi:10.1016/j.foodcont.2005.08.007
- Özkök, A., Yüksel, D., & Sorkun, K. (2018). Chemometric evaluation of the geographical origin of Turkish pine honey. Food & Health, 4(4), 274–282. doi:10.3153/FH18027
- Pereira, D. M., Valentão, P., & Andrade, P. B. (2009). Organic acids of plants and mushrooms: Are they antioxidants. Functional Plant Science & Biotechnology, 3, 103–113.
- Scherer, R., Rybka, A. C. P., Ballus, C. A., Meinhart, A. D., Teixeira Filho, J., & Godoy, H. T. (2012). Validation of a HPLC method for simultaneous determination of main organic acids in fruits and juices. Food Chemistry, 135(1), 150–154. doi:10.1016/j.foodchem.2012.03.111
- Shamsudin, S., Selamat, J., Sanny, M., Abd. Razak, S. B., Jambari, N. N., Mian, Z., & Khatib, A. (2019). Influence of origins and bee species on physicochemical, antioxidant properties and botanical discrimination of stingless bee honey. International Journal of Food Properties, 22(1), 239–264. doi:10.1080/10942912.2019.1576730
- Shapla, U. M., Solayman, M., Alam, N., Khalil, M. I., & Gan, S. H. (2018). 5-Hydroxymethylfurfural (HMF) levels in honey and other food products: Effects on bees and human health. Chemistry Central Journal, 12(1), 35. doi:10.1186/s13065-018-0408-3
- Silva, L. R., Sousa, A., & Taveira, M. (2017). Characterization of Portuguese honey from Castelo Branco region according to their pollen spectrum, physicochemical characteristics and mineral contents. Journal of Food Science & Technology, 54(8), 2551–2561. doi:10.1007/s13197-017-2700-y
- Silva, L. R., Videira, R., Monteiro, A. P., Valentão, P., & Andrade, P. B. (2009). Honey from Luso region (Portugal): Physicochemical characteristics and mineral contents. Microchemical Journal, 93(1), 73–77. doi:10.1016/j.microc.2009.05.005
- Silva, T. M. S., dos Santos, F. P., Evangelista-Rodrigues, A., da Silva, E. M. S., da Silva, G. S., de Novais, J. S., … Camara, C. A. (2013). Phenolic compounds, melissopalynological, physicochemical analysis and antioxidant activity of jandaíra (Melipona subnitida) honey. Journal of Food Composition & Analysis, 29(1), 10–18. doi:10.1016/j.jfca.2012.08.010
- Soares, S., Amaral, J. S., Oliveira, M. B. P., & Mafra, I. (2017). A comprehensive review on the main honey authentication issues: Production and origin. Comprehensive Reviews in Food Science & Food Safety, 16(5), 1072–1100. doi:10.1111/1541-4337.12278
- Stevenson, A., Burkhardt, J., Cockell, C. S., Cray, J. A., Dijksterhuis, J., Fox-Powell, M., … Hallsworth, J. E. (2015). Multiplication of microbes below 0.690 water activity: Implications for terrestrial and extraterrestrial life. Environmental Microbiology, 17(2), 257–277. doi:10.1111/1462-2920.12598
- Suarez-Luque, S., Mato, I., Huidobro, J. F., Simal-Lozano, J., & Sancho, M. T. (2002). Rapid determination of minority organic acids in honey by high-performance liquid chromatography. Journal of Chromatography A, 955(2), 207–214. doi:10.1016/S0021-9673(02)00248-0
- Teucher, B., Olivares, M., & Cori, H. (2004). Enhancers of iron absorption: Ascorbic acid and other organic acids. The International Journal for Vitamin & Nutrition Research, 74(6), 403–419. doi:10.1024/0300-9831.74.6.403
- Tornuk, F., Karaman, S., Ozturk, I., Toker, O. S., Tastemur, B., Sagdic, O., … Kayacier, A. (2013). Quality characterization of artisanal and retail Turkish blossom honeys: Determination of physicochemical, microbiological, bioactive properties and aroma profile. Industrial Crops & Products, 46, 124–131. doi:10.1016/j.indcrop.2012.12.042
- Wapnir, R. A. (1998). Copper absorption and bioavailability. The American Journal of Clinical Nutrition, 67(5), 1054S–1060S. doi:10.1093/ajcn/67.5.1054S