
 ?Mathematical formulae have been encoded as MathML and are displayed in this HTML version using MathJax in order to improve their display. Uncheck the box to turn MathJax off. This feature requires Javascript. Click on a formula to zoom.
Abstract
In Sandstone, the pore complexity in certain rock types is not only related to the mineral constituents, but also to other tectonic properties, including texture and porosity. In sandstones, texture is a primary factor contributing to pore geometry and structure. This condition causes a distributed relationship between P-wave velocity and porosity, although a clear trend exists. The purpose of this research, therefore, was to study the effects of pore complexity with the variation of P-wave velocity on saturated rocks and its impact in estimating critical porosity. In addition, the concept of rock type and convergent point was applied to establish the correlation between saturated P-wave velocity with pore geometry, and pore structure. Subsequently, the data was grouped into several rock types, with each having its own empirical bond and also tends to intersect with others at a converging point. In conclusion, a very good relationship between saturated P-wave velocity and porosity was obtained by categorizing the rocks based on pore geometry and pore structure. However, the individual rock group is known to demonstrate similar pore geometry and specific critical porosity values.
1. Introduction
In rocks, certain parameters, including porosity and velocity are not independent and several studies have been conducted to define their relationship. In addition, literatures on the effect of pore complexity and the correlation between porosity and P-wave velocity appears inadequate. At low porosity, the relationship tends to be linear, but not the case for high values (Wyllie, Gregory, & Gardner, Citation1956). This assumes the pore complexity of rock is greatly influenced by the variation of P-wave velocity. For greater porosity, the relationship becomes nonlinear (Raymer, Hunt, & Gardner, Citation1980), while at zero porosity, the P-wave velocity achieves its maximum, further illustrating the velocity of minerals depends on the mineral type. Conversely, as the solid material decreases with increasing pore spaces, the velocity tends to become minimum. Other studies show the clay presence in rocks also influences P-wave velocity and the type of clay distribution demonstrates separate effects (Minear, Citation1982).
Apart from clay volume, pore shape also extends a dominant effect on P-wave velocity. More rounded pores (pore aspect ratio approaches 1) instigate further increase in P-wave velocity. Furthermore, clay volume is used to classify the relationship between velocity and porosity (Han, Nur, & Morgan, Citation1986). This indicates pore complexity due to available clay content, also affects velocity.
In terms of the effects of pore complexity, other factors, including pore geometry, texture and rock microstructure such as grain or matric supported, type and position of clay particles in pore spaces, is significantly considered (Khaksar & Griffiths, Citation2000), However, rocks with poor grain sorting show a more efficient grain arrangement (Gutierrez, Dvorkin, & Nur, Citation2001). This instigates stronger rock structure and increased P-wave velocity. For dry rock, the relationship between Vp/Vs and porosity, amongst others, is influenced by specific surface area (Fabricius, Baechle, Eberli, & Weger, Citation2007). Therefore, this relationship is probably attributed to the textural variations and porosity types. Simple textures tend to possess lower specific area (Sg) and higher Vp/Vs ratio at equal porosity. Xu and Payne (Citation2009) modeled the elastic properties of carbonate rocks by considering pore type. Inter-particle pore type, rounded stiff pore (moldic, intraframe, vug), and microcrack such as fracture, all presented various P-wave velocity effects. Meanwhile, the variation of P-wave velocity is strongly influenced by micro porosity, pores network complexity, and pore size (Weger, Eberli, Baechle, Massaferro, & Sun, Citation2009). Another phenomenon exists, where sedimentary and igneous rocks exhibited distinct pore characteristics and critical porosities (Nur, Mavko, Dvorkin, & Gal, Citation1995). However, the critical porosity is affected by rock mineral constituents and products of geological processes (Mavko, Mukerji, & Dvorkin, Citation2009).
In relation to rock quality, a correlation between acoustic wave velocity and permeability exists as data were grouped based on hydraulic units (Prasad, Citation2003). The hydraulic qualities are strongly influenced by the complexity of pore geometry and pore structure. However, porosity and permeability values are strongly affected by pore arrangement (Wibowo, Permadi, & Bandung, Citation2013). Pore geometry and pore structure are expressed as a combination of porosity and permeability. Subsequently, the pore complexity correlates effectively with dry P-wave velocity and is easily separated for each rock type (Prakoso, Permadi, & Winardhie, Citation2016). By applying the Nur’s concept (Nur et al., Citation1995), each group of rock type was observed with a specific critical porosity (Prakoso, Permadi, Winardhi, & Marhaendrajana, Citation2017).
In dry conditions, the pore space is possibly air-filled, and does not significantly affect the rock bulk modulus. For saturated rocks, fluids, including water, oil or gas are known to exist in the pore spaces. The rock bulk modulus is the combined bulk moduli of rock frame and fluid present in the pore spaces. For dry conditions, the rock type is characterized by specific critical porosity value, as earlier proven (Prakoso et al., Citation2017). However, the research is uncertain in applying the concept to fluid saturated rock conditions. This is important considering the reservoir conditions are saturated by fluid. Also, the pressure effect needs is deliberated in order to study the variation of P-wave velocity on reservoir rock quality under subsurface conditions. This paper, therefore, studies the effects of pore geometry and pore structure on variations of saturated P-wave velocity, where a non-linear relationship between porosity and saturated P-wave velocity is further analyzed. The results potentially grouped the rock using well data such as sonic and porosity logs.
2 Methods and data
2.1. Data used
Two data sets from 2 separate basins, including 117 core data from North West Java and 129 core data from Kutai were analyzed in this study. Data set 1 is sandstone from upper Cibulakan formation, aged early Miocene to middle Miocene, and is deposited at the subsidence/uplift phase. The reservoir rocks, generally, are shallow marine deposits of tidal plains, and are related to quartz sandstone with glauconite or massive quartz sandstone. All core samples are composed of quartz-dominated minerals. The available parameters include porosity, permeability, Vp and Vs. Data set 2 was obtained from Kutai basin. These core data were acquired from Balikpapan formation. The age of Balikpapan formation is from middle to late Miocene. Sandstone were deposited on deltaic system and associated with fluvial deposits, distributary channels, and mouth bars. In addition, the lithology is dominated by fine grain up to thick coarse grain sandstone deposited alternately with claystone, and shale. Quartz is the major mineral for the entire sample. The data used include porosity, permeability, and P and S wave velocities. Porosity and permeability are measured in the laboratory using standard procedures adopted in the petroleum industry, while wave velocities are evaluated at dry and ambient conditions.
2.2. Fluid substitution and critical porosity
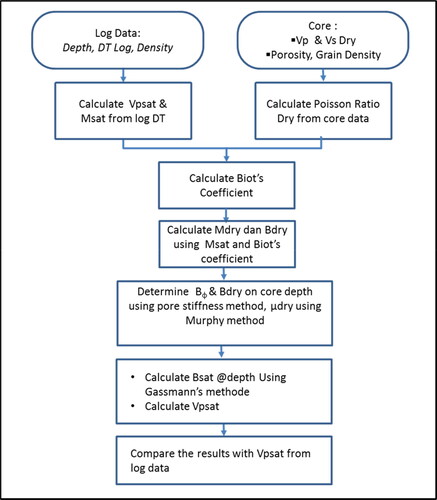
Velocity data were determined in the laboratory for dry conditions, as fluid substitution is necessary. The Gassmann's method was applied to estimate saturated P-wave velocity. This condition has been widely employed for fluid substitution of dry (Vpdry) and saturated P-wave velocity (Vpsat) (Gassmann, Citation1951). In this study, the conversion from Vpdry to Vpsat was conducted by assuming the water is used to saturate the pore space. In addition, the P-wave velocity data were measured at atmospheric pressure, hence the need for accurate pressure. A work flow for correcting Vp as a result of changes in pressure was proposed. The influence of the pressure is by using the pore space stiffness method. In addition, the pore space stiffness constant (t) was calculated using available compressional sonic log (DTp) data. Furthermore, the required data for converting dry P-wave velocity (Vpdry) to saturated P-wave velocity (Vpsat) include:
Core data: Vpdry, Vsdry, porosity and grain density.
Log data: Depth, compressional sonic log (DTp), and density log (Rhob).
Two factors are considered in converting dry (Vpdry) to saturated P-wave velocity (Vpsat) as follows:
Effect of fluid saturation is estimated using the Gassmann’s method (Gassmann Citation1951).
Effect of pressure is considered using the pressure-velocity dependency approach substituted with the pore space stiffness method.
Several assumptions used in this approach comprise:
The effect of pressure on porosity is less (constant porosity)
Pore pressure is constant.
The mineral constituent of rock is dominated by quartz and water is known to saturate the pore spaces.
Bulk mineral and bulk fluid moduli are assumed constant (B quartz and B water).
The effect of pressure on Vp and Vs is equal, hence the Poisson ratio value is assumed constant.
Therefore, the factors influencing the change of Bdry are only Bpor.
Medium non -dispersion.
The flow chart of saturated P-wave velocity (Vpsat) calculation is shown in .
Figure 1. Flow chart of saturated P-wave velocity calculation.
As previously reported, varying rock lithology showed separate pore space characteristics (Nur et al., Citation1995). Texture, mineralogy and the diagenetic process are the primary factors determining the critical porosity magnitude. (Mavko et al., Citation2009). However, critical porosity is the boundary of the consolidated sediment domain with the suspension. Nur equation is possibly applied to estimate critical porosity (Nur et al., Citation1995). The equation is a modification of the Voigt Bound (Voigt, Citation1890) equation as follows:
(1)
(1)
For fluid saturated rock, the influence of fluid bulk modulus is considered, as EquationEquation (1)(1)
(1) is written as follows:
(2)
(2)
where B bulk modulus, Bm mineral bulk modulus, Bm fluid bulk modulus, ϕ porosity, and ϕc critical porosity.
Several studies reported similar lithology with varying pore complexities. This variation causes rocks to exhibit distinct fluid flow capabilities. Based on Nur’s critical porosity, assuming each rock group with similar pore pattern does not change, the individual group appears to have its own critical porosity value.
2.3. Rock type approach
Pore complexity is one of the main factors influencing the rocks in order to permit fluid flow. In addition, a rock sample with similar pore complexity shows the capability to flow fluid differently compared to others. In relation to the pore complexity, each data in a group is known to have similar relationship between pore geometry and pore structure (Wibowo et al., Citation2013). Rocks with equal deposition and diagenesis tend to acquire similar pore architecture. This was also pointed out by El-Khatib (Citation1995), and Leverett (1941), where the similarity of the capillary pressure curve profile indicates the similarity in pore size distribution (Burdine, Gournay, & Reichertz, Citation1950). The comparison of the pore architecture shows the rocks possessed similar value of pore shape factor (Fs) and tortuosity (τ). Furthermore, the combination of pore shape factor (Fs) and tortuosity (τ) is widely known as Kozeny's constant (Kozeny, Citation1927). Assuming for capillary tube the Kozeny equation is arranged as follows:
(3)
(3)
Hydraulic radius (k/ϕ)0.5 in EquationEquation (3)(3)
(3) is equivalent to the Kozeny constant, and is express as pore size. Based on EquationEquation (3)
(3)
(3) , Wibowo et al., Citation2013 confirms the relationship of pore geometry and pore structure for rock type estimation. The relationship is expressed in terms of power law equations (EquationEquation (4)
(4)
(4) ).
(4)
(4)
Constant (a) denotes the pore efficiency, while (b) represents the exponent of the pore structure. For smooth capillary tube, the maximum value b value is 0.5. Lesser value of pore structure exponent (b) indicates complex pore arrangement for low quality rock type. The plot between (k/ϕ)0.5 and (k/ϕ3) on log-log scale produces a straight line and the maximum slope of line b is approximately 0.5. Furthermore, lower values of pore structure exponent (b), generates inferior rock type quality with reduced pore efficiency (Ep). Each group of sample data forms a straight-line trend and describes the similarity of the pore architecture resulting from related geological process.
Rock quality is largely determined by pore complexity, believed to be the relationship between two pore parameters, termed pore geometry (k/ϕ)0.5 and pore structure (k/ϕ3). In addition, the relationship is known as the power law model (Wibowo et al., Citation2013). In this study, the concept of power law was applied to define pore geometry (k/ϕ)0.5 and pore structure (k/ϕ3). These two parameters are used to characterize groups of rocks with similar pore arrangement. Section 2.2 states rocks with equal pore complexity are described by the similarity in pore geometry and pore structure. In addition, the rock group acquires its own critical porosity. This study combines the concepts of critical porosity and power law to define the relationship of pore geometry, pore structure, and rock quality with acoustic wave velocity. However, the relationship is used to explain the scatter data on the relationship between P-wave velocity and porosity. Power law is used to characterize groups of rocks with similar quality and its relation to critical porosity.
3. Results and discussion
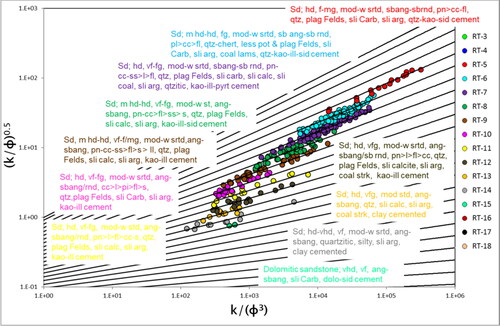
3.1. Rock type identification
The rock type chart, based on power law model (Wibowo et al., Citation2013), is used to identify the rock type. shows the resulting data is grouped into several rock types, where each is characterized similarly to the microscopic geological feature. Rock textures are the dominant factors influencing the rock group. Generally, good quality rock type is dominated by large grain size, proper sorting and low hardness, as well as being further characterized by clean sandstone. Conversely, low quality rock type tends to acquire lower grain size, poor sorting, large hardness, and high clay volume.
Figure 2. Rock type identification.
3.2. Effect of pore complexity on pore space stiffness and saturated P-Wave velocity estimation
Gutierrez et al. (Citation2001) and Fabricius et al. (Citation2007) reported the pore rigidity is influenced by pore architecture. Therefore, the pore space stiffness constant (t) is affected by pore complexity, and is estimated by using Bdry obtained from DTp and DTs log data. As no DTs data exist, Bdry is not possibly generated by Gassmann's fluid substitution method. However, Bdry was derived using Poisson ratio and Biot’s coefficient. Gregory (Citation1977) provided steps to apply Mdry in order to acquire Bdry in the condition of a known value in terms of dry rock Poisson’s ratio. The assumption used is non-dispersion medium, where the difference in frequency of measurement Vp from core and Vp from log, does not instigate velocity change.
and demonstrate the pore stiffness (t) is influenced by pore geometry and pore structure. A suitable quality rock type relatively possess simple pore geometry and pore structure with the tendency of high variation of pore stiffness (t) obtained from core and log compared to low quality rock types (). These phenomena are due to sufficient rock type with large grain size. Therefore, the cement is dominated by clay minerals, low clay volume and low hardness with significant pressure effect on changes in bulk modulus. Meanwhile, in low quality, the rock tends to be more solid, characterized by small grain size, complex pore geometry, pore structure, calcite dominated cement, large clay volume, and high hardness, therefore increasing pressure does not result to significant impact with changes in bulk modulus.
Figure 3. Constant pore space stiffness curve.
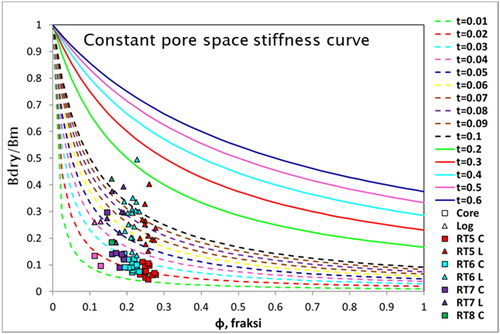
Figure 4. Relationship of pore space stiffness versus porosity.
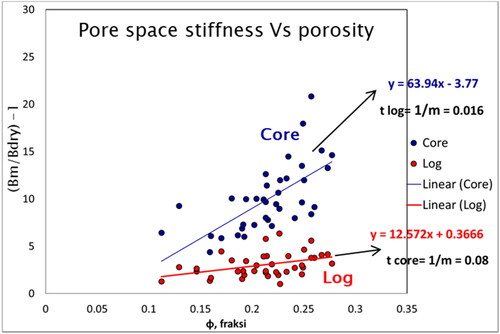
shows the linear relationship between Bm/Bdry-1 and porosity. Based on , the slope represents m = 1/t and the value of pore space stiffness constant is t = Bϕ/Bm. Therefore, Bϕ is estimated based on the value of m and t.
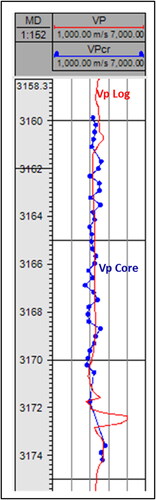
The result of calculating Vpsat compared to Vpsat is obtained from log data (). This shows the Vpsat value using the above method is relatively close to Vpsat data from log. Therefore, the pore stiffness method and Gassmann's are useful to evaluate the effect of pressure and fluid on the P-wave velocity.
Figure 5. Comparison of Vp calculation and Vp measurement.
3.3. The relationship of Vpsat with pore geometry (k/ϕ)0.5 and pore structure (k/ϕ3)
The pore geometry is approximated by combining porosity and permeability (Wibowo et al., Citation2013). In addition, the parameter is written as (k/ϕ)0.5, where (k/ϕ)0.5 value is equal to pore diameter, derived from the Kozeny equation (Kozeny, Citation1927). Moreover, the relationship between Vpdry, (k/ϕ)0.5 and (k/ϕ3), is classified into several rock types (Prakoso et al., Citation2016). In a particular rock type, larger hydraulic radius (k/ϕ)0.5 and simpler pore structure (k/ϕ3) tend to increase Vpdry. As the empirical correlation lines are drawn for each unit, a convergent point is established. This indicates all porous media, at this convergence point, possessed indistinguishable property, including wave velocity.
The approach is applied to confirm the relationship between Vpsat pore geometry (k/ϕ)0.5, and pore structure (k/ϕ3). Furthermore, the relationship between Vpsat and (k/ϕ)0.5 is clearly described. Without grouping into rock types, larger scattered data are observed. However, the relationship shows Vpdry increases as (k/ϕ)0.5 declines.
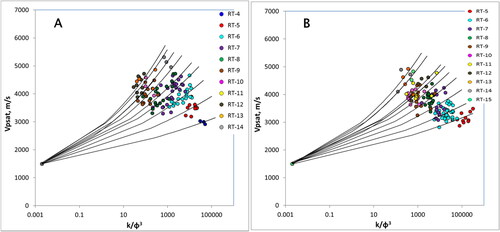
Assuming very small capillary tube with porosity value 1, then the measured P-wave velocity appears to cover the fluid’s pore spaces. By suggesting saturated condition, water acts as the fluid in the pore spaces. Moreover, the convergence point of the relationship between Vpsat, (k/ϕ)0.5 and (k/ϕ3) is possibly determined. Therefore, empirical correlation lines between Vpsat on (k/ϕ)0.5 or k/ϕ3 commences from the convergence point at (Vpsat, (k/ϕ)0.5) = (1496.7, 0.045) or (Vpsat, k/ϕ3) = (1496.7, 0.002). This point is employed as the starting point for drawing empirical regression line on each rock type ( and ).
Figure 6. Regression line of Vsat vs. (k/ϕ)0.5 for data set 1 (A) and set data 2 (B).
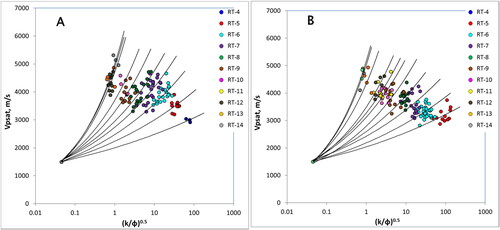
Figure 7. Regression line of Vsat vs. (k/ϕ3) for data set 1 (A) and set data 2 (B).
3.4. Effect of pore complexity on relationship of Vpsat with porosity and critical porosity
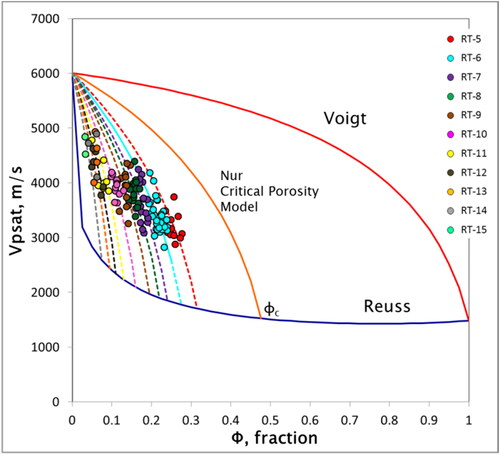
and show for saturated rock, the relationship between porosity and Vpsat is grouped based on rock type. Furthermore, Vpsat theoretical curves (dash line) are obtained by using critical porosity model (Nur et al., Citation1995) for each rock type using different critical porosity values. The relationship between porosity and Vpsat is also distinguished based on rock type ( and ), with each rock type having different critical porosity values. The value of critical porosity is obtained from the intersection of Nur’s theoretical curve with Reuss curve (Reuss, Citation1929). Improved quality rock type has larger critical porosity values compared to poorer quality rock type. Based on and , each rock type is represented by 1 Nur’s critical porosity curve and each rock type are characterized by a critical porosity value. Furthermore, the presence of fluid in pores and pressure show an effect on increasing P-wave velocity. However, the condition does not change the relationship pattern between porosity and Vpsat.
Figure 8. Plot Vpsat versus porosity (dashed line is Vpsat theoretical curves) for data set 1.
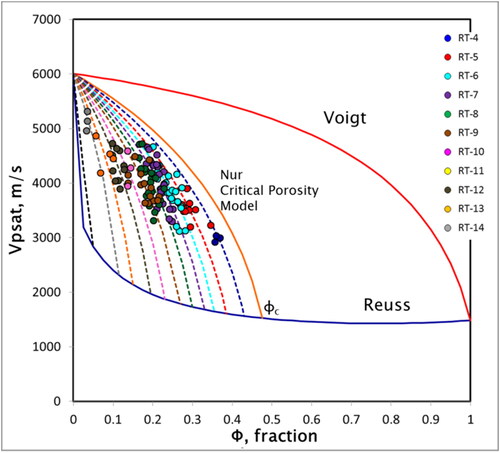
Figure 9. Plot Vpsat versus porosity (dashed line is Vpsat theoretical curves) for data set 2.
4. Conclusions
Several conclusions are drawn from this research including:
Grouping the rock samples based on rock quality provides more detailed description on the effects of pore attributes on P-wave velocity variation.
The relationship between Vpsat and porosity is clearly distinguished on similarities observed in the correlation between pore geometry and pore structure. This indicates the variation of P-wave velocity is greatly influenced by both parameters.
The relationship between Vpsat and porosity shows the critical porosity is affected by pore geometry. This causes critical porosity to vary for each rock type. Rock type with enhanced pore quality demonstrates greater critical porosity compared to lower quality rock type.
Vpsat estimation using the combining pore stiffness method and Gassmann’s fluid substitution provides an accurate result, and is relatively closer to the Vpsat value from log data.
Open Access This article is distributed under the terms of the Creative Commons Attribution 4.0 International License http://creativecommons.org/licenses/by/4.0/), which permits unrestricted use, distribution, and reproduction in any medium, provided you give appropriate credit to the original author(s) and the source, provide a link to the Creative Commons license, and indicate if changes were made.
Acknowledgments
The author is grateful to PPPTMGB "Lemigas" and the Geophysics Laboratory Faculty of Earth and Energy Technology, Universitas Trisakti for data provision and also to SonicViewer for supporting with tools needed to effectively perform this research.
Disclosure statement
No potential conflict of interest was reported by the author(s).
References
- Burdine, N., Gournay, L., & Reichertz, P. (1950). Pore size distribution of petroleum reservoir rocks. Journal of Petroleum Technology, 2(7), 195–204. doi:10.2118/950195-G
- El-Khatib, N. (1995). Development of a modified capillary pressure J-function. In: SPE, pp. 547–562 doi:10.2118/29890-MS
- Fabricius, I. L., Baechle, G., Eberli, G. P., & Weger, R. (2007). Estimating permeability of carbonate rocks from porosity and vp∕vs. Geophysics, 72(5), E185–E191. doi:10.1190/1.2756081
- Gassmann, F. (1951). Über die Elastizität poröser Medien. Vierteljahrsschrift Der Naturforschenden Gesellschaft Zürich, 96, 1–21. doi:https://doi.org/10.1017/CBO9781107415324.004
- Gregory, A. R. (1977). Aspects of rock physics from laboratory and log data that are important to seismic interpretation. In: Memoir 26: Seismic stratigraphy: Applications to hydrocarbon exploration (pp. 14–46). The American Association of Petroleum Geologists Bulletin.
- Gutierrez, M., Dvorkin, J., & Nur, A. (2001). Textural sorting effect on elastic velocities, part I: Laboratory observations, rock physics models, and applications to field data. In: Society exploration geophysics, Int’l exposition and annual meeting. SEG. pp. 1760–1763.doi:10.1190/1.1816465
- Han, D., Nur, A., & Morgan, D. (1986). Effects of porosity and clay content on wave velocities in sandstones. Geophysics, 51(11), 2093–2107. doi:10.1190/1.1442062
- Khaksar, A., & Griffiths, C. (2000). Effects of porosity and clay content on P- and S-wave velocities in cooper basin sandstones. Exploration Geophysics, 31(1/2), 433–440. doi:10.1071/EG00433
- Kozeny, J. (1927). Über kapillare Leitung des Wassers im Boden. Akad WissWien, 136, 271–306.
- Leverett, M. C. (1941). Capillary Behavior in Porous Solids. Transactions of the AIME, 142(01), 152–169. doi:10.2118/941152-G
- Mavko, G., Mukerji, T., & Dvorkin, J. (2009). The rock physics handbook (2nd ed.). New York: Cambridge University Press.
- Minear, J. W. (1982). Clay models and acoustic velocities. In: SPE Annual technical conference and exhibition doi:10.2118/11031-MS
- Nur, A. M., Mavko, G., Dvorkin, J., & Gal, D. (1995). Critical porosity: The key to relating physical properties to porosity in rocks. SEG Technical Program Expanded Abstract, 878–881. doi:10.1190/1.1887540
- Prakoso, S., Permadi, P., & Winardhie, S. (2016). Effects of pore geometry and pore structure on dry P-wave velocity. Modern Applied Science, 10(8), 117. doi:10.5539/mas.v10n8p117
- Prakoso, S., Permadi, P., Winardhi, S., & Marhaendrajana, T. (2017). Dependence of critical porosity on pore geometry and pore structure and its use in estimating porosity and permeability. Journal of Petroleum Exploration and Production Technology, 8, 431–444. doi:10.1007/s13202-017-0411-6.
- Prasad, M. (2003). Velocity‐permeability relations within hydraulic units. Geophysics , 68(1), 108–117. doi:10.1190/1.1543198
- Raymer, L. L., Hunt, E. R., & Gardner, J. S. (1980). An Improved Sonic Transit Time-to-Porosity Transform. SPWLA Annual Logging Symposiyum, 1–13.
- Reuss, A. (1929). Berechnung der Fließgrenze von Mischkristallen auf Grund der Plastizitätsbedingung für Einkristalle. ZAMM - Zeitschrift für Angewandte Mathematik und, 9(1), 49–58. doi:10.1002/zamm.19290090104
- Voigt, W. (1890). Bestimmung der Elasticit??tsconstanten des brasilianischen Turmalines. Annalen der Physik und Chemie, 277(12), 712–724. doi:10.1002/andp.18902771205
- Weger, R. J., Eberli, G. P., Baechle, G. T., Massaferro, J. L., & Sun, Y.-F. (2009). Quantification of pore structure and its effect on sonic velocity and permeability in carbonates. AAPG Bulletin, 93(10), 1297–1317. doi:10.1306/05270909001
- Wibowo, A. S., Permadi, P., & Bandung, I. T. (2013). A type curve for carbonates rock typing. In: International Petroleum Technology Conference, pp. 26–28 doi:10.2523/IPTC-16663-MS
- Wyllie, M. R. J., Gregory, A. R., & Gardner, L. W. (1956). Elastic wave velocities in heterogeneous and porous media. Geophysics, 21(1), 41–70. doi:10.1190/1.1438217
- Xu, S., & Payne, M. A. (2009). Modeling elastic properties in carbonate rocks. The Leading Edge , 28(1), 66–74. doi:10.1190/1.3064148
- Zimmerman, R. W. (1992). Compressibility of sandstones. Elsevier Science Publishers B.V.
Appendix A
Calculation of saturated P-wave velocity used the following procedure:
Calculate Poisson ratio from Vpdry and Vsdry core.
(A.1)
S calculation based on Poisson ratio obtained from Vpdry and Vsdry core (Equation (A1)).
Calculate saturated modulus (Msat) by using Vpsat obtained from compressional sonic log (DTp) data.
Calculate Biot coefficient (β) based on S and Msat value using Equations (A.2) and (A.3).
Mdry calculation based on Msat, which is obtained from compressional sonic log (DTp) data (EquationEq. (A.3)
Furthermore, Bdry from log data can be calculated by using following equation:
Dry rock pore space compressibility equation on constant pore pressure (Zimmerman, Citation1992) can be written as follows:
Equation (A8) is can be arrangged into linear equation as follow:
EquationEquation (A.10)
The value of Bϕ obtained from previous step then used to calculate Bdry @P log.
@P log notation is used to state the depth of sample data based on data log depth reference.
µdry @P log value is obtained by using Murphy et.al (1993) equation, as in the following:
µdryinsitu and Bdryinsitu are obtained from calculation by using Vpdry and Vsdry from core sample measurement.
Bsat@P log is calculated by using the Gassmann’s equation as follows:
µdry = µsat, furthermore Vpsat@P log can be calculated by using following equation: