
Abstract
This study explores the impact of chronic caffeine intake on collagen deposition in long bones and correlates it with morphometric and metabolic alterations in Wistar rats. Animals had either regular drinking water (Control group) or caffeinated drinking water in a 300 mg/L dose (Caffeine group) for 12 wk. Using Picro-Sirius red collagen staining, cortical (78.07 ± 1.27 vs 82.12 ± 1.22) and trabecular (74.29 ± 1.09 vs 77.97 ± 1.03) collagen percentages in the caffeine group were markedly (p = 0.0448 and p = 0.0351; respectively) lower than the control group. Caffeine intake induced apparent alterations in the microstructure of cortical diaphysis and femoral head trabecular density as determined by micro-CT. In caffeinated animals, levels of bone-related metabolic biomarkers including BALP (1.41 ± 0.06 vs 1.12 ± 0.07), CTX (313.5 ± 20.78 vs 224.3 ± 27.19), DPD (11.61 ± 0.72 vs 9.26 ± 0.62), BGP (10.35 ± 0.43 vs 9.14 ± 0.34), and TRAP (4.34 ± 0.08 vs 4.01 ± 0.11) were increased (p = 0.0136, p = 0.0262, p = 0.0343, p = 0.0571, and p = 0.0461; respectively) as compared to control animals. Except for BALP (p = 0.0175) and DPD (p = 0.0423), the Pearson correlation between collagen bone deposition and microstructures and metabolic changes was not statistically significant. Collectively, chronic caffeine consumption restricts cortical and trabecular collagen deposition in long bones leading to microstructure and metabolic alterations.
Introduction
The ingestion of daily beverages that contain caffeine is ubiquitous. Caffeine is considered one of the most widely consumed compounds in several forms such as coffee, soft drinks, tea, medications, and diet. The daily consumption rate of caffeine in adults usually ranges between 40 mg to 150 mg. However, the maximum concentration that is recommended by Food and Drug Administration (FDA) for caffeine daily consumption is 400 mg of caffeine per day in healthy adults (FDA, Citation2018). Daily ingestion of higher doses of caffeine is associated with multiple physiological and psychological adverse effects. In this context, multiple conflicting results were yielded about the impact of caffeine on bone health and osteoporosis risk. For example, studies have argued that caffeine is considered a minimal risk factor for bone loss and fractures (Asoudeh, Bagheri, Larijani, & Esmaillzadeh, Citation2022). A moderate daily intake of caffeine could be considered safe for bone health (Liu et al., Citation2012). On the other hand, more studies have reported that caffeine might harm bone mineral density and augment the fracture risk in the hips (Berman, Honig, Cronstein, & Pillinger, Citation2022). Experimental studies also demonstrated that caffeine might exacerbate bone resorption (Dal-Fabbro et al., Citation2021) and delay bone healing (Ferreira Bastos et al., Citation2014). Caffeine intake was associated with major skeletal side effects such as loss of bone calcium content and diminished bone density and volume, which might retard the process of bone healing (Lacerda et al., Citation2010). In vitro studies revealed that caffeine can harm the bone-forming cells (osteoblasts) and, consequently, can decrease vitamin D receptor expression, bone mineralization, and formation of the extracellular matrix (Rapuri, Gallagher, & Nawaz, Citation2007). Caffeine also may suppress rat bone marrow-derived mesenchymal stromal cells, which might restrict osteogenesis and bone mass (Zhou et al., Citation2010).
During bone formation, osteoblast plays a significant role in generating extracellular matrix and osteoid mineralization. This mineralized matrix consists mainly of 40% organic molecules and 60% inorganic compounds (Lin, Patil, Gao, & Qian, Citation2020). Collagen is considered the most abundant forming molecule in the bone organic matrix that functions as a mechanical support and scaffold for bone cells. Collagens are produced by bone marrow stromal cells during the mineralization process (Lin et al., Citation2020; Viguet-Carrin, Garnero, & Delmas, Citation2006). Thus, it is considered a strong marker for bone strength. Several types of collagens are present in the bone matrix including type I and III. Furthermore, studies showed that collagen regulates the osteogenic process by stimulating the progenitors of osteoblasts and initiating their differentiation (Elango et al., Citation2019). Though, studies have disclosed that mice with collagen deficiency had altered bone mass due to impaired osteoblastic differentiation and function (Volk et al., Citation2014). Accordingly, it can be anticipated that disturbing the collagen deposition in the bone organic matrix would cause deleterious consequences on bone health and mineralization.
The antifibrotic action of caffeine has been proposed in different studies by reducing the deposition of collagen during several pathological conditions in multiple organs (Tatler et al., Citation2016; Vargas-Pozada et al., Citation2022; Wang et al., Citation2015). Notably, caffeine treatment downregulated the gene expressions of type II and X collagens in primary rat chondrocytes (Choi, Choi, Kim, Bae, & Roh, Citation2017) and reduced the expression of type I collagen in rat bone mesenchymal stem cells leading to inhibited osteogenic properties (Reis et al., Citation2016; Zhou et al., Citation2010). Although, caffeine intake during pregnancy resulted in animals neonates expressing osteoblasts with higher type I collagen and mineralization (Reis, Ribeiro, Ocarino, Goes, & Serakides, Citation2015), older study showed that caffeine inhibits total collagen levels in primary osteoblastic cell culture (Tassinari, Gerstenfeld, Stein, & Lian, Citation1991). Therefore, the present study was designed to evaluate the influence of chronic caffeine consumption on the deposition of collagen in long bones and to correlate this impact with bone-related morphometric and metabolic changes in Wistar rats.
Materials and methods
Ethics and animals
In this study, 4 wk-old healthy female Wistar albino rats (weighing approximately 100-120 grams) without genetic modifications were used. Animals were generously provided by the experimental animal house at Imam Abdulrahman Bin Faisal University (IAU). The experimental conditions of this study included a pathogen- and stress-free the environment at, humidity of 50%, housing temperature of 23 ± 2 °C, 12/12 h as a light-dark cycle, and free access to food and drinking water during the whole experimental duration. The ethical guidelines described in the National Institute of Health (NIH) Guide for the Care and Use of Laboratory Animals (8th edition-2011) along with ARRIVE guidelines were followed. An ethical certification was granted to the protocol of this experiment by the institutional review board at IAU (IRB # 2019-02-137).
Study design
The experimental animals were allocated into two groups (n = 6) using simple randomization technique. Each group was placed in a single plastic transparent cage. Animal cages were prelabeled to minimize the confounder potential. Caffeine (Toronto Research Chemicals, North York, ON, Canada) was dissolved in the drinking water in a 300 mg/L dose (Martinez et al., Citation2018) and administered to six animals for 12 wk. The other six animals with regular drinking water were considered as a control group. At the end of the 12th week, all animals were anesthetized by inhaled sevoflurane (Sevorane, Aesica Queenborough Ltd. Queenborough, Kent, UK) using a Sigma Delta Vaporizer (Penlon Ltd., Abingdon, UK). The total blood (via cardiac puncture) and femoral bone samples were collected. Blood tubes were centrifuged at 4000 RPM for 10 min to obtain the serum. Femoral bone samples were cleaned from muscles and extra tissues and preserved in 10% formalin for further analysis. Samples from all the twelve participating animals were included in analysis of this study i.e. none of the animals was excluded by the end of the study.
Determination of collagen expression
After fixation in 10% neutral buffered formalin solution, the femoral bones from each group were decalcified in Shandon TBD-1 decalcification solution (Thermo Scientific, Waltham, MA, USA) for three days. Next, the decalcified bones were processed for embedding in paraffin blocks. Using a microtome (Accu-Cut® SRM™ 200 rotary, Sakura Finetek Inc., Torrance, CA, USA), theses blocks were sectioned into 5 µm sections. These sections were subjected to deparaffinization and hydration in xylene, descending ethanol concentrations, and distilled water. The Picro-Sirius red staining procedure followed the manufacturer instruction (Hello Bio, Bristol, UK). In brief, the Picro-Sirius red stain were added to sections on glass slides for 1 h at room temperature. After this, the stained slides were rinsed by acidic water (diluted acetic acid) and absolute alcohol solutions. The slides were mounted and examined blindly under a fluorescent microscope (Nikon Eclipse Ts2R, Nikon Instruments Inc., Melville, NY, USA) as described by Licini et al. (Citation2022). The captioned high-resolution image of each sample was analyzed in the ImageJ 1.53v software (National Institutes of Health, Bethesda, MD, USA). Two regions of interest (ROIs) were manually selected from each image at the femoral head and middle femoral diaphysis. After setting the image scale, the mean collagen percentage (red fluorescence) of random three 200 µm × 200 µm areas were analyzed in each ROI by the color histogram adds-in.
Determination of bone morphometric microstructure
Femoral bones were scanned using a micro computerized tomography (CT) scanner (SkyScan 1172, Bruker micro-CT, Kontich, Belgium) under the following conditions: a slice thickness of 0.014 mm, voltage of 100 kV, and electrical current of 100 μA. The developed three-dimensional (3D) images were reconstructed and analyzed blindly using NRecon software and CTAn software; respectively (Bruker micro-CT, Kontich, Belgium). The same two ROIs were selected as in the previous collagen expression method. The femoral head trabecular areas were selected manually, while middle femoral diaphysis areas (mainly cortical bones) were selected as 50 slices starting 1000 slices from the growth palate of the proximal femur. The following morphometric parameters were calculated in the first ROI (trabecular bone): trabecular bone mineral density (Tb BMD; g/cm3), bone volume fraction (BV/TV; %), trabecular number (Tb.N; 1/mm), trabecular separation (Tb.Sp; mm), and trabecular thickness (Tb.Th; mm). In the second ROI (cortical bone), the following morphometric parameters were assessed cortical bone mineral density (Ct BMD; g/cm3), bone volume fraction (BV/TV; %), cortical cross section area (CSA; mm2), and cortical thickness (Ct.Th; mm).
Determination of bone-related metabolic biomarkers
The serum levels of bone specific alkaline phosphatase (BALP), C-terminal telopeptide of type I collagen (CTX), deoxypyridinoline (DPD), bone gla-protein (BGP), and tartrate-resistant acid phosphatase (TRAP) were measured using enzyme-linked immunosorbent assay (ELISA) technique according to the manufacturer described method in each kit. The rat specific ELISA kits were purchased from Biotang Inc. (Lexington, MA, USA).
Statistical and correlation analysis and graphing
Arithmetical data was described in the form of Mean ± standard deviation (SD). The statistical difference between the two groups was analyzed by unpaired t test after assessing the data normality with the Shapiro-Wilk test. Significance was considered when the calculated P value was less than or equal to 0.05 (p ≤ 0.05). Graph Pad Prism software (version 5, La Jolla, CA, USA) was employed for the analysis and graphs production. Pearson correlation was used to assess the association between different numerical variables. Pairwise heatmaps were conducted by Heatmapper.ca (Wishart Research Group, University of Alberta, Ottawa, Canada) (Babicki et al., Citation2016). G*Power (version 3.1.9.4) was used for sample size calculation following previous study with similar primary outcomes (Sasso et al., Citation2015). Calculation conditions were as follows: difference between two independent means (2 groups), 0.3 effect size (d), 0.05 alpha (α) error probability, and 0.8 power (1-β).
Results
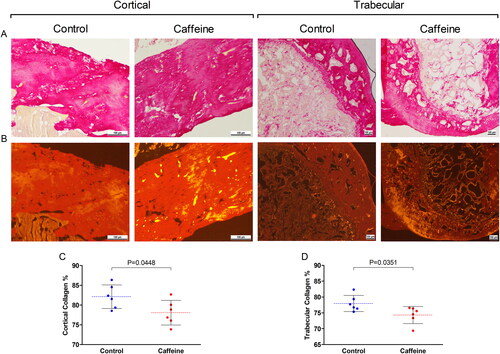
Images of the Picro-Sirius red stained sections demonstrated that caffeine group had lower presentation of collagen-related birefringence (red-orange) within the two ROIs as compared to the control group (). The color histogram analysis revealed aligned findings. The collagen deposition in caffeine group was significantly (p = 0.0448) reduced in the cortical bone area in middle femoral diaphysis as compared to the control group (). Likewise at the femoral head trabecular bone, the collagen percentage in caffeine group was significantly (p = 0.0351) lower than in the control group ().
Figure 1. Collagen expression in the middle femoral diaphysis (cortical) and the femoral head (trabecular). (A) brightfield and (B) Fluorescence images of Picro-Sirius red stained cortical (×100) and trabecular (×40) bones from the two groups (scale bar = 100 μm). (C & D) Scattered dot plot for the cortical and trabecular collagen percentage (%) in each group. The dashed line represents the mean of each group and error bars represent the SD. Numerical data was presented in the form of mean ± SD. The statistical difference between the two groups was analyzed by unpaired t test. Significance was considered when p ≤ 0.05.
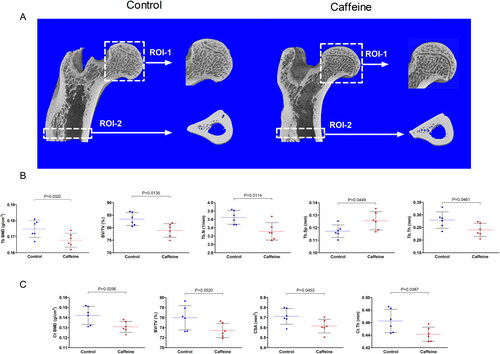
The 3D generated images showed marginally reduced trabecular and cortical bone volume at the assessed ROIs in caffeine group as compared to the control group (). The quantified bone morphometric microstructure parameters by the micro-CT were altered by caffeine treatment. The caffeine group had significantly lower Tb BMD (p = 0.0322), BV/TV (p = 0.0135), Tb.N (p = 0.0114), and Tb.Th (p = 0.0461), while significantly higher Tb.Sp (p = 0.0449), in the femoral head trabecular bone as compared with the femoral head trabecular bone samples from control animals (). Likewise, the cortical bone region showed reduced Ct BMD (p = 0.0256), BV/TV (p = 0.0520), CSA (p = 0.0453), and Ct.Th (p = 0.0387) by caffeine at the middle femoral diaphysis region as compared to the control animals ().
Figure 2. Micro-CT Scanning and analysis of the middle femoral diaphysis (cortical) and the femoral head (trabecular). (A) 3D micro-CT scans of two randomly selected samples from the two groups showing two ROIs at the femoral head (ROI-1) and middle femoral diaphysis (ROI-2). (B) Scattered dot plot for the trabecular morphometric microstructure parameters in ROI-1 in each group including: trabecular bone mineral density (Tb BMD; g/cm3), bone volume fraction (BV/TV; %), trabecular number (Tb.N; 1/mm), trabecular separation (Tb.Sp; mm), and trabecular thickness (Tb.Th; mm). (C) Scattered dot plot for the cortical morphometric microstructure parameters in ROI-2 in each group including cortical bone mineral density (Ct BMD; g/cm3), bone volume fraction (BV/TV; %), cortical cross section area (CSA; mm2), and cortical thickness (Ct.Th; mm). the dashed line represents the mean of each group and error bars represent the SD. Numerical data was presented in the form of mean ± SD. The statistical difference between the two groups was analyzed by unpaired t test. Significance was considered when p ≤ 0.05.
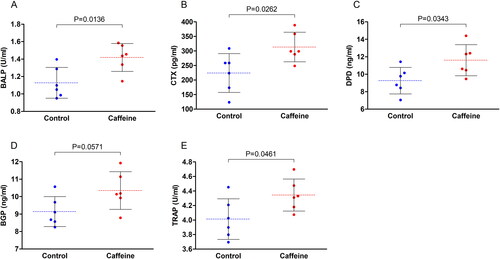
The serum levels of bone-related metabolic biomarkers were also altered by caffeine consumption for 12 wk. There was a significant increase in the levels of BALP (p = 0.0136), CTX (p = 0.0262), DPD (p = 0.0343), BGP (p = 0.0571), and TRAP (p = 0.0461) in the serum samples from the caffeinated animals as compared to the control animals ().
Figure 3. Serum levels of bone metabolism-related biomarkers. Scattered dot plots for the serum levels of (A) bone specific alkaline phosphatase (BALP), (B) C-terminal telopeptide of type I collagen (CTX), (C) deoxypyridinoline (DPD), (D) bone gla-protein (BGP), and (E) tartrate-resistant acid phosphatase (TRAP). the dashed line represents the mean of each group and error bars represent the SD. Numerical data was presented in the form of mean ± SD. The statistical difference between the two groups was analyzed by unpaired t test. Significance was considered when p ≤ 0.05.
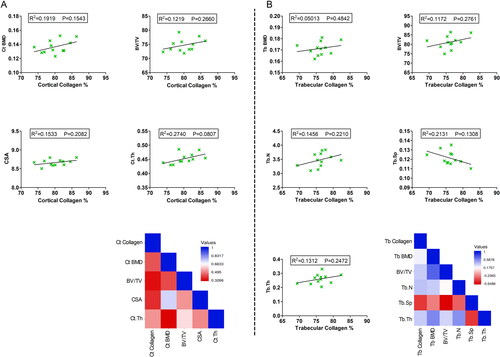
The correlation analysis between the collagen deposition and other bone-related trabecular and cortical morphometric microstructure parameters are presented in . The impact of caffeine consumption for 12 wk on collagen deposition was correlated with its effects on Tb BMD, BV/TV, Tb.N, Tb.Sp, and Tb.Th in the femoral head trabecular bone as well as Ct BMD, BV/TV, CSA, and Ct.Th in the cortical middle femoral diaphysis. Although there was an inclination of positive correlations between the cortical percentage of collagen and the cortical morphometric microstructure parameters, these correlations did not reach a significant level (). Furthermore, the trabecular morphometric microstructure parameters demonstrated a trend of positive correlations with the trabecular percentage of collagen, except for Tb.Sp that showed a negative correlation with the trabecular percentage of collagen. However, statistics did not reveal significant correlations ().
Figure 4. Correlation analysis between cortical and trabecular collagen deposition and other bone-related morphometric microstructure parameters. (A) Correlation analysis between cortical bone collagen percentage and cortical bone-related morphometric microstructure parameters including Ct BMD, BV/TV, CSA, and Ct.Th in the middle femoral diaphysis region. (B) Correlation analysis between trabecular bone collagen percentage and trabecular bone-related morphometric microstructure parameters including Tb BMD, BV/TV, Tb.N, Tb.Sp, and Tb.Th in the femoral head trabecular bone. R2 and p values are expressed on the top of each figure. Heatmaps show the pairwise Pearson correlation analysis expressed as r values. Significance was considered when p ≤ 0.05.
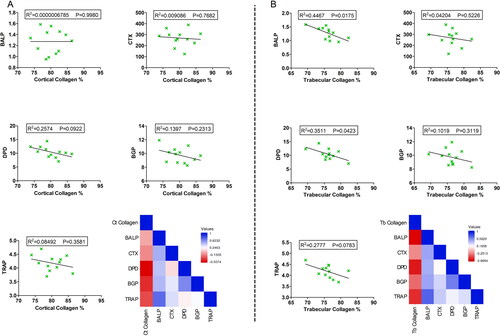
The total effects of caffeine intake for 12 wk on collagen deposition at the two ROIs were also correlated with its influence on the serum levels of bone-metabolic parameters including BALP, CTX, DPD, BGP, and TRAP. In the cortical middle femoral diaphysis area, there was a tendency of negative correlations between collagen percentage and the serum levels of BALP, CTX, DPD, BGP, and TRAP. These correlations were not significant correlations (). On the other hand, the serum bone remodeling metabolic parameters were negatively correlated with the trabecular percentage of collagen. These negative correlations were statistically significant in the case of BALP (p = 0.0175) and DPD (p = 0.0423), while none-significant with other metabolic parameters ().
Figure 5. Correlation analysis between cortical and trabecular collagen deposition and serum levels of bone-metabolic parameters. (A) Correlation analysis between cortical bone collagen percentage and serum levels of BALP, CTX, DPD, BGP, and TRAP. (B) Correlation analysis between trabecular bone collagen percentage and serum levels of BALP, CTX, DPD, BGP, and TRAP. R2 and p values are expressed on the top of each figure. Heatmaps show the pairwise Pearson correlation analysis expressed as r values. Significance was considered when p ≤ 0.05.
Discussion
This study evaluated the impact of chronic caffeine consumption for 12 wk on the deposition of collagen in different sections of the femoral bones in female Wistar albino rats. The findings of this study also unveil morphological and biomechanical changes in the long bones following chronic caffeine intake. The effect of caffeine on collagen deposition was correlated with the morphometric and biomechanical alterations for a better understanding of its influence. Multiple regions were evaluated within the femoral bones. The proximal femur region, which involves (1) the femoral head, (2) the neck, and (3) the lesser trochanter distal area are rich in trabecular compartments and blood supply (Eyüboğlu et al., Citation2020). The middle diaphyseal femoral region is a hollow tube of cortical bone. These two portions of the femoral bone are commonly evaluated in studies that assess the effects of pathological conditions or medications on bone loss and osteoporosis. In addition, studies have shown that femur fractures are commonly encountered in these regions, particularly the proximal femur (Bergh, Wennergren, Möller, & Brisby, Citation2020).
In the present study, female rats were selected to study the impact of caffeine on the skeletal tissues due to gender differences in caffeine consumption and side effects (Dillon et al., Citation2019). In addition, caffeine metabolism is higher in males, which enhances the exposure time to caffeine in females (White et al., Citation2016). Moreover, the incidence of bone fractures in females is also much higher than in males (Cawthon, Citation2011). Experimentally, caffeine consumption showed gender-dependent effects on alcohol-induced alveolar bone loss (Maia et al., Citation2020) and animals’ locomotor activity (Alsufyani & Docherty, Citation2017). Choi et al. found that caffeine intake in male rats can decrease the growth of longitudinal bone in a time- and dose-dependent manner (Choi et al., Citation2016). Administration of pure caffeine in rats aggressively restricted the healing of alveolar bone after tooth extraction (Macedo, Brentegani, & Lacerda, Citation2015). Another experimental study demonstrated that caffeine exposure exacerbates ligature-induced bone loss in rats (Bezerra et al., Citation2013). High daily intake of caffeine disturbed bone healing particularly at the early stage (Duarte, Marques, Bezerra, & Bastos, Citation2009). Notably, caffeine intake increased the plasticization of the bone shafts and altered bone quantitative composition (Olchowik, Chadaj-Polberg, Tomaszewski, Polberg, & Tomaszewska, Citation2011) suggesting the involvement of collagen-related pathways in the influence of caffeine on the skeletal system.
The organic extracellular matrix in bone consists mainly of type I collagen and other types, which are all produced during the mineralization phase of bone development (Lin et al., Citation2020). The major findings of the present study were the ability of caffeine to markedly reduce the presence of collagen in the long bone, particularly in the trabecular areas. This suppression was correlated with the altered morphological changes in the femoral regions. Type III collagen is normally produced by different mesenchymal cell types such as fibroblasts and forms the interstitial matrix together with type I collagen, whereas type I collagen is considered the predominant collagen (Viguet-Carrin et al., Citation2006). The crucial role that collagen plays in the development of bone and cartilage as well as mesenchymal stem cell’s osteogenic properties are well-documented. For instance, studies showed that type III collagen enhances trabecular bone development and improves bone formation via stimulation of the osteoblastogenesis process (Maehata et al., Citation2007; Volk et al., Citation2014). The current results indicate that caffeine’s suppressive effects on collagen deposition had an impact on the bone-forming cells, which could disturb the physiological bone remodeling process. These outcomes are in agreement with earlier studies, where caffeine restrained the proliferation of rat UMR106-01 osteoblast-like cells (Kamagata-Kiyoura et al., Citation1999) and reduced the activities of human osteoblast cells via modulation of vitamin D receptors (Rapuri et al., Citation2007). Similarly, Tassinari et al. suggested that caffeine alters the development of bone by inhibiting the osteoblast-mediated extracellular matrix formation, which reduces mineralization (Tassinari et al., Citation1991). Caffeine also reduced the expression of several types of collagens in primary rat chondrocytes (Choi et al., Citation2017). Notably, caffeine minimized the presence of type I collagen in rat bone mesenchymal stem cells and hindered their osteogenic activities (Reis et al., Citation2016; Zhou et al., Citation2010). Moreover, caffeine constrained the concentration of total collagen in a chick osteoblast culture system (Tassinari et al., Citation1991). Another study showed that pregnant rats, who consumed caffeine had offspring with disturbed articular cartilage chondrocytes and decreased collagen synthesis (Reis et al., Citation2018). These previous findings support the present data and suggest more evidence that caffeine alters collagen deposition in the skeletal system.
Noteworthy that the altered morphometric bone structure in the caffeine group was consistent with previous studies using a wide range of dosing. For instance, the in vivo part of the Choi et al. study reported that high doses of caffeine (120 and 180 mg/kg/day) for 4 wk can suppress long bone growth and chondrocytes proliferation (Choi et al., Citation2017). In the present study, caffeine was provided in the drinking water at a dose of 300 mg/L (0.3 mg/mL), which corresponds to a daily dose of 3 mg/kg/day in line with the number of animals in each cage and the regular water consumption rate in rats. The selection of the dose was built upon the previous investigation (Martinez et al., Citation2018). This dose represents a relatively mild caffeine daily intake compared to earlier studies that reported the adverse effects of caffeine ingestion on the bone at a higher (50 mg/ml) dose (Lacerda et al., Citation2010). The use of a lower caffeine dose was favored in the present study as exposure to pure caffeine (not coffee) was evaluated. Accordingly, the presence of other ingredients that might influence the bone-related effects was avoided. Moreover, the duration of caffeine exposure was long in the present study (12 wk) and the accumulation of caffeine’s systemic adverse effects was avoided by using the mild dose. It is worth mentioning that caffeine’s effects on the differentiation and activities of bone-forming cells were also reported even at a low (0.1 mM) dose (Su et al., Citation2013).
Limitations that might be considered in the context of the present study findings include: (1) There was no pathological model such as fracture for a better understanding of caffeine impact on bone healing particularly that collagen, specifically type III, might be produced as a healing compensatory mechanism (Chen, Li, Liu, Chen, & Liu, Citation2014). (2) Although the gender-specific influence on bone formation is reported, the effects of caffeine were investigated in a single gender. (3) It would have been also valuable to take the measurements at the beginning of the study to draw a complete picture of the impact of caffeine intake on the age-related skeletal deposition of collagen.
Conclusion
Taking the present findings collectively, this study established new evidence to support previous reports of chronic caffeine consumption altering effects on the microstructure of long bones leading to metabolic-related alterations. Additionally, the present study suggests that the impact of caffeine intake on such skeletal morphological alterations could be mediated through the imbalance in collage deposition, particularly at the trabecular sections of the long bones. Future translational and preclinical studies may warrant further mechanistic explorations for caffeine’s impact on bone health and may recommend moderate daily intake.
Author contributions
HA: Conceptualization, Investigation, Methodology, Visualization, Validation, Writing-Original Draft, and Writing-Review & Editing.
Acknowledgments
The author is grateful to Hussain Alhawaj and Jim Santander for the technical assistance.
Disclosure statement
No potential conflict of interest was reported by the authors.
Data availability statement
All data supporting the findings are available within the manuscript.
References
- Alsufyani, H. A., & Docherty, J. R. (2017). Gender differences in the effects of cathinone and the interaction with caffeine on temperature and locomotor activity in the rat. European Journal of Pharmacology, 809, 203–208. doi:10.1016/j.ejphar.2017.05.028
- Asoudeh, F., Bagheri, A., Larijani, B., & Esmaillzadeh, A. (2022). Coffee consumption and caffeine intake in relation to risk of fractures: A systematic review and dose-response meta-analysis of observational studies. Critical Reviews in Food Science and Nutrition, 27, 1–13. doi:10.1080/10408398.2022.2067114
- Babicki, S., Arndt, D., Marcu, A., Liang, Y., Grant, J. R., Maciejewski, A., & Wishart, D. S. (2016). Heatmapper: Web-enabled heat mapping for all. Nucleic Acids Research, 44(W1), W147–53. doi:10.1093/nar/gkw419
- Bergh, C., Wennergren, D., Möller, M., & Brisby, H. (2020). Fracture incidence in adults in relation to age and gender: A study of 27,169 fractures in the Swedish Fracture Register in a well-defined catchment area. PloS One, 15(12), e0244291. doi:10.1371/journal.pone.0244291
- Berman, N. K., Honig, S., Cronstein, B. N., & Pillinger, M. H. (2022). The effects of caffeine on bone mineral density and fracture risk. Osteoporosis International: A Journal Established as Result of Cooperation between the European Foundation for Osteoporosis and the National Osteoporosis Foundation of the USA, 33(6), 1235–1241. doi:10.1007/s00198-021-05972-w
- Bezerra, J. P., de Siqueira, A., Pires, A. G., Marques, M. R., Duarte, P. M., & Bastos, M. F. (2013). Effects of estrogen deficiency and/or caffeine intake on alveolar bone loss, density, and healing: A study in rats. Journal of Periodontology, 84(6), 839–849. doi:10.1902/jop.2012.120192
- Cawthon, P. M. (2011). Gender differences in osteoporosis and fractures. Clinical Orthopaedics and Related Research, 469(7), 1900–1905. doi:10.1007/s11999-011-1780-7
- Chen, X., Li, N., Liu, J., Chen, J., & Liu, H. Expression of collagen I, collagen III and MMP-1 on the tension side of distracted tooth using periodontal ligament distraction osteogenesis in beagle dogs. Archives of Oral Biology, 2014, 59(11), 1217–1225. doi:10.1016/j.archoralbio.2014.07.011
- Choi, H., Choi, Y., Kim, J., Bae, J., & Roh, J. (2017). Longitudinal bone growth is impaired by direct involvement of caffeine with chondrocyte differentiation in the growth plate. Journal of Anatomy, 230(1), 117–127. doi:10.1111/joa.12530
- Choi, Y.-Y., Choi, Y., Kim, J., Choi, H., Shin, J., & Roh, J. (2016). Peripubertal caffeine exposure impairs longitudinal bone growth in immature male rats in a dose- and time-dependent manner. Journal of Medicinal Food, 19(1), 73–84. doi:10.1089/jmf.2015.3467
- Dal-Fabbro, R., Cosme-Silva, L., Capalbo, L. C., Chaves-Neto, A. H., Ervolino, E., Cintra, L. T. A., & Gomes-Filho, J. E. (2021). Excessive caffeine intake increases bone resorption associated with periapical periodontitis in rats. International Endodontic Journal, 54(10), 1861–1870. doi:10.1111/iej.13578
- Dillon, P., Kelpin, S., Kendler, K., Thacker, L., Dick, D., & Svikis, D. (2019). Gender differences in any-source caffeine and energy drink use and associated adverse health behaviors. Journal of Caffeine and Adenosine Research, 9(1), 12–19. doi:10.1089/caff.2018.0008
- Duarte, P. M., Marques, M. R., Bezerra, J. P., & Bastos, M. F. (2009). The effects of caffeine administration on the early stage of bone healing and bone density A histometric study in rats. Archives of Oral Biology, 54(8), 717–722. doi:10.1016/j.archoralbio.2009.05.001
- Elango, J., Robinson, J., Zhang, J., Bao, B., Ma, N., de Val, J. E. M. S., & Wu, W. (2019). Collagen peptide upregulates osteoblastogenesis from bone marrow mesenchymal stem cells through MAPK- Runx2. Cells, 8(5), 446. doi:10.3390/cells8050446
- Eyüboğlu, F., Sayaca, Ç., Çalik, M., Korkem, D., Tascilar, L. N., & Kaya, D. (2020). Chapter 21 - Kinesiology of the hip. In S. Angin & I. E. Şimşek (Eds.), Comparative kinesiology of the human body (pp. 375–392). Cambridge, MA: Academic Press.
- FDA. (2018). Spilling the beans: How much caffeine is too much? Retrieved from https://www.fda.gov/consumers/consumer-updates/spilling-beans-how-much-caffeine-too-much.
- Ferreira Bastos, M., Barreto Menezes, D. J., Pinho Bezerra, J., Craneck Braz, C. K., Silva Fonseca, P. F., Arana-Chavez, V. E., … Mendes Duarte, P. (2014). Impact of caffeine and/or estrogen deficiency on trabecular bone area and healing: A study in rats. The International Journal of Oral & Maxillofacial Implants, 29(1), 221–231.
- Kamagata-Kiyoura, Y., Ohta, M., Cheuk, G., Yazdani, M., Saltzman, M. J., & Nakamoto, T. (1999). Combined effects of caffeine and prostaglandin E2 on the proliferation of osteoblast-like cells (UMR106-01). Journal of Periodontology, 70(3), 283–288. doi:10.1902/jop.1999.70.3.283
- Lacerda, S. A., Matuoka, R. I., Macedo, R. M., Petenusci, S. O., Campos, A. A., & Brentegani, L. G. (2010). Bone quality associated with daily intake of coffee: A biochemical, radiographic and histometric study. Brazilian Dental Journal, 21(3), 199–204. doi:10.1590/s0103-64402010000300004
- Licini, C., Notarstefano, V., Marchi, S., Cerqueni, G., Ciapetti, G., Vitale-Brovarone, C., … Mattioli-Belmonte, M. (2022). Altered type I collagen networking in osteoporotic human femoral head revealed by histomorphometric and Fourier transform infrared imaging correlated analyses. BioFactors (Oxford, England), 48(5), 1089–1110. doi:10.1002/biof.1870
- Lin, X., Patil, S., Gao, Y.-G., & Qian, A. (2020). The bone extracellular matrix in bone formation and regeneration. Frontiers in Pharmacology, 11, 757. doi:10.3389/fphar.2020.00757
- Liu, H., Yao, K., Zhang, W., Zhou, J., Wu, T., & He, C. (2012). Coffee consumption and risk of fractures: A meta-analysis. Archives of Medical Science: AMS, 8(5), 776–783. doi:10.5114/aoms.2012.31612
- Macedo, R. M., Brentegani, L. G., & Lacerda, S. A. (2015). Effects of coffee intake and intraperitoneal caffeine on bone repair process–a histologic and histometric study. Brazilian Dental Journal, 26(2), 175–180. doi:10.1590/0103-6440201300219
- Maehata, Y., Takamizawa, S., Ozawa, S., Izukuri, K., Kato, Y., Sato, S., … Hata, R.-I. (2007). Type III collagen is essential for growth acceleration of human osteoblastic cells by ascorbic acid 2-phosphate, a long-acting vitamin C derivative. Matrix Biology: Journal of the International Society for Matrix Biology, 26(5), 371–381. doi:10.1016/j.matbio.2007.01.005
- Maia, C., Pinheiro, B. G., Soares da Silva, C. C., Cunha, R. A., Souza-Monteiro, D., Martins Ferreira, M. K., … Lima, R. R. (2020). Prolonged caffeine intake decreases alveolar bone damage induced by binge-like ethanol consumption in adolescent female rats. Biomedicine & Pharmacotherapy = Biomedecine & Pharmacotherapie, 130, 110608. doi:10.1016/j.biopha.2020.110608
- Martinez, M., Rossetto, I. M. U., Neto, F. S. L., Tirapelli, L. F., Tirapelli, D. P. C., Chuffa, L. G. A., … Martinez, F. E. (2018). Interactions of ethanol and caffeine on apoptosis in the rat cerebellum (voluntary ethanol consumers). Cell Biology International, 42(11), 1575–1583. doi:10.1002/cbin.11054
- Olchowik, G., Chadaj-Polberg, E., Tomaszewski, M., Polberg, M., & Tomaszewska, M. (2011). The influence of caffeine on the biomechanical properties of bone tissue during pregnancy in a population of rats. Folia Histochemica et Cytobiologica, 49(3), 504–511. doi:10.5603/fhc.2011.0071
- Rapuri, P. B., Gallagher, J. C., & Nawaz, Z. (2007). Caffeine decreases vitamin D receptor protein expression and 1,25(OH)2D3 stimulated alkaline phosphatase activity in human osteoblast cells. The Journal of Steroid Biochemistry and Molecular Biology, 103(3–5), 368–371. doi:10.1016/j.jsbmb.2006.12.037
- Reis, A. M. S., Ocarino, N. d M., Boeloni, J. N., Gomes, D. A., Goes, A. M., Ferreira, A. d F., & Serakides, R. (2016). Inhibition of the osteogenic differentiation of mesenchymal stem cells derived from the offspring of rats treated with caffeine during pregnancy and lactation. Connective Tissue Research, 57(2), 131–142. doi:10.3109/03008207.2015.1117075
- Reis, A. M. S., Oliveira, K. P., de Paula, I. H. F., da Silva, A. P., Tarragô, J. F., de Melo Ocarino, N., & Serakides, R. (2018). Nonlinear effects of caffeine on the viability, synthesis and gene expression of chondrocytes from the offspring of rats treated during pregnancy. Acta Histochemica, 120(6), 505–512. doi:10.1016/j.acthis.2018.06.001
- Reis, A. M. S., Ribeiro, L. G. R., Ocarino, N. d M., Goes, A. M., & Serakides, R. (2015). Osteogenic potential of osteoblasts from neonatal rats born to mothers treated with caffeine throughout pregnancy. BMC Musculoskeletal Disorders, 16(1), 10. doi:10.1186/s12891-015-0467-8
- Sasso, G. R. D. S., Florencio-Silva, R., Santos, M. A., Teixeira, C. D. P., Simões, M. D. J., Katchburian, E., & Reginato, R. D. (2015). Effects of early and late treatments of low-intensity, high-frequency mechanical vibration on bone parameters in rats. Gynecological Endocrinology: The Official Journal of the International Society of Gynecological Endocrinology, 31(12), 980–986. doi:10.3109/09513590.2015.1075198
- Su, S.-J., Chang, K.-L., Su, S.-H., Yeh, Y.-T., Shyu, H.-W., & Chen, K.-M. (2013). Caffeine regulates osteogenic differentiation and mineralization of primary adipose-derived stem cells and a bone marrow stromal cell line. International Journal of Food Sciences and Nutrition, 64(4), 429–436. doi:10.3109/09637486.2012.759184
- Tassinari, M. S., Gerstenfeld, L. C., Stein, G. S., & Lian, J. B. (1991). Effect of caffeine on parameters of osteoblast growth and differentiation of a mineralized extracellular matrix in vitro. Journal of Bone and Mineral Research: The Official Journal of the American Society for Bone and Mineral Research, 6(10), 1029–1036. doi:10.1002/jbmr.5650061003
- Tatler, A. L., Barnes, J., Habgood, A., Goodwin, A., McAnulty, R. J., & Jenkins, G. (2016). Caffeine inhibits TGFβ activation in epithelial cells, interrupts fibroblast responses to TGFβ, and reduces established fibrosis in ex vivo precision-cut lung slices. Thorax, 71(6), 565–567. doi:10.1136/thoraxjnl-2015-208215
- Vargas-Pozada, E. E., Ramos-Tovar, E., Acero-Hernández, C., Cardoso-Lezama, I., Galindo-Gómez, S., Tsutsumi, V., & Muriel, P. (2022). Caffeine mitigates experimental nonalcoholic steatohepatitis and the progression of thioacetamide-induced liver fibrosis by blocking the MAPK and TGF-β/Smad3 signaling pathways. Annals of Hepatology, 27(2), 100671. doi:10.1016/j.aohep.2022.100671
- Viguet-Carrin, S., Garnero, P., & Delmas, P. D. (2006). The role of collagen in bone strength. Osteoporosis International: A Journal Established as Result of Cooperation between the European Foundation for Osteoporosis and the National Osteoporosis Foundation of the USA, 17(3), 319–336. doi:10.1007/s00198-005-2035-9
- Volk, S. W., Shah, S. R., Cohen, A. J., Wang, Y., Brisson, B. K., Vogel, L. K., … Adams, S. L. (2014). Type III collagen regulates osteoblastogenesis and the quantity of trabecular bone. Calcified Tissue International, 94(6), 621–631. doi:10.1007/s00223-014-9843-x
- Wang, Q., Dai, X., Yang, W., Wang, H., Zhao, H., Yang, F., … Lv, X. (2015). Caffeine protects against alcohol-induced liver fibrosis by dampening the cAMP/PKA/CREB pathway in rat hepatic stellate cells. International Immunopharmacology, 25(2), 340–352. doi:10.1016/j.intimp.2015.02.012
- White, J. R., Padowski, J. M., Zhong, Y., Chen, G., Luo, S., Lazarus, P., … McPherson, S., Jr. (2016). Pharmacokinetic analysis and comparison of caffeine administered rapidly or slowly in coffee chilled or hot versus chilled energy drink in healthy young adults. Clinical Toxicology (Philadelphia, Pa.), 54(4), 308–312. doi:10.3109/15563650.2016.1146740
- Zhou, Y., Guan, X. X., Zhu, Z. L., Guo, J., Huang, Y. C., Hou, W. W., & Yu, H. Y. (2010). Caffeine inhibits the viability and osteogenic differentiation of rat bone marrow-derived mesenchymal stromal cells. British Journal of Pharmacology, 161(7), 1542–1552. doi:10.1111/j.1476-5381.2010.00998.x