
ABSTRACT
Microscopic organisms maintained in long-term living monocultures undergo evolution, adapting to the stable laboratory environment. Culture adaptation can result in isolates no longer being representative of their native environmental niche. This study characterized the morphology and compared the full genomes of four daughter cultures of the toxic cyanobacterium Raphidiopsis raciborskii CS-506 maintained in living culture for 23 years. The four daughter cultures were split from the parent culture between 2 and 10 years ago. The morphotypes of two cultures had changed from coiled to straight (CS-506A, B), while CS-506C, D had smaller cells and shorter coiled trichomes. The toxin cell quota had increased for cultures CS-506A-C but decreased in CS-506D compared to 2012 measurements. Culture CS-506C was unable to produce heterocysts or fix atmospheric nitrogen. The core genome, comprising 78% of all genes and all primary metabolic functions, was unchanged. The variable genome, ~12%, showed difference in gene presence/absence, and ~1% of each genome was unique proteins, with evidence of horizontal gene transfer from contaminating bacteria and multiple gene loss events, and an overall strategy of genome reduction. The changes in morphology, nitrogen fixation and toxin cell quota were not supported by identifiable genome changes, with 100% synteny across nifHDK and cyr gene clusters. The results suggest that R. raciborskii CS-506 has a stable core genome, heritable phenotypes, and a variable genome generated through horizontal gene transfer and gene loss.
Introduction
‘Rapid genetic alteration at the whole genome level during culturing is of particular concern when selecting laboratory-maintained isolates or clones for physiological, biochemical, molecular or whole genome sequencing studies’ (Lakeman, von Dassow, & Cattolico, Citation2009).
Microscopic organisms, including bacteria, cyanobacteria and algae, are a highly diverse group, inhabiting environmental niches across the Earth’s habitats. Their breadth of habitats stems from an incredible ability to adapt to their environment, through flexible physiology and rapid adaptation to environmental changes. To effectively study the physiology of microorganisms they are isolated as single cells, these divide asexually into monocultures and are then maintained under laboratory conditions. These cultures are essential for research and industry and many species have been maintained in long-term living cultures under static laboratory conditions for many years. Although the conditions are static the microorganisms themselves are not and continue to adapt to their environment (Lakeman et al., Citation2009). Culture adaptation and evolution is an important consideration for researchers, as changes that occur in the laboratory can result in these isolates no longer being representative of their native environmental niche (Murphy, Citation1978).
Culture adaptation arises from phenotypic plasticity, spontaneous random mutations and selection, mechanisms that are important for environmental adaptation. In the absence of changing environmental selection pressures, due to the stable laboratory conditions, genetic drift can result in rare mutations that affect the phenotype becoming dominant in the culture (Lakeman et al., Citation2009). Measuring the effects of culture adaptation can be difficult as it requires periodic assessment of cultures, archiving genetic material or maintaining multiple daughter cultures in parallel. To have a greater understanding of how genetic drift and genome evolution occurs it may even be required to maintain multiple daughter cultures in parallel under different conditions.
Phenotypic changes have been found to occur within weeks of species being cultured (Lakeman & Cattolico, Citation2007; Costas et al., Citation1998), although most changes are the result of years in culture and are heritable genetic mutations. For example, the green alga Oocystis had reduced grazing defences and increased growth rate after 3 years in culture (Demott & McKinney, Citation2015). Cultures of the dinoflagellate Heterocapsa triquetra have been found to have increased pH tolerance and decreased growth rate in cultures maintained from 10 to 51 years (Berge, Daugbjerg, & Hansen, Citation2012). Intraspecific diversity can also arise within monocultures: isolates from a ~ 50-year old monoculture of Heterosigma akashiwo CCMP452 demonstrated heritable diversity in stress tolerance (Lakeman & Cattolico, Citation2007). However, these studies did not investigate the underlying genetic changes causing these physiological differences. Studies with bacteria, which are more amenable to evolution research, because of their smaller genome size and short generation time, have provided more insights into culture adaption. For example, the long-term evolution experiment with Escherichia coli has described extensively the potential of genetic drift to influence genome evolution (for a review see Lenski, Citation2017). These experiments have shown an increase in improvement, i.e. growth rate, of the cultures over thousands of generations, and the rate of fitness improvement and fixation of beneficial mutations decreasing over time (Good, McDonald, Barrick, Lenski, & Desai, Citation2017).
Cyanobacteria are important in many environments and research on their physiology is facilitated through isolates maintained in algal culture collections. Because of their bacterial characteristics, e.g. binary fission, homologous recombination, and horizontal gene transfer (HGT), cyanobacteria may undergo rapid culture evolution, thus they are an interesting model for investigating culture adaptation. Their small genome size also facilitates full genome characterization. In this study we analysed the genome evolution and morphological differences of four daughter cultures of Raphidiopsis raciborskii CS-506 that were split from the original progenitor clone culture and maintained independently. Raphidiopsis raciborskii (basionym Cylindrospermopsis raciborskii) is a toxic cyanobacterium with global occurrence in freshwater habitats. R. raciborskii has been of particular research interest as it forms harmful algal blooms and has multiple co-occurring strains, or ecotypes, that differ in their morphology, physiology, toxin type and toxin cell quota (for a review see Burford et al., Citation2016). The ecophysiological differences among the strains are supported by genetic differences (Piccini et al., Citation2011), with co-occurring and spatially disparate strains having a core genome of approximately 62−85% (Abreu et al., Citation2018; Sinha et al., Citation2014; Willis et al., Citation2018). Intraspecific variation, both physiological and genetic, appears to be an important aspect of the biology of R. raciborskii (Burford, Willis, Chuang, Man, & Orr, Citation2018), probably supporting a highly adaptive population able to quickly respond to environmental drivers. The environmental impact of this species, its high phenotypic plasticity and small genome size have meant that R. raciborskii has become a model species for research. Two strains have been widely used in laboratory studies. The strains CS-505 and CS-506 were both isolated from Palm Island in 1996 by Martin Saker, accessioned into the Australian National Algae Culture Collection (ANACC) in 1999, and have become the model strains for laboratory research.
This study investigated the morphological and genetic differences among four daughter cultures and compared them to characterizations of the original 1996 culture and a 2010–2012 culture. Full genomes were sequenced and compared to the genome sequenced in 2010 as a reference. This analysis was instigated by the observation of the loss of heterocysts and the ability to fix atmospheric N2 in one culture (Willis et al., Citation2015), and a change in the predominant morphotype from the original coiled (Saker, Neilan, & Griffiths, Citation1999) to straight trichomes in another. Thus, morphology, growth rates, toxin cell quotas and genomes were characterized to gain an understanding of the extent of adaptation undergone by these cultures.
Methods and methods
Cultures
Four daughter cultures of Raphidiopsis raciborskii CS-506 were obtained from ANACC and Griffith University in March 2018 and maintained in modified Jaworskii’s Medium (Thompson, Rhodes, & Pettman, Citation1988; 1/4 phosphate concentration, according to Willis et al., Citation2015) at 28°C, under 12 h:12 h light:dark cycle of 20 µmol photons m−2 s−1. The four daughter cultures were designated A–D (), where A was received by ANACC in 1999 from Martin Saker. In 2009 a daughter culture was supplied to Griffith University (culture C), which was split and supplied to UNSW and Monash University (culture D). In 2013 the culture maintained at Griffith University was observed to no longer produce heterocysts or fix atmospheric N2 (Willis et al., Citation2015). In 2016 a second CS-506 culture (B) was supplied to Griffith University. These cultures were non-axenic at the time of this study, and probably contained heterotrophic bacteria throughout their time in culture. Prior to this study CS-506A was maintained at 20°C, CS-506B–C at 28°C, and CS-506D at 25°C; all were maintained under 12 h:12 h light:dark cycle of 10–20 µmol photons m−2 s−1. CS-506A was subcultured every 12 weeks, while CS-506B-D were subcultured every 3–4 weeks.
Figure 1. Historical time line of Raphidiopsis raciborskii CS-506 A-D cultures.
Growth experiment
In May 2018, cultures of CS-506A-D were grown in triplicate 250 ml cultures in modified JM under the conditions described above. The cell density was determined by optical density absorbance at 750 nm (OD750) with a spectrophotometer (DU530, Beckman Coulter, California, USA). The initial cell density was OD750 = 0.02, and four weekly OD750 measurements were made for 25 days. Specific growth rates were measured during exponential phase using the standard growth equation µ = ln(c2/c1)/t2-t1, where c is the optical density and t is the time (Andersen, Citation2005)
Cell enumeration
On day 10 of the growth experiment, a 2 ml subsample was preserved with ~1% final volume Lugol’s solution. The number of trichomes ml−1 was counted using a Sedgewick Rafter at 40x magnification using a Leitz microscope. The number of trichomes per square counted until the average and standard deviation for trichomes ml−1 stabilized. Under 100x magnification the trichome length, cell length and cell width were measured using the Leica Application Suite (v.4.10.0) software. Measurements were made until the average and standard deviation stabilized (Woelkerling, Kowal, & Gough, Citation1976). The average cells ml−1, cells trichome−1, and cell volume (µm3) were calculated from the average of the measurements of the three replicates.
Toxin analysis
A 5 ml subsample of each triplicate culture was taken on day 10 of the growth experiment. The whole water samples were lyophilized and the cylindrospermopsin (CYN)/deoxy-cylindrospermopsin (d-CYN) extracted in 1 ml 50 mol l−1 acetic acid with 3 × 30 s probe sonication on ice, as previously described (Willis et al., Citation2015). The CYN and d-CYN content were analysed at the Queensland Forensic Health Services by HPLC-MS/MS (Eaglesham et al., Citation1999). The toxin cell quota was calculated from the average cells ml−1 and cell volume.
Statistical analysis
Growth rates and toxin cell quotas between cultures were compared by ANOVA in R studio using easyanova package (R Core Team, Citation2017). A Euclidean distance plot using the morphology measurements, growth rate and toxin content was calculated in R studio (R Core Team, Citation2017).
DNA isolation and sequencing
Total genomic DNA was isolated from 50 ml of exponentially growing cell culture with a modified phenol:chloroform method. Briefly, cells were collected with centrifugation, 5 min at 4,000 rpm, washed twice with 15 mmol l−1 NaCl, and resuspended in 500 µl lysis buffer (10 mmol l−1 Tris-HCl, 0.1 mmol l−1 EDTA, 1% SDS) with glass beads. Cell mixtures were vortexed for 30 sec, RNAse A added and incubated at 37°C for 20 min. Proteinase K (250 µg) and SDS (0.5%) were then added and the mixture incubated at 50°C for 2 h. Phenol:chloroform:isoamyl alcohol (25:24:1, Sigma) was added to the cell lysis mixture (1:1 volume), the solution mixed and centrifuged 10 min, 10,000 rpm. The DNA-containing supernatant was washed once with 1:1 volume chloroform:isoamyl alcohol (24:1, Sigma), centrifuged 10 min, 10,000rpm. The DNA was precipitated with 100% ethanol v2.3.4 and 0.03 µM sodium acetate at −20°C, followed by centrifugation at 4°C, 14,000 rpm, 20 min. Isolated DNA was washed using a salt:chloroform wash (Pacific Biosciences, California, USA) and Ampure XP beads (Agencourt Bioscience, Massachusetts, USA) as per the manufacturers’ instructions. Quality and quantity of DNA were assessed using a Nanodrop and Qubit assay.
Genomic libraries were prepared with Nextera DNA Flex library preparation kit and 2 × 150 bp sequencing was performed on the Illumina Miseq instrument at the Ramaciotti Centre for Genomics.
Sequence processing and assembly
Sequences were quality trimmed using BBDuk then mapped to the reference genome CS-506i (Sinha et al., Citation2014) using Bowtie and gene prediction and annotation were performed using the Prokka package v2.3.4 (Langmead et al., Citation2009; Seemann, Citation2014).
Comparative genomics
Genome comparison of the five genomes, CS-506i, A–D, was conducted using Blast Atlas analysis in GView Server (Petkau, Stuart-Edwards, Stothard, & Domselaar, Citation2010). OrthoVenn2 server was used for the analysis of orthologous clusters and unique protein identification (Xu et al., Citation2019). Geneious was used to search and identify annotated genes within each genome and compare synteny and SNPs between genomes. Contigs of each of the five genomes were concatenated and aligned using MAFFT, and a tree built using the Neighbour-joining method with the Tamura-Nei Genetic Distance Model. Subsystem analysis was performed with RAST server (Aziz et al., Citation2008) and SEED tool (Overbeek et al., Citation2014). Unique protein sequences were BLASTp searched against the NCBI UniProtKB/Swiss-Prot database.
16S biodiversity
Geneious was used to perform de novo assemblies from each of the four CS-506A–D sequence data, and assembles were BLAST searched against a 16S database to identify co-occurring bacteria.
Results
Morphology
The morphological characteristics of the four R. raciborskii cultures, CS-506A–D, differed between cultures. CS-506A and CS-506B had straight trichome morphology, more cells trichome−1, and larger cell volumes (). Cultures CS-506C and CS-506D had coiled morphology, fewer cells per trichome and smaller cell volumes, in comparison to CS-506A and CS-506B. The growth rates of each of the four cultures, CS-506A–D, were not significantly different between cultures. The toxin cell quota (QCYN) was significantly higher in culture CS-506A, and significantly lower in culture CS-506D, but there was no significant difference between cultures CS-506B and CS-506C, where the QCYN was lower than CS-506A and higher than CS-506D ().
Table 1. Morphology and physiological measurements of the four living R. raciborskii cultures CS-506A–D, and data from the initial characterization of CS-506 (Saker et al., Citation1999) and the 2012 characterization (Willis et al., Citation2015).
The Euclidean distance plot () shows that culture CS-506B is the most similar to the initial CS-506 culture characteristics, CS-506D the most similar to CS-506i, and CS-506A is the most different from all other cultures.
Figure 2. Euclidean distance plot showing the relationship of the four living cultures of R. raciborskii CS-506A-D, the initial characterization of CS-506 (Saker et al., Citation1999) and the 2012 characterization (Willis et al., Citation2015) based on morphological measurements.
Genome assembly
The four genomes, CS-506A–D, were assembled via mapping to the genome of CS-506i (). The four genomes, CS-506A–D, were slightly smaller than the genome of CS-506i, and CS-506C had the smallest genome. The %GC had also decreased slightly, from 41.9% in CS-506i, to 40.5% in the CS-506A–D genomes.
Table 2. Characteristics of assembled genomes CS506i, A–D.
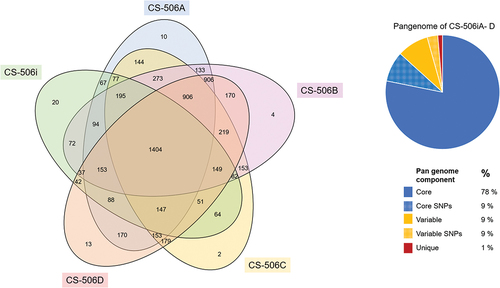
Unique proteins were identified in each genome, with 20 in CS-506i, 10 in CS-506A, 4 in CS-506B, 2 in CS-506C and 13 in CS-506D (, ).
Figure 3. Comparative genomics of the five R. raciborskii CS-506i, A-D genomes, with a Venn diagram of shared and unique proteins (OrthoVenn2), and pie-chart of pangenome with proportion of genes in the core genome, variable genome, and genes with SNPs.
All sequences have been submitted to Genbank, with accession numbers: CS-506A (VDFG00000000); CS-506B (VDFF00000000); CS-506C (VDFE00000000); CS-506D (VDFD00000000).
Comparative genomics
The pangenome of the five cultures, CS-506i, A-D, contained 3665 proteins, the core genome without SNPs comprised 2865 proteins, which was 78% of the pangenome, and genes with SNPs comprised an additional 314 genes, or 9% of the pangenome. The variable genome, those proteins occurring in two to four genomes, was 327 without SNPs, and 110 with SNPs, comprising 9 and 3% of the pangenome, respectively. Approximately 1% of the pangenome comprised unique proteins, occurring in only one genome (). The number of unique proteins identified in each genome was 20 in CS-506i, 10 in CS-506A, 4 in CS-506B, 2 in CS-506C and 13 in CS-506D (, ). BLASTp results () showed that the unique proteins are typically bacterial in origin.
Table 3. Identification of unique proteins with BLASTp hits from each of the five Raphidiopsis raciborskii cultures CS-506i, A–D.
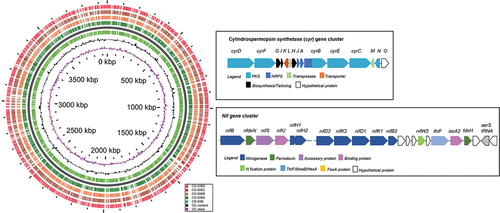
The whole genome MAFFT alignment and neighbour-joining tree () showed cultures CS-506A and D to be the most similar, and CS-506i the most different. Comparison of the CS-506A–D genomes with CS-506i as reference () showed that genome modifications have occurred throughout the genome. Comparison of the cylindrospermopsin biosynthesis cluster (cyr) and nitrogen fixation (nifHDK) cluster found 100% synteny between genomes.
Figure 4. Relationship of the five R. raciborskii CS-506i, A-D genomes through whole genome MAFFT alignment and neighbour-joining tree.
Figure 5. Blast ATLAS analysis of the five Raphidiopsis raciborskii CS-560i, A-D genomes, with CS-506i as reference. The nitrogen fixation (nifHDK) and cylindrospermopsin (cyr) gene clusters are shown; 100% synteny occurred in these clusters across the five genomes.
Identification of contaminating bacteria
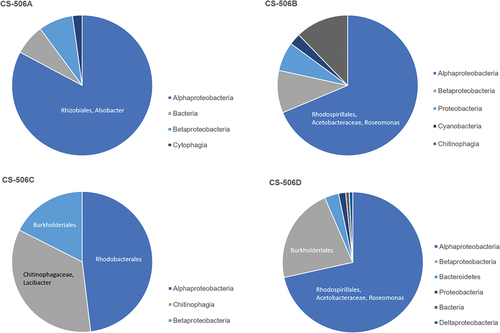
Classification of the 16S sequences in the full sequence data for each culture CS-506A–D identified Alphaproteobacteria, Betaproteobacteria, Cytophagia and Chitinophagia as present in each culture (). Bacterial families identified with high frequency of occurrence were Alsobacter (CS-506A), Acetobacteraceae (CS-506B), Chitinophagaceae (CS-506B, C, D), Comamonadaceae (CS-506B, C), Hyphomicrobiaceae (CS-506C), Methylophilaceae (CS-506A), Rhodobacteraceae (CS-506B, C, D), Rhodospirillaceae (CS-506A) and Sphingomonadaceae (CS-506B, D).
Figure 6. Identification of co-occurring heterotrophic bacteria in Raphidiopsis raciborskii CS-506A-D cultures by 16S biodiversity of metagenomes.
Discussion
R. raciborskii CS-506 has undergone significant morphological and physiological changes during the 23 years it has been in continuous living culture under laboratory conditions. The four daughter cultures, split between 10 and 2 years apart, have also changed significantly from each other. Interestingly, the changes in morphology, nitrogen fixation and toxin content were not supported by identifiable genome changes. The core genome, comprising 78% of all genes and all primary metabolic functions, was unchanged. These results suggest that R. raciborskii CS-506 has a stable core genome, heritable phenotypes and a flexible variable genome.
Characterization of the four daughter cultures gives insight into the morphological, physiological and genome changes that have occurred. There were no general trends in the morphological changes. Cultures A and B have changed from coiled to straight with nearly three times the number of cells trichome−1 in culture A and larger cell volumes. Cultures C and D have maintained their coiled morphology and lower number of cells trichome−1, but now have smaller cells. While these morphological and physiological traits are reported here at discrete time intervals they have been observed over time as graded changes from one state to another, e.g. coiled to straight. Significantly, CS-506C has lost the ability to produce heterocysts and fix nitrogen, as previously observed in Willis et al. (Citation2015). However, 100% synteny occurs between the nifHDK gene cluster, nitrogen regulation genes and heterocyst differentiation genes of all five CS-506 genomes, providing no clues to the cause of this loss of metabolic function.
The genome of R. raciborskii is the smallest of the Nostocales and is generally accepted to be undergoing genome reduction (Larsson, Nylander, & Bergman, Citation2011), with loss of nitrogen fixation predicted, as the genome contains fewer genes involved in nitrogen fixation compared to other cyanobacteria (Stucken et al., Citation2010). This hypothesis is supported by the existence of R. mediterranea, which often co-occurs with R. raciborskii but is characterized by the inability to produce heterocysts and the lack of the nifHDK gene cluster (Stucken et al., Citation2010). It has been suggested that the loss of nitrogen fixation in CS-506C, as previously observed (Willis et al., Citation2015), is evidence supporting this hypothesis (Aguilera, Gómez, Kaśtovsky, Echenique, & Salerno, Citation2018). The full genome sequencing in this study and the complete nifHDK gene cluster suggest that secondary control and suppression of nitrogen fixation has occurred, and analysis of the epigenome is needed to elucidate this. This genetic study highlights how care is needed when using physiological observations to support genetic hypotheses.
Of particular interest is the change in toxin cell quota: all four daughter cultures produce CYN and deoxy-CYN in similar proportions (2.5 ± 0.4% deoxy-CYN), but the cell quota (QCYN) had increased significantly in cultures A–C and decreased in culture D compared to the QCYN measured in CS-506i in Willis et al. (Citation2015). Previous research into the drivers of cylindrospermopsin production rates using short-term laboratory experiments established that the QCYN of cells was stable under a range of conditions, and thus the toxin is constitutively produced (Davis, Orr, Boyer, & Burford, Citation2014; Orr, Willis, & Burford, Citation2018; Pierangelini et al., Citation2015; Willis et al., Citation2015). The QCYN changes measured in the four daughter cultures show that over a longer time period, years rather than weeks, the CYN production rate can change and appears to be typically increasing under culture conditions. There were no changes in the cyr biosynthesis gene cluster between cultures, with 100% synteny, strengthening the previous suggestion that cell quota is regulated through post-translational controls, such as the rate of enzymatic synthesis or molecular degradation (Sinha et al., Citation2014; Willis et al., Citation2018).
Genetic changes between the four cultures occurred via gene loss, gene gain and SNPs, taking place across 22% of the genome. The genome modifications appear to have occurred throughout the genome, and no clear genomic islands were identified (Pantůček et al., Citation2018). Only 9% of genes in the core genome contained SNPs, suggesting that gene loss/gain appears is the principal mechanism driving culture adaptation and supporting the existence of a plasmid. Approximately 1% of the pangenome comprised unique proteins, either of bacterial origin, suggesting HGT events, or proteins specific to R. raciborskii suggesting recent parallel gene loss events across the four living cultures. The R. raciborskii specific proteins occurred in the genomes of CS-506A and CS-506D, suggesting they have been recently lost independently from CS-506B and CS-506C. In the case of CS-506B this loss has occurred in the last two years, as well as one gene gain event. The variable portion of the genome is apparently unstable, with frequent gene changes occurring.
Genes gained are bacterial in origin and presumably come from co-occurring heterotrophic bacteria. The cultures were not axenic, and each culture was contaminated with heterotrophic bacteria, principally dominated by an Alphaproteobacteria with fewer numbers of Betaproteobacteria and Chitinophagaceae. The dominant bacterium in each culture was different: Alsobacter in CS-506A, Roseomonas in CS-506B and CS-506D, and a Rhodobacterales in CS-506C. The genes gained were not closely related to the dominant contaminating bacteria, suggesting the genes may not have been recent HGT events, or came from bacteria occurring in low frequency or previously dominant. Whether the dominant bacterial type has been stable over time, has progressively shifted or shows variations or cycles in dominance in one or more of CS-506A-D was not within the scope of this study.
The relationship of the genomes, by MAFFT alignment, did not correspond to the time since separation from the parent culture, suggesting that rates of genetic drift fluctuate, potentially corresponding to changes in laboratory conditions. Typically, genetic drift promotes genome reduction (Kuo, Moran, & Ochman, Citation2009), and the genomes of the four current cultures, CS-506A–D, are smaller than the culture sequenced in 2010, CS-506i. The genome tree also did not match the morphology/physiology tree, further indicating that physiological changes are not the result of genetic mutations, but rather arise from changes in regulation. The fact that these changes are hereditary and become dominant in the culture further suggests that changes at the epigenome level are occurring.
Approximately 45% of the variable genes are hypothetical proteins: the characterized proteins encompass transporters, DNA repair and transcriptional regulation, photosynthesis, and some nitrogen regulation. These are similar to the functions described in the variable genome of closely related R. raciborskii strains (Willis et al., Citation2018), suggesting that the core and variable genomes are defined. The variable genome was ~ 10% of the pangenome, showing that gene loss has occurred frequently. This suggests that the large amount of intraspecific genome diversity and flexible pangenome of the species are a result of HGT events, probably via a plasmid shared between cells. There is some evidence of the presence of a plasmid in R. raciborskii, but it has not been conclusively identified (Fuentes-Valdés, Plominsky, Allen, Tamames, & Vásquez, Citation2016). This indicates that HGT may be a mechanism that allows R. raciborskii to maintain intraspecific diversity to confer adaptation in a genome undergoing reduction.
Laboratory experiments designed to understand the environmental niche of R. raciborskii are complicated by comparing data from a single isolated strain with the response of a native population that contains intraspecific diversity. This means that any laboratory experiment lacks the diversity of response of the species. The physiological changes of the four daughter cultures characterized in this study and compared to the 2006 and 2012 cultures show that these current cultures are no longer representative of the exact niche that this cell occupied when first isolated. However, the changes that have occurred are not beyond the breadth of variation found across ecotypes of R. raciborskii, when compared to other studies (e.g. Xiao, Willis, & Burford, Citation2017). Therefore, careful interpretation of results is always required when using laboratory cultures for ecological questions: it is necessary to recall that the ecophysiological plasticity of R. raciborskii populations means that there is greater adaptive potential within a population compared to an isolated culture.
Cryopreservation is frequently and rightly advocated to limit genetic drift in long term algal culture curation, and is suitable for many freshwater cyanobacteria, but in this study, we used strains that have yet to be cryopreserved. This serendipitously allowed the long-term genome evolution over 23 years to be studied providing insights into pangenome–phenotype interactions.
Acknowledgements
This project was funded by the Environomics Future Science Platform, CSIRO, led by Dr. Oliver Berry, and Bioplatforms Australia. Sequencing was performed at the Ramaciotti Centre for Genomics, UNSW. AW thanks Prof. M. Burford and A. Chuang for providing cultures of CS-506 B, C and D. The authors also thank Cathy Johnston and Ros Watson for maintaining ANACC/ANASS.
Disclosure statement
No potential conflict of interest was reported by the authors.
Additional information
Funding
References
- Abreu, V. A. C., Popin, R. V., Alvarenga, D. O., Schaker, P. D. C., Hoff-Risseti, C., Varani, A. M., & Fiore, M. F. (2018). Genomic and genotypic characterization of Cylindrospermopsis raciborskii: Toward an intraspecific phylogenetic evaluation by comparative genomics. Frontiers in Microbiology, 9, 306.
- Aguilera, A., Gómez, E. B., Kaśtovsky, J., Echenique, R. O., & Salerno, G. L. (2018). The polyphasic analysis of two native Raphidiopsis isolates supports the unification of the genera Raphidiopsis and Cylindrospermopsis (Nostocales, Cyanobacteria). Phycologia, 57, 130–146.
- Andersen, R. (Ed.). (2005). Algal culturing techniques. London: Academic Press.
- Aziz, R. K., Bartels, D., Best, A. A., De Jongh, M., Disz, T., Edwards, R. A., … Zagnitko, O. (2008). The RAST Server: Rapid annotations using subsystems technology. BMC Genomics, 8, 75.
- Berge, T., Daugbjerg, N., & Hansen, P. J. (2012). Isolation and cultivation of microalgae select for low growth rate and tolerance to high pH. Harmful Algae, 20, 101–110.
- Burford, M. A., Beardall, J., Willis, A., Orr, P. T., Magalhaes, V. F., Rangel, L. M., … Neilan, B. (2016). Understanding the winning strategies used by the bloom-forming cyanobacterium Cylindrospermopsis raciborskii. Harmful Algae, 54, 44–53.
- Burford, M. A., Willis, A., Chuang, A., Man, X., & Orr, P. (2018). Recent insights into physiological responses to nutrients by the cylindrospermopsin producing cyanobacterium Cylindrospermopsis raciborskii. Chinese Journal of Oceanography and Limnology, 36, 1032–1039.
- Costas, E., Nieto, B., Lopez-Rodas, V., & Salgado, C. (1998). Adaptation to competition by new mutation in clones of Alexandrium minutum. Evolution, 52, 610–613.
- Davis, T. W., Orr, P. T., Boyer, G. L., & Burford, M. A. (2014). Investigating the production and release of cylindrospermopsin and deoxy-cylindrospermopsin by Cylindro- spermopsis raciborskii over a natural growth cycle. Harmful Algae, 31, 18–25.
- Demott, W. R., & McKinney, E. N. (2015). Use it or lose it? Loss of grazing defences during laboratory culture of the digestion-resistant green algae Oocystis. Journal of Plankton Research, 37, 399–408.
- Eaglesham, G. K., Norris, R. L., Shaw, G. R., Smith, M. J., Chiswell, R. K., Davis, B. C., … Moore, M. R. (1999). Use of HPLC–MS/MS to monitor cylindrospermopsin, a blue-green algal toxin, for public health purposes. Environmental Toxicology, 14, 151–154.
- Fuentes-Valdés, J. J., Plominsky, A. M., Allen, E. E., Tamames, J., & Vásquez, M. (2016). Complete genome sequence of a cylindrospermopsin-producing cyanobacterium, Cylindrospermopsis raciborskii CS505, containing a circular chromosome and a single extrachromosomal element. Genome Announcements, 4, e00823–16.
- Good, B. H., McDonald, M. J., Barrick, J. E., Lenski, R. E., & Desai, M. M. (2017). The dynamics of molecular evolution over 60,000 generations. Nature, 551, 45–50.
- Kuo, C.-H., Moran, N. A., & Ochman, H. (2009). The consequences of genetic drift for bacterial genome complexity. Genome Research, 19, 1450–1454.
- Lakeman, M. B., & Cattolico, R. A. (2007). Cryptic diversity in phytoplankton cultures is revealed using a simple plating technique. Journal of Phycology, 4, 662–674.
- Lakeman, M. B., von Dassow, P., & Cattolico, R. A. (2009). The strain concept in phytoplankton ecology. Harmful Algae, 8, 746–758.
- Langmead, B., Trapnell, C., Pop, M., & Salzberg, S. L. (2009). Ultrafast and memory-efficient alignment of short DNA sequences to the human genome. Genome Biology, 10, R25.
- Larsson, J., Nylander, J. A. A., & Bergman, B. (2011). Genome fluctuations in cyanobacteria reflect evolutionary, developmental and adaptive traits. BMC Evolutionary Biology, 11, 187.
- Lenski, R. E. (2017). Experimental evolution and the dynamics of adaptation and genome evolution in microbial populations. The ISME Journal, 11, 2181–2194.
- Murphy, L. S. (1978). Biochemical taxonomy of marine phytoplankton by electrophoresis of enzymes. II. Loss of heterozygosity in clonal cultures of centric diatoms Skeletonema costatum and Thalassiosira pseudonana. Journal of Phycology, 14, 247–250.
- Orr, P. T., Willis, A., & Burford, M. A. (2018). Application of first order rate kinetics to explain changes in bloom toxicity – The importance of understanding cell toxin quotas. Chinese Journal of Oceanography and Limnology, 36, 1063–1074.
- Overbeek, R., Olson, R., Pusch, G. D., Olsen, G. J., Davis, J. J., Disz, T., … Stevens, R. (2014, January). The SEED and the Rapid Annotation of microbial genomes using Subsystems Technology (RAST). Nucleic Acids Research, 42, D206–14.
- Pantůček, R., Sedláček, I., Indráková, A., Vrbovská, V., Mašlaňová, I., Kovařovic, V., … Doškař, J. (2018). Staphylococcus edaphicus sp. nov., isolated in Antarctica, harbors the mecC gene and genomic Islands with a suspected role in adaptation to extreme environments. Applied and Environmental Microbiology, 84, e01746–17.
- Petkau, A., Stuart-Edwards, M., Stothard, P., & Domselaar, G. V. (2010). Interactive microbial genome visualization with GView. Bioinformatics, 26, 3125–3126.
- Piccini, C., Aubriot, L., Fabre, A., Amaral, V., González-Piana, M., Giani, A., … Bonilla, S. (2011). Genetic and eco-physiological differences of South American Cylindrospermopsis raciborskii isolates support the hypothesis of multiple ecotypes. Harmful Algae, 10, 644–653.
- Pierangelini, M., Sinha, R., Willis, A., Burford, M. A., Orr, P. T., Beardall, J., & Neilan, B. A. (2015). Constitutive cylindrospermopsin pool size in Cylindrospermopsis racirborskii under different light and CO2 partial pressure conditions. Applied and Environmental Microbiology, 81, 3069–3076.
- R Core Team. (2017). R: A language and environment for statistical computing. Vienna, Austria: R Foundation for Statistical Computing. Retrieved from https://www.R-project.org/
- Saker, M., Neilan, B. A., & Griffiths, D. J. (1999). Two morphological forms of Cylindrospermopsis raciborskii (Cyanobacteria) isolated from Solomon Dam, Palm Island, Queensland. Journal of Phycology, 35, 599–606.
- Seemann, T. (2014). Prokka: Rapid prokaryotic genome annotation. Bioinformatics, 30, 2068–2069.
- Sinha, R., Pearson, L. A., Davis, T. W., Muenchhoff, J., Pratama, R., Jex, A., … Neilan, B. A. (2014). Comparative genomics of Cylindrospermopsis raciborskii strains with differential toxicities. BMC Genomics, 15, 83.
- Stucken, K., John, U., Cembella, A., Murillo, A. A., Soto-Liebe, K., Fuentes-Valdes, J. J., … Glöckner, G. (2010). The smallest known genomes of multicellular and toxic cyanobacteria: Comparison, minimal gene sets for linked traits and the evolutionary implications. PLoS One, 5, e9235.
- Thompson, A. S., Rhodes, J. C., & Pettman, I. (1988). Culture collection of algae and protozoa, catalogue of strains. Swindon, UK: National Environmental Research Council.
- Willis, A., Adams, M. P., Chuang, A. W., Orr, P. T., O’Brien, K. R., & Burford, M. A. (2015). Constitutive toxin production under various nitrogen and phosphorus regimes of three ecotypes of Cylindrospermopsis raciborskii ((Woloszynka) Seenayya et Subba Raju). Harmful Algae, 47, 27–34.
- Willis, A., Woodhouse, J. N., Ongley, S. E., Jex, A. R., Burford, M. A., & Neilan, B. A. (2018). Genome variation in nine co-occurring toxic Cylindrospermopsis raciborskii strains. Harmful Algae, 73, 157–166.
- Woelkerling, W. J., Kowal, R. R., & Gough, S. B. (1976). Sedgwick-rafter cell counts: A procedural analysis. Hydrobiologia, 48, 95–107.
- Xiao, M., Willis, A., & Burford, M. A. (2017). Differences in cyanobacterial strain responses to light and temperature reflect species plasticity. Harmful Algae, 62, 84–93.
- Xu, L., Dong, Z., Fang, L., Luo, Y., Wei, Z., Guo, H., … Wang, Y. (2019). OrthoVenn2: A web server for whole-genome comparison and annotation of orthologous clusters across multiple species. Nucleic Acids Research, 47, W52–W58.