
ABSTRACT
We evaluated the associations between marine recreational fishing, stress, seafood consumption, and sleep quality in a cross-sectional questionnaire-based survey of a convenience sample of 244 fishers recruited in 2019 in Spain. Fishers’ stress levels were moderate, with a mean stress index score of 36.4 units on a scale from 14 (very low stress) to 70 (very high). Their average emotional condition was positive, with a mean index of negative affect of 7.8 units on a scale from 5 (very low negative affect) to 25 (very high). Seafood intake was low, with a mean index of seafood in diets of 38.0 units on a scale from 20 (very low seafood consumption) to 160 (very high). Fishers’ perceived quality of night sleep was good because the mean index of sleep problems was 39.5 units on a scale from 21 (very low sleep problems) to 107 (very high). Each hour of self-reported monthly fishing activity was associated with 0.016 units of lower stress score. Thus, the most engaged fishers reported up to 15.4% lower stress score than less avid fishers. Since recreational fishing is a highly accessible outdoor activity for people in older age groups, it is possible that public health could be improved by access to sustainably managed recreational fisheries. Fishing engagement was positively associated with seafood intake. Each hour of fishing per month was associated with one-unit higher seafood consumption. The higher seafood consumption observed among avid recreational fishers compared with less avid fishers might have health implications.
EDITED BY:
1. Introduction
Human populations in urbanized societies tend to carry out daily activities in increasingly denatured habitats, which negatively impacts on how people interact with others and with the environment (Inglehart Citation1990). The progressive loss of contact with natural environments has been associated with different health problems, mainly triggered by stress (Maller et al. Citation2006; Bowler et al. Citation2010). Regular access to natural areas increases people’s´ activity, reducing obesity (Björk et al. Citation2008), and tempers serious health problems related to socioeconomic inequalities, such us e.g. mortality from circulatory diseases, among other (Mitchell and Popham Citation2008).
Leisure activities can positively influence physical, psychological, and spiritual health (Mannell Citation2007). Correspondingly, a large number of studies confirm a positive association between exposure and access to natural environments and various health benefits (Hartig et al. Citation2014; van den Bosch and Sang Citation2017; White et al. Citation2019). There is also a wealth of literature describing the positive relationship between human health and recreational activities conducted in natural environments (Mitchell Citation2013; Chen et al. Citation2018; Venter et al. Citation2020), but fishing as a recreational activity is less well explored (Thompson Coon et al. Citation2011).
We obtained 114 references from a Scopus scientific database search of research papers in English without temporal restrictions by using the following key words: “recreational fisheries” OR “marine recreational fisheries” OR “angling” AND “health” OR “human health”. Once the titles and abstracts of the references were reviewed, it was found that 45 of the reviewed papers referred to a potential association between human health and well-being and recreational fishing. Most of the reviewed scientific literature (36 papers) studied negative effects derived from the consumption of polluted fish by recreational fishers (e.g. Edwards et al. Citation2001; Pulford et al. Citation2017; Taylor and Williamson Citation2017), or injuries and accidents derived from the practice of recreational fishing (Hahn et al. Citation1993; Read et al. Citation2017). Only three papers suggested some advantages for people’s health and well-being derived from recreational fishing, including psychosocial effects (Snyder Citation2007; Griffiths et al. Citation2016; Young et al. Citation2016). However, these studies are based on generic perceptions, as in the case of Australian and Solomon Island fishers venting angst and frustration (Young et al. Citation2016); informed opinion, as in the case of spiritual benefits for fly fishing anglers (Snyder Citation2007); or hypothetical data (Griffiths et al. Citation2016). Based on our review, there appear to be no studies that explicitly assess the health and wellness benefits derived from recreational fishing.
Since consuming the catch is a main motivation of recreational fishers (Cooke et al. Citation2017), in addition to reducing stress and obesity through exercise, another plausible pathway to link the practice of recreational fishing and health benefits relate to seafood consumption. Seafood contains functional components that are not present in most terrestrial organisms. These components include monounsaturated and polyunsaturated fatty acids that have shown protective effects in the prevention of cardiovascular disorders like atherosclerosis, coronary heart, and thrombotic diseases (Lands Citation1986; Alasalvar et al. Citation2011; Hosomi et al. Citation2012; Lund Citation2013). Moreover, the available evidence provides some support for a benefit of n—23 long-chain polyunsaturated fatty acids to depression illness (Appleton et al. Citation2010). Preliminary findings also suggest that high levels of omega—3 fatty acids (Murphy et al. Citation2020) and tryptophan present in seafood could improve sleep quality by increasing melatonin synthesis (St-Onge et al. Citation2016). Furthermore, seafood is an important source of different nutrients (e.g. selenium and other minerals, amino acids like taurine, peptides and proteins, carotenoids, fiber, and vitamins) that have been related to prevent antioxidative stress and some cancers, to reduce risks of asthma, diabetes, obesity, rheumatoid arthritis, and stroke, and to improve the immune system and the cognitive and visual development (Alasalvar et al. Citation2011; Hosomi et al. Citation2012; Lund Citation2013). Therefore, quantitative assessments of potential health benefits derived from recreational fishing are needed.
Recreational fishing is a popular outdoor activity worldwide, especially in high-income countries where participation rates can reach above 10% of total population (Arlinghaus et al. Citation2014). Recreational fishers tend to be of relatively advanced age (Steffens and Winkel Citation2002; Herfaut et al. Citation2013; Pita et al. Citation2018), and seafood consumption has been found to increase with age (Olsen Citation2003). Therefore, finding a link between the practice of recreational fishing and the health and well-being of its practitioners has significant implications for public health in high-income countries with aging populations (Pammolli et al. Citation2012).
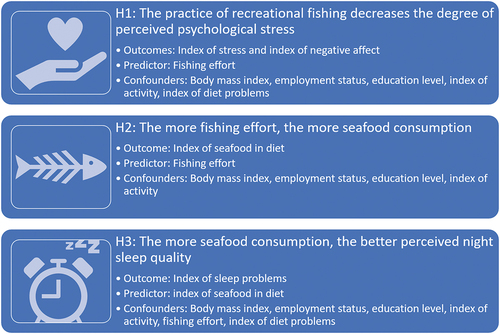
In this study, we evaluated the associations of recreational fishing with major determinants of health and well-being in Galicia (North West Spain) by evaluating three hypotheses: (1) recreational fishing is associated with improvements in the perceived psychological stress of fishers; (2) an increase in fishing effort is associated with more seafood consumption among recreational fishers; and (3) higher seafood consumption among fishers is associated with perceived better quality of night sleep.
2. Material and methods
2.1. Study design
We performed a cross-sectional study (May – December 2019) targeting a sample of 860 highly engaged marine recreational fishers. They represented 7,122 members of the 30 fishing clubs integrated into the Galician Federation of Responsible Marine Recreational Fishing and Sailing, a private non-profit entity created in 1999 to promote the sustainable practice of recreational fishing and other leisure activities, and the main recreational fishing association in Galicia. The leaders of this fishers’ association and its constituent clubs collaborated in the study from its initial phase to its completion.
In collaboration with the fishers’ association, we organized six events with members of the 30 fishing clubs in key localities around the region where we informed about the objectives of the research and provided ethical and logistical information about participation in the survey. Fishers could collect and complete our anonymous, self-administered questionnaire at these events, or at any time from their club and return them by mail using the stamped addressed envelopes we provided. An incentive program was established consisting of the distribution of merchandise from the project (cotton peak caps) to the attendees, and raffles of fishing gear (fishing rods, reels, and lures) at meetings.
We designed the questionnaire to obtain information on fishers’ perceived levels of psychological stress, seafood consumption in their diet, and on their perceived quality of night sleep as outcomes of hypotheses 1, 2 and 3, respectively (). We obtained information on the degree of recreational fishing effort as a predictor of hypothesis 1 and 2, while degree of seafood consumption was used as a predictor of hypothesis 3 (). Anthropometric and socioeconomic data, along with information about other sports and physical activities, and quality of overall diet were used as potential confounders (). Additionally, we obtained information on fishers’ ages, fishing platforms (shore or boat), and fishing gears (hook and line or spear gun) to address differences with respect to the total population. For details about the questions see Appendix A of the Supplementary Material. Due to the fact that the participation of women in this fishing community is negligible (less than 1% of fishers are women (Pita et al. Citation2018)) we did not assess the role of gender in this study. The fishers took 15–30 minutes to complete the questionnaire.
Figure 1. Diagram showing assessed outcomes, predictors, and confounders of the three studied hypotheses.
This study followed the Strengthening the Reporting of Observational Studies in Epidemiology (STROBE) guideline for cross-sectional studies (Von Elm et al. Citation2007) (See Appendix B). The University of Santiago de Compostela (Spain) Bioethics Committee determined that given the use of anonymous data the study was exempt from the need for review and informed consent from participants.
2.2. Data processing
2.2.1. Psychological stress
The construct of “psychological stress” is based on a person’s response to the interaction of acute or chronic stressors with the mental structure of the individual and other external modulating factors, such as socioeconomic level (Grzywacz et al. Citation2004). The stress level can thus be measured by assessing the following two components:
Perceived stress, which is the first response to the stressor (Cohen et al. Citation1983). Several studies have identified this as an important risk factor for the development of many diseases and aggravation of the symptoms of others (Anda et al. Citation1992; Cohen et al. Citation1993; Richardson et al. Citation2012). We measured perceived stress by modifying the 10-question Perceived Stress Scale (PSS) whereby higher scores were associated with greater vulnerability to depressive symptoms and more frequent colds (Cohen et al. Citation1995). We translated the PSS into Spanish and added four questions to improve ease of understanding of the questionnaire (see Appendix A). Thus, our modified PSS consisted of 14 questions about the previous two-month period with responses graded along a five-point scale (1-5). An index of stress was developed using a scale from 14 (meaning very low stress problems) to 70 (very high stress problems) by reversing response scores following (Cohen et al. Citation1983) and adding scores together. The mode of each variable of the index was used to fill gaps in the information provided by some of the fishers (14-25 missing data). The value of the Cronbach’s alpha indicated that the index of stress was consistent (α = 0.83; ).
Degree of negative affect, which accounts for the affective state characterized by aversive emotional states. Lower levels of negative affect are indicative of a state of calm and serenity, while higher levels indicate a high level of distress (Bolger et al. Citation1989). We specifically assessed fishers’ feelings of disgust, anger, fear, nervousness, and guilt experienced during the previous month. We adapted five questions using a five-point scale (from 1 to 5) from the cognitive-affective subscale of the Beck Depression Inventory (BDI). The BDI is a 13-item self-report instrument that is highly reliable for gathering information recalled over a one-month period, and designed to assess a wide variety of symptoms and attitudes related to depression (Beck et al. Citation2000). An index of negative affect was obtained by adding the scores of the five questions scaled from 5 (very low negative affect), to 25 (very high). The mode of each variable of the index was used to fill gaps in the information provided by some of the fishers (19-25 missing data). The internal consistency of the index of negative affect was high (α = 0.80; ).
Table 1. Physical and socioeconomic characteristics of the participants, and results of the indices obtained from fishers’ responses to a self-administrated questionnaire. We show the Cronbach’s alpha (α) of the indices.
2.2.2. Fishers’ diet
Overall food patterns, rather than single nutrients, are better to investigate aspects related to food consumption (Hu Citation2002). The Food Frequency Questionnaire (FFQ) used in this study was a modified version of a questionnaire with 118 food items that has been shown to be a highly reproducible and reliable scale to assess nutrient intake (Martin-Moreno et al. Citation1993). Our FFQ suits the Spanish cultural background and geographical differences across the country to obtain information on fishers’ complete diet. We asked about the consumption of 97 different food items over the last year (portions, or units; see Appendix A), following the main food categories of the FFQ: drinks, oils, seafood, meat, vegetables, fruits, cereals, dairy, and miscellanea. Responses were graded according to an eight-point scale (1–8). An index of diet problems was obtained by adding the item scores together, scaled from 97 (very low diet problems) to 776 (very high). Potentially healthy (e.g. water) and unhealthy (e.g. energy drinks with caffeine and sugar) food items were included in the index of diet problems in a scale where 1 meant high consumption and 8 meant low consumption. The mode of each variable of the index was used to fill gaps in the information provided by some of the fishers (24–76 missing data). The internal consistency of the index of diet problems was high (α = 0.95; ).
In our FFQ we specifically asked about frequency in the diet of 20 different fish and shellfish species to take into account potential variations in nutritional value (Öhrvik et al. Citation2012). These 20 questions were used to obtain an index of seafood in diet by adding the scores of the 20 seafood items together, scaled from 20 (very low consumption) to 160 (very high). The mode of each variable of the index was used to fill gaps in the information provided by some of the fishers (28–36 missing data). The internal consistency of the index of seafood in the diet was high (α = 0.94; ).
2.2.3. Night sleep quality
Fishers’ perceived quality of night sleep was assessed through a combination of the perceived degree of satisfaction of night sleep and its duration, established according to the Oviedo Sleep Questionnaire (OSQ), valid to assess insomnia and hypersomnia (Bobes et al. Citation2000). We expanded the OSQ by adding two questions related to nap habits and use of digital screens before night’s rest, asking 20 questions about the immediate two-month period with responses graded in a five-point scale (1–5) and one in a 1–7 scale. An index of sleep problems was obtained by adding the scores of the 21 items together, scaled from 21 (very low sleep problems) to 107 (very high). The mode of each variable of the index was used to fill gaps in the information provided by some of the fishers (11–29 missing data). The internal consistency of the index of sleep problems was high (α = 0.86; ).
2.2.4. Fishing effort and other physical activities
We obtained the degree of recreational fishing activity (i.e. fishing effort measured in h·month−1) during the previous three months. Cases with missing data were excluded from the analyses (N = 15). We also obtained information on the practice of other sports and physical activities as a potential confounder. We implemented a valid and reliable questionnaire developed by Baecke et al. (Citation1982) used in epidemiological studies to measure physical activity in the previous week. We considered all types of habitual physical activity, including work activity, sport, and leisure time, at four levels of intensity, including daytime rest, and frequency of practice. We asked seven questions about the frequency of each of the four intensity levels with responses graded, or converted, using a seven-point scale (1–7) to build an index of activity, scaled from 4 (very low activity) to 154 (very high). Cases with missing data (N = 66) were excluded from the analyses. The internal consistency of the index of activity was acceptable (α = 0.63; ).
2.2.5. Physical and social characteristics
Anthropometric data was obtained regarding age, weight, and height. We calculated the Body Mass Index (BMI) from the latter two. Cases with missing data were excluded from the analyses (N = 7). Additionally, we estimated the socioeconomic status of the fishers by asking about employment status and educational level (Shavers Citation2007). Cases with missing data were excluded from the analyses (N = 19 and N = 18, respectively).
2.3. Statistical analyses
Generalized linear models (GLMs) were used to analyze relationships between the different outcomes, predictors and confounding variables by using the statistical software R ver. 4.0.2 (R Core Team Citation2019). Continuous potential predictors and confounding variables were transformed into factors by using tertiles and quartiles of each distribution, resulting in variables with three or four levels, respectively.
To test the association between the degree of fishers’ perceived psychological stress and fishing activity (hypothesis 1; ), fits of fishing effort as predictor of stress and negative affect indexes were obtained from unadjusted models, whereas a backward stepwise selection procedure was followed to fit adjusted models (i.e. from saturated models to final models, removing non-significant variables at each step). The same procedure was followed to assess if seafood intake in fishers’ diets could be predicted by fishing activity (hypothesis 2). In this case the index of seafood in diet was included as an outcome to assess the performance of fishing effort, among other predictors and confounding variables (). Finally, the index of sleep problems and the index of seafood in diet were used to assess association between perceived night sleep quality and seafood consumption (hypothesis 3; ).
Fit of numeric and factorized variables, and that of different error structures and link functions were compared in the different model selection procedures. The best models were selected based on the Akaike’s information criterion (Akaike Citation1973), goodness of fit (R2), and appropriate residual structure. Interactions between different variables and the inclusion of polynomial terms were also assessed. Models with highly dispersed and anomalous distribution of residuals were discarded. Furthermore, our primary analysis for handling missingness would be reasonable under Missing Completely at Random (MCAR) missingness. As a sensitivity analysis for possible departures from MCAR, we used multiple imputation by chained equations (MICE) (Azur et al. Citation2011) as implemented in the R “mice” library of R (Van Buuren and Groothuis-Oudshoorn Citation2010). We generated 40 imputed datasets and used the following variables in our imputation model: 14 variables to assess stress, 5 to assess negative affect, 97 variables to assess fishers’ diet, including 20 variables to assess seafood consumption, and 20 variables to assess sleep quality (see Appendix A).
The single role of the different food items to fishers’ perceived night sleep quality was analyzed by a SIMPER procedure (Clarke Citation1993) included in the “vegan” library of R (Oksanen et al. Citation2019), performing pairwise comparisons to estimate the average importance of each diet element to the average overall Bray-Curtis dissimilarity.
3. Results
We obtained and analyzed 244 questionnaires from recreational fishers, representing 27.9% of the active fishers in the clubs (i.e. 12.1% of fishers belonging to the 30 clubs). Mean age of respondents was 55.0 years (95%CI, 53.2–57.0 years; ranging from 16 to 85), while the mean age of the Galician population is 47.5 years (Xunta de Galicia Citation2019). Mean BMI of respondents was 27.4 (95%CI, 26.7–28.0), which is equivalent to a weight higher than normal, or overweight. In Galicia, up to 46.7% of population is overweight or obese (Xunta de Galicia Citation2019). Slightly less than half of the fishers who answered this question (N = 225) were retired (40.0% of answers), while in Galicia 32.1% of the total population is retired (Xunta de Galicia Citation2019). Most respondents finished high school (37.6%), secondary school (22.6%) or primary school, or obtained a university degree (17.3%, each), while few (5.3%) did not complete any studies (). In Galicia, 2.1% of people have not completed any study, 42.9% finished primary school, 25.1% finished secondary school, 19.2% finished high school, and 10.7% finished university studies (Xunta de Galicia Citation2019).
Average fishing effort was 57.9 h·month−1 (95%CI, 49.9–67.1 h·month−1). Fishers’ preferred fishing from boats (68.8%) or from the shore (45.9%). Their favorite gear was hook and line (97.5%) while some also practiced spear fishing (11.5%). Mean fishing effort was higher than average boat anglers in Galicia (48 h·month−1 in summer, the busiest season (Pita et al. Citation2018)). Moreover, fishers showed a relatively high degree of engagement in other sports and physical activities, since the mean index of activity was 51.1 units (95%CI, 45.7–56.7 units) on a scale from 4 (very low activity rate) to 154 (very high) (). As a reference, the Galician population spends an average of 43 minutes per day in sports and outdoor activities (Xunta de Galicia Citation2019), which exceeds the minimum daily recommendation of the World Health Organization (21.4–42.9 minutes per day of moderate-intensity aerobic physical activity) (World Health Organization Citation2020).
Fishers’ average perceived stress was moderate since the mean index of stress was 36.4 units (95%CI, 35.6–37.3 units) on a scale from 14 (very low stress), to 70 (very high). Similarly, up to 34.8% of the Galician population also felt tense (in the last four weeks) on a regular basis (from sometimes to always) (Xunta de Galicia Citation2019). On the contrary, fishers’ emotional condition could be considered positive, since the mean index of negative affect was 7.8 units (95%CI, 7.4–8.2 units) on a scale from 5 (very low negative affect) to 25 (very high) (). Similarly, up to 70.0% of the Galician population never, or rarely felt discouraged and depressed (in the last 4 weeks) (Xunta de Galicia Citation2019).
Fishers showed moderately unhealthy dietary habits, with a mean index of diet problems of 474.2 units (95%CI, 469.9–478.6 units) on a scale from 97 (very low diet problems) to 776 (very high). Furthermore, seafood intake was relatively low, since the mean index of seafood in the diet was 38.0 units (95%CI, 35.5–40.1 units) on a scale from 20 (very low seafood intake, i.e. less than one ration per month and seafood species) to 160 (very high, i.e. more than three rations per day) (). In Galicia, 4.3% of the average annual household shopping bag (in weight) corresponds to seafood (30.3 kg·year−1) (Gobierno de España Citation2020).
Finally, fishers’ perceptions about their quality of night sleep were good, since the mean index of sleep problems was 39.5 units (95%CI, 38.2–40.7 units) on a scale from 21 (very low sleep problems) to 107 (very high) (). The quality of the night’s rest of the general population is also good, since only 22.4% of people in Galicia report difficulty falling asleep on a regular basis (from some nights to every night); up to 60.0% of Galicians never, or rarely awake several times while sleeping; and only 23.6% of population regularly wake up too early (Xunta de Galicia Citation2019).
3.1. Association between fishing effort and psychological stress
Fishers’ practice of recreational fishing (i.e. fishing effort) was linked to a reduced degree of psychological stress. According to the unadjusted model (p = 0.044; R2 = 0.018), for each hour of monthly fishing the index of stress decreased by 0.013 units (95%CI, 0.0–0.026 units) on a scale between 14 (very low stress) and 70 (very high), while perceived stress decreased by 0.016 units (95%CI, 0.003–0.029 units) according to the adjusted model (p = 0.020; R2 = 0.045) (). Thus, the most avid fishers who had fished up to 360 h·month−1 in the previous two months reported 12.8% (95%CI, 5.0–21.0%) to 15.4% (95%CI, 7.1–24.2%) lower stress than that reported by fishers that did not go fishing in the same period, according to the unadjusted and adjusted models respectively ().
Figure 2. Partial effect of fishing effort on the index of stress and on the index of negative affect of recreational fishers. We show observations (dots), predictions (thick lines) and 95% confidence intervals (thin lines) estimated by unadjusted GLM and TM, respectively. P-values, and goodness of fit of the GLM (R2) are also shown.
Table 2. Outputs of the GLM and TM fitted on the index of stress, index of negative affect, index of seafood in diet, and index of sleep problems. We show the estimated model coefficients, p-values and 95% confidence intervals for the different predictors of unadjusted, and of final adjusted models when available, and of significant confounders. The error and link structure, values of Akaike’s information criterion (AIC), and goodness of fit (R2) when possible, are also given (Q=quartile-factorized variable).
In addition to fishing effort, the adjusted model also showed differences in the index of stress by education (continuous confounder), with lower stress associated with higher education levels ().
The index of negative affect was not significantly related to fishing effort (p = 0.263; , ). Moreover, although none of the adjusted models was significant, retired fishers showed lower negative affect than active fishers in the unadjusted models, while in general lower negative affect tended to be shown by the most physically dynamic people ().
3.2. Association between fishing effort and seafood consumption
The more frequently fishers practiced recreational fishing the higher their intake of seafood (p < 0.001; R2 = 0.022; ). According to the unadjusted model (none of the adjusted models were significant), for each hour of monthly fishing the index of seafood in diet increased by 1.0 unit (95%CI, 1.0006 1.0012 units) on a scale from 20 (very low seafood consumption, i.e. between one and three rations per month and seafood species) to 160 (very high, i.e. more than three rations per day) (). Thus, the most avid fishers (360 h·month−1 in the last two months) reported on average a 27.6% (95%CI, 23.2–31.9%) higher seafood intake than fishers that did not go fishing (). The index of activity also showed a positive association to the index of seafood in diet, with higher levels of physical activity associated with higher seafood consumption (p < 0.001; ).
Figure 3. Partial effect of fishing effort on the index of seafood in the diet of recreational fishers. We show observations (dots), predictions (thick lines) and 95% confidence intervals (thin lines) estimated by unadjusted TM. P-value is also shown.
3.3. Association between seafood consumption and night sleep
We found no evidence that seafood consumption was associated with perceived sleep quality of recreational fishers. This could be due to the similar frequency of consumption of the different seafood species whereby fishers ate less than one portion per month of all species (mode = 1), except squid and octopus which were eaten one to three times per month (mode = 2). However, we also found no evidence that fishers’ overall diet was associated with perceived quality of night rest. On the other hand, people with higher degrees of physical activity tended to show lower sleeping problems ().
The exploratory SIMPER procedure showed some variability in the potential role of the different seafood species to differences in fishers’ perceived night sleep quality i.e. in the categorized index of sleep problems in low (<39), medium (39–49), and high (≥50) (). In addition to the generic “other finfish”, the species more relevant to eventual differences in fishers’ perceived sleep quality were tuna, hake, and bivalves ().
Figure 4. Output of a SIMPER procedure showing the contribution of each seafood species to differences in fishers’ index of sleep problems. The median of the index of sleep problems scores is shown with a dashed line.
Notably, the importance of seafood to fishers’ perceived night sleep quality was relatively lower than that of other main food categories. The most important seafood for differences in sleep quality as reported by fishers was the generic “other” when the cumulative dissimilarity achieved approximately half of the total ().
Table 3. Output of a SIMPER procedure showing the average contribution of each food item of diet to differences in the tertile-factorized index of sleep problems (s=with sugar; c=with caffeine; sq=squeezed). The different food items have been ordered based on their average relative contribution.
4. Discussion
We demonstrated that the practice of recreational fishing was associated with lower levels of perceived stress in our sample of fishers, but we found no association with negative affect, i.e. aversive emotional states. We also demonstrated that avid recreational fishers showed higher seafood intake in their diets, but no association was found with perceived night sleep quality. In fact, seafood was less important to night rest, compared to other food groups.
4.1. Importance
To our knowledge, this study is the first to provide empirical evidence about the benefits for fishers’ health and well-being derived from recreational fishing. Our results are in line with a growing number of studies that describe these types of benefits for practitioners of leisure activities in natural areas (e.g. Mitchell and Popham Citation2008; Bowler et al. Citation2010; Hartig et al. Citation2014), including theoretical and qualitative studies on recreational fisheries (Snyder Citation2007; Griffiths et al. Citation2016; Young et al. Citation2016). We found that perceived psychological stress was lower among retired fishers and decreased with education level, and with the practice of sports and other activities, as stated by other authors (Matthews and Gallo Citation2011; Santiago et al. Citation2011; Cohen and Janicki‐deverts Citation2012). However, we found no evidence of an association between perceived psychological stress and diet quality, a relationship that was established in previous studies (Moore and Cunningham Citation2012).
It has been suggested that the promotion of recreational outdoor activities has collective benefits for society, in the sense of less pressure on public health systems (Maller et al. Citation2006; van den Bosch and Sang Citation2017; White et al. Citation2019). In this regard, recreational fishing is a relatively inexpensive and easily accessible activity for all ages, including older people, since it is not physically demanding (Ainsworth et al. Citation2000). Therefore, our results may have relevant socioeconomic implications for public health systems, especially in countries with aging populations. In addition to the direct economic benefits derived from recreational fishing for local populations, as recognized by international institutions (e.g. European Parliament Citation2018), pressure on public health systems could also be relieved by better development of recreational fisheries, among other outdoor activities. For instance, although men and women involved in outdoor consumptive activities like recreational fishing may have different access motivations and expected outcome could vary between sexes (Morales-Nin et al. Citation2021), gender gap in recreational fishery access, highly mediated by social norms around gender roles (Lee et al. Citation2009), should be addressed so that more women could enjoy the potential health benefits of recreational fishing.
Contrary to the results obtained by other authors (Peuhkuri et al. Citation2012; Chaput Citation2014; St-Onge et al. Citation2016), we did not observe an association between diet quality and night rest. The relatively low number of observations obtained, among other potential sources of bias that are discussed in the next section, could have masked this association. The fact of not having incorporated factors that could potentially affect the quality of sleep due to the limitations derived from the inclusion of sensitive questions in a questionnaire, already very complex and complete, such as the use of drugs (Vitiello Citation1997; Wong et al. Citation2004; Lund et al. Citation2010), or the type of work (Åkerstedt et al. Citation2002; Dahlgren et al. Citation2005; Vahle-Hinz et al. Citation2014) may also have influenced this output. Furthermore, we found that seafood was less relevant to sleep quality compared with other food groupsFootnote1. The small variability in seafood consumption in our sample may have contributed to the lack of association with nighttime sleep. Temporal variability in exposures and outcomes might also have led to a measurement error that could have caused some attenuation effect. For instance, the supply of some food items, e.g. fruits and vegetables, but also seafood species, typically experience seasonal variations through the year, which could have affected the association with psychological stress, or night’s rest (measured during the last weeks). However, it is expected that the variety of food items in the questionnaire, and seafood (with up to 20 different items), included substitutes with similar market availability, fishing catchability and nutritional properties.
Moreover, the so-called “ecological fallacy” (Piantadosi et al. Citation1988) could have been problematic if the pattern observed at the larger aggregated unit (one year in the case of associations with diet) was not equivalent to what would be observed at the smaller unit (last weeks in the case of psychological stress, or night’s rest). In fact, it cannot be ruled out that eventual short-term benefits (e.g. for night’s rest after consuming seafood during the last weeks) change with time and even decline because of trade-offs (e.g. toxic contents in flesh). It is necessary to take into account that some fish and shellfish contain elements such as heavy metals (Blanco et al. Citation2008) among other contaminants that could counterbalance the potential benefits of a diet rich in seafood (Rodríguez-Hernández et al. Citation2016), including night’s rest (Arito et al. Citation1983; Parmalee and Aschner Citation2017).
Moreover, seafood are often misidentified in Spain (Horreo et al. Citation2019) which makes seafood-health associations challenging to interpret given the differences between species in nutrient and contaminant content (Gribble et al. Citation2016). Tunas, hake, and bivalves were likely to be relatively more important than other seafood species in relation to perceived sleep quality. Notably, dishes cooked with these ingredients have, in previous research, shown very high levels of tryptophan content (Öhrvik et al. Citation2012). Therefore, in accordance with other studies (Hansen et al. Citation2014; Del Brutto et al. Citation2016; Liu et al. Citation2017), benefits derived from diets rich in seafood for the quality of night rest should not be disregarded. In addition to the association between fishing engagement and seafood consumption demonstrated in this study, recreational fishers buy more expensive, high-quality fresh fish in local markets than most people (Morales-Nin et al. Citation2013). This has major implications for peoples’ health in a context of epidemic obesity because the trend towards progressively impoverished diet habits (Kosti and Panagiotakos Citation2006) exists in countries with higher seafood consumption such as Japan, Portugal and Spain (FAO Citation2020).
4.2. Limitations
4.2.1. Convenience sampling and lack of representativeness
Even though non-randomized sampling, including self-administrated questionnaires like the one used in our study, are less time and money consuming than other methods, they may have limitations in terms of their representativeness if some members of the population are less likely to be included than others, and therefore the sample is not representative of the overall population (Venes Citation2017). However, immigrative selection bias is a problem when the participation is affected by both the exposure and the outcome, which is not clear in the associations studied here.
As a general reference, all the demographic variables measured in our sample (mean age, BMI, employment situation, and study level), and most of the variables related to health and well-being (mean physical activity, stress, negative affect, and quality of night sleep) did not differ from the average data available for the Galician population. Nevertheless, it is possible that the fishers who participated in this study show higher consumption of seafood per capita (about 45 kg·year−1) than the Galician average (30 kg·year−1). The consumption of their own catches, and a higher demand for marketed fresh seafood shown by recreational fishers in Spain (Morales-Nin et al. Citation2013) could explain this difference.
Differences in age, fishing platform and gear, and in fishers’ avidity (i.e. fishing engagement, measured as fishing effort) between the sample and the studied population are relevant potential sources of bias in recreational fisheries research (Pollock et al. Citation1994). Socioeconomic profiles of the fishers who participated in our study (e.g. employment status and education level) were similar to those shown by Pita et al. (Citation2018) regarding all Galician recreational fishers. However, the mean age of fishers in this study (55 years) was more similar to that of boat anglers in Galicia (53 years), than to that of Galician shore anglers (50 years), and spear fishers (37 years) (Pita et al. Citation2018). In fact, despite shore anglers being the most common type of recreational fishers in Galicia (75% of total), followed by boat anglers (20%) and spear fishers (5%) (Pita et al. Citation2018), they participated less in this study (46% of the sample), compared to boat anglers (69%) and spear fishers (13%). Furthermore, since we specifically targeted the most active fishers in the clubs, we anticipated a greater presence of avid fishers in our study. As expected, fishers showed higher mean fishing effort in this study (58 h·month−1) than the average recreational fisher in Galicia (up to 48 h·month−1 in the case of boat anglers during summer which is the busiest season (Pita et al. Citation2018). Consequently, our results might present a higher degree of uncertainty for less avid fishers, and especially for shore anglers.
Moreover, we measured perceived stress, diet, sleep quality and physical activities with instruments designed for other populations. Although this could be problematic in some cases, we expect enough commonalities with our studied population to be applied without being a relevant source of bias.
4.2.2. Non-response bias
Non-response bias affects surveys when certain groups of fishers refuse to participate in the survey, or do not answer specific questions, affecting the representativeness of the study (Fisher Citation1996). We regard our sample as a convenience sample rather than representative due to the low response rate (McColl and Thomas Citation2000). Despite efforts made to publicize this study throughout the Galician fishing clubs, it is likely that many fishers were not aware of it because face-to-face social activity in the Galician clubs is relatively limited. Difficulties in completing a long and detailed questionnaire may also have discouraged some fishers. No trends were detected regarding the number of responses to the different questions. Therefore, MCAR assumptions regarding the procedure that we followed to impute missing data are reasonable (see Appendix C). However, it cannot be ruled out that certain groups of fishers have refused to participate in the study, e.g. because of mistrust of researchers and fisheries managers after unsatisfactory relationships in the past (Pita and Villasante Citation2019; Pita et al. Citation2020). It is difficult to estimate the extent to which our results have been affected by an eventual lack of response from specific groups of fishers.
4.2.3. Recall bias
Fishers tend to overestimate their effort, including frequency of participation (Thompson and Hubert Citation1990), when the recall period exceeds several months (Hiett and Worrall Citation1977; Pollock et al. Citation1994). Since our recall period was the previous three months it is not expected that the fishing effort has been overestimated. Nevertheless, recall bias might have affected some of the responses given regarding fishers’ perceived psychological stress because mechanisms that modulate memories of past emotional states remain unclear (Colombo et al. Citation2020), while some uncertainty about how to assess outcome scale responsiveness could remain (Robling and Hood Citation2002). Overall diet and seafood intake could also have been affected by long-term memory limitations. However, although recall bias could have increased errors within the perceived stress and diet-related variables, making it difficult to obtain statistically significant results in the models, we do not expect trends in the responses that could lead to spurious relationships.
4.2.4. Declaration bias
Declaration bias can occur when some respondents answer some questions idiosyncratically according to their convenience (Pollock et al. Citation1994). However, we do not expect that the fishers have foreseen the data treatment that would be conducted on their question responses, so we assume this bias has not affected the results. In addition, given that we used the same questionnaire to collect the data used to construct the predictor variables, we do not rule out some degree of regression attenuation derived from errors in obtaining the information, which would have impaired our ability to obtain significant results, e.g. in the case of the association between sleep quality and seafood consumption.
4.2.5. Reverse causation
We do not rule out the possibility that fishers with lower levels of psychological stress go out fishing more. However, although other studies should be carried out to confirm our hypothesis, the fact that the sampled fishers are themselves a group highly involved in fishing suggests that this leisure activity has a positive effect on their stress levels.
4.2.6. Other limitations
Recreational fishers show great heterogeneity in terms of their motivations for accessing and staying in the fishery (Knoche and Lupi Citation2016; Magee et al. Citation2018; Matsumura et al. Citation2019). This diversity also affects the frequency and duration of fishing trips (Dabrowksa et al. Citation2017). Even though in Galicia access to fishing areas is relatively quick and easy for the entire population, fishers living closer to the coast may show higher fishing effort. Although the lack of this information in the models did not bias the results, including proximity to fishing areas could improve the output of the models that included fishing effort as predictor. Similarly, although the influence of the age of the fishers in the different models should have been largely captured by the employment status, its inclusion could have contributed to better fits.
This is an observational study that may not have accounted for all possible confounders. Since social interactions are important for certain profiles of recreational fishers (Mueller et al. Citation2008), including Galician fishers (Pita et al. Citation2018), the role of the social network structure may have been important. It is possible that fishers with stronger social networks, with greater chances to go fishing with someone else, also show a better state of mind derived from the protective role offered by social integration (Cohen and Lemay Citation2007; Rosenquist et al. Citation2011). Similarly, social networks can also influence dietary choices (Pachucki et al. Citation2011) and sleep quality (Gordon et al. Citation2017).
5. Conclusions
The association between the practice of marine recreational fishing and benefits for the health and well-being of people demonstrated in this study constitutes the basis for further research on this topic, which must necessarily be developed in order to begin to reverse the notable lack of scientific attention to the social benefits of an outdoor activity that is practiced by almost 60 million people and generates about 30 billion dollars annually worldwide through the expenses and investments of the fishers (Cisneros-Montemayor and Sumaila Citation2010). Since the relationship between human health and recreational fishing has relevant implications for public health systems, especially in developed countries with aging populations, it is recommended that future studies confirm a causal relationship and minimize representativeness biases with respect to the general fishers’ population. Randomized clinical trials would be optimal, but other observational research designs like cohort, or case-control would also be suitable if confounders and selection bias are under control (Mann Citation2003; Mariani and Pego-Fernandes Citation2014).
It would also be advisable to keep under control the heterogeneity of fishers in future studies, e.g. in terms of their access motivations (Fedler and Ditton Citation1994), orientation toward catches (Beardmore et al. Citation2011), fishing skills (Scott and Shafer Citation2001), or the importance of fishing for their lifestyle (Kyle et al. Citation2007). These dimensions can help to understand how different groups of recreational fishers respond to external events (see e.g. Pita et al. Citation2021). Including the proximity to coastal fishing areas, and some information on the social network structure could also help to improve the model outputs.
Although we were unable to identify a relationship between seafood consumption and sleep quality, the association between fishing intensity and seafood consumption demonstrated in our study, and the accumulated scientific evidence on the positive effects of diets rich in seafood on different aspects of health (Appleton et al. Citation2010; Hosomi et al. Citation2012; Lund Citation2013), including night rest (St-Onge et al. Citation2016; Murphy et al. Citation2020), lead us to recommend including dietary aspects in subsequent research initiatives.
Appendix A
Download PDF (445 KB)Appendix B
Download PDF (391.1 KB)Appendix C
Download PDF (424.6 KB)Acknowledgements
We appreciate the involvement of the recreational fishers who participated in this study. The involvement of J. Beiro, chair of the Galician Federation of Responsible Marine Recreational Fishing and Sailing, was key to foster fishers’ participation. We thank C. Regueira and J. Lago, from the University of Santiago de Compostela, for their involvement in the initial study design and data processing.
Disclosure statement
No potential conflict of interest was reported by the author(s).
Supplemental data
Supplemental data for this article can be accessed online at https://doi.org/10.1080/26395916.2022.2112291.
Additional information
Funding
Notes
1. Seafood is by far the main source of Omega—3 fatty acids (Tur et al. Citation2012), however tryptophan is also present in milk, meat, poultry, eggs, beans, peanuts, cheese, and leafy green vegetables (Halson Citation2008).
References
- Ainsworth BE, Haskell WL, Whitt MC, Irwin ML, Swartz AM, Strath SJ, O Brien WL, Bassett DR, Schmitz KH, Emplaincourt PO. 2000. Compendium of physical activities: an update of activity codes and MET intensities. Med Sci Sports Exerc. 32:S498–S504. doi:10.1097/00005768-200009001-00009.
- Akaike H. 1973. Information theory and an extension of the maximum likelihood principle. In: Petrov BN, Csaki F, editors. Second International Symposium of Information Theory. Tsahkadsor (Armenia): Akademiai Kiado. p. 267–281.
- Åkerstedt T, Knutsson A, Westerholm P, Theorell T, Alfredsson L, Kecklund G. 2002. Sleep disturbances, work stress and work hours: a cross-sectional study. J Psychosom Res. 53(3):741–748. doi:10.1016/S0022-3999(02)00333-1.
- Alasalvar C, Miyashita K, Shahidi F, Wanasundara U. 2011. Handbook of seafood quality, safety and health applications. Oxford: John Wiley & Sons.
- Anda RF, Williamson DF, Escobedo LG, Remington PL, Mast EE, Madans JH. 1992. Self-Perceived stress and the risk of peptic ulcer disease: a longitudinal study of US adults. Arch Intern Med. 152(4):829–833. doi:10.1001/archinte.1992.00400160119023.
- Appleton KM, Rogers PJ, Ness AR. 2010. Updated systematic review and meta-analysis of the effects of n−3 long-chain polyunsaturated fatty acids on depressed mood. Am J Clin Nutr. 91(3):757–770. doi:10.3945/ajcn.2009.28313.
- Arito H, Hara N, Torii S. 1983. Effect of methylmercury chloride on sleep-waking rhythms in rats. Toxicology. 28:335–345.
- Arlinghaus R, Tillner R, Bork M. 2014. Explaining participation rates in recreational fishing across industrialised countries. Fish Manag Ecol. 22:45–55. doi:10.1111/fme.12075.
- Azur MJ, Stuart EA, Frangakis C, Leaf PJ. 2011. Multiple imputation by chained equations: what is it and how does it work? Int J Methods Psychiatr Res. 20:40–49.
- Baecke JAH, Burema J, Frijters JE. 1982. A short questionnaire for the measurement of habitual physical activity in epidemiological studies. Am J Clin Nutr. 36:936–942.
- Beardmore B, Haider W, Hunt LM, Arlinghaus R. 2011. The importance of trip context for determining primary angler motivations: are more specialized anglers more catch-oriented than previously believed? North Am J Fish Manag. 31:861–879.
- Beck A, Steer R, Brown G. 2000. BDI-Fast screen for medical patients manual. Psychological corporation.
- Björk J, Albin M, Grahn P, Jacobsson H, Ardö J, Wadbro J, Östergren P-O, Skärbäck E. 2008. Recreational values of the natural environment in relation to neighbourhood satisfaction, physical activity, obesity and wellbeing. J Epidemiol Community Heal. 62:e2.
- Blanco SL, González JC, Vieites JM. 2008. Mercury, cadmium and lead levels in samples of the main traded fish and shellfish species in Galicia, Spain. Food Addit Contam. 1:15–21.
- Bobes J, García-Portilla González MP, Saiz Martínez PA, Bascarán Fernández MT, Iglesias Álvarez C, Fernández Domínguez JM. 2000. Propiedades psicométricas del cuestionario Oviedo de sueño. Psicothema. 12:107–112.
- Bolger N, DeLongis A, Kessler RC, Schilling EA. 1989. Effects of daily stress on negative mood. J Pers Soc Psychol. 57:808.
- Bowler DE, Buyung-Ali LM, Knight TM, Pullin AS. 2010. A systematic review of evidence for the added benefits to health of exposure to natural environments. BMC Public Health. 10:456.
- Chaput J-P. 2014. Sleep patterns, diet quality and energy balance. Physiol Behav. 134:86–91.
- Chen B, Qi X, Qiu Z. 2018. Recreational use of urban forest parks: a case study in Fuzhou National Forest Park, China. J for Res. 23:183–189.
- Cisneros-Montemayor AM, Sumaila UR. 2010. A global estimate of benefits from ecosystem-based marine recreation: potential impacts and implications for management. J Bioeconomics. 12:245–268.
- Clarke KR. 1993. Non‐parametric multivariate analyses of changes in community structure. Aust J Ecol. 18:117–143.
- Cohen S, Janicki‐deverts D. 2012. Who’s stressed? Distributions of psychological stress in the United States in probability samples from 1983, 2006, and 2009. J Appl Soc Psychol. 42:1320–1334.
- Cohen S, Kamarck T, Mermelstein R. 1983. A global measure of perceived stress. J Health Soc Behav. 24:385–396.
- Cohen S, Kessler RC, Underwood L. 1995. Strategies for measuring stress in studies of psychiatric and physical disorders. In: Measuring stress: a guide for health and social scientists. Oxford (UK): Oxford university press; p. 3–26.
- Cohen S, Lemay EP. 2007. Why would social networks be linked to affect and health practices? Heal Psychol. 26:410.
- Cohen S, Tyrrell DA, Smith AP. 1993. Negative life events, perceived stress, negative affect, and susceptibility to the common cold. J Pers Soc Psychol. 64:131.
- Colombo D, Suso-Ribera C, Fernández-Álvarez J, Cipresso P, Garcia-Palacios A, Riva G, Botella C. 2020. Affect recall bias: being resilient by distorting reality. Cognit Ther Res. 44:906–918. doi:10.1007/s10608-020-10122-3.
- Cooke SJ, Twardek WM, Lennox RJ, Zolderdo AJ, Bower SD, Gutowsky LFG, Danylchuk AJ, Arlinghaus R, Beard D. 2017. The nexus of fun and nutrition: recreational fishing is also about food. Fish Fish. 19:201–224.
- Dabrowksa K, Hunt LM, Haider W. 2017. Understanding how angler characteristics and context influence angler preferences for fishing sites. North Am J Fish Manag. 37:1350–1361.
- Dahlgren A, Kecklund G, Åkerstedt T. 2005. Different levels of work-related stress and the effects on sleep, fatigue and cortisol. Scand J Work Environ Health. 31:277–285.
- Del Brutto OH, Mera RM, Ha J, Gillman J, Zambrano M, Castillo PR. 2016. Dietary fish intake and sleep quality: a population-based study. Sleep Med. 17:126–128.
- Edwards JW, Edyvane KS, Boxall VA, Hamann M, Soole KL. 2001. Metal levels in seston and marine fish flesh near industrial and metropolitan centres in South Australia. Mar Pollut Bull. 42:389–396.
- European Parliament. 2018. European Parliament resolution of 12 June 2018 on the state of play of recreational fisheries in the European Union. Brussels (Belgium): Official Journal of the European Union.
- FAO. 2020. The state of world fisheries and aquaculture 2020. Rome: Sustainability in Action, Food and Agriculture Organization of the United Nations.
- Fedler AJ, Ditton RB. 1994. Understanding angler motivations in fisheries management. Fisheries. 19:6–13.
- Fisher MR. 1996. Estimating the effect of nonresponse bias on angler surveys. Trans Am Fish Soc. 125:118–126.
- Gobierno de España. 2020. Panel de consumo alimentario [www document]. Últimos Datos obtenidos. [accessed 2021 Oct 28]. https://www.mapa.gob.es/es/alimentacion/temas/consumo-tendencias/panel-de-consumo-alimentario/.
- Gordon AM, Mendes WB, Prather AA. 2017. The social side of sleep: elucidating the links between sleep and social processes. Curr Dir Psychol Sci. 26:470–475.
- Gribble MO, Karimi R, Feingold BJ, Nyland JF, O’Hara TM, Gladyshev MI, Chen CY. 2016. Mercury, selenium and fish oils in marine food webs and implications for human health. J Mar Biol Assoc United Kingdom. 96:43–59.
- Griffiths SP, Bryant J, Raymond HF, Newcombe PA. 2016. Quantifying subjective human dimensions of recreational fishing: does good health come to those who bait? Fish Fish. 18:171–184. doi:10.1111/faf.12149.
- Grzywacz JG, Almeida DM, Neupert SD, Ettner SL. 2004. Socioeconomic status and health: a micro-level analysis o exposure and vulnerability to daily stressors. J Health Soc Behav. 45:1–16.
- Hahn S, Reilly C, Farr T, Patterson C. 1993. A study of factors contributing to injury and mortality of Australian sport and recreational anglers. Aust J Sci Med Sport. 25:89.
- Halson SL. 2008. Nutrition, sleep and recovery. Eur J Sport Sci. 8:119–126.
- Hansen AL, Dahl L, Olson G, Thornton D, Graff IE, Frøyland L, Thayer JF, Pallesen S. 2014. Fish consumption, sleep, daily functioning, and heart rate variability. J Clin Sleep Med. 10:567–575.
- Hartig T, Mitchell R, De Vries S, Frumkin H. 2014. Nature and health. Annu Rev Public Health. 35:207–228.
- Herfaut J, Levrel H, Thébaud O, Véron G. 2013. The nationwide assessment of marine recreational fishing: a French example. Ocean Coast Manag. 78:121–131. doi:http://dx.doi.org/10.1016/j.ocecoaman.2013.02.026.
- Hiett RL, Worrall JW. 1977. Marine recreational fishermen’s ability to estimate catch and to recall catch and effort over time. McLean (VA): Human Sciences Research, Incorporated.
- Horreo JL, Fitze PS, Jiménez-Valverde A, Noriega JA, Pelaez ML. 2019. Amplification of 16S rDNA reveals important fish mislabeling in Madrid restaurants. Food Control. 96:146–150.
- Hosomi R, Yoshida M, Fukunaga K. 2012. Seafood consumption and components for health. Glob J Health Sci. 4:72.
- Hu FB. 2002. Dietary pattern analysis: a new direction in nutritional epidemiology. Curr Opin Lipidol. 13:3–9.
- Inglehart R. 1990. Culture shift in advanced industrial society. Princeton (NJ): Princeton University Press.
- Knoche S, Lupi F. 2016. Demand for fishery regulations: effects of angler heterogeneity and catch improvements on preferences for gear and harvest restrictions. Fish Res. 181:163–171.
- Kosti RI, Panagiotakos DB. 2006. The epidemic of obesity in children and adolescents in the world. Cent Eur J Public Health. 14:151.
- Kyle G, Absher J, Norman W, Hammitt W, Jodice L. 2007. A modified involvement scale. Leis Stud. 26:399–427. doi:10.1080/02614360600896668.
- Lands WEM. 1986. Fish and human health. Chicago: Academic Press, Inc.
- Lee J, Macdonald D, Wright J. 2009. Young men’s physical activity choices: the impact of capital, masculinities, and location. J Sport Soc Issues. 33:59–77.
- Liu J, Cui Y, Li L, Wu L, Hanlon A, Pinto-Martin J, Raine A, Hibbeln JR. 2017. The mediating role of sleep in the fish consumption–cognitive functioning relationship: a cohort study. Sci Rep. 7:1–9.
- Lund EK. 2013. Health benefits of seafood; is it just the fatty acids? Food Chem. 140:413–420.
- Lund HG, Reider BD, Whiting AB, Prichard JR. 2010. Sleep patterns and predictors of disturbed sleep in a large population of college students. J Adolesc Heal. 46:124–132.
- Magee C, Voyer M, McIlgorm A, Li O. 2018. Chasing the thrill or just passing the time? Trialing a new mixed methods approach to understanding heterogeneity amongst recreational fishers based on motivations. Fish Res. 199:107–118.
- Maller C, Townsend M, Pryor A, Brown P, St Leger L. 2006. Healthy nature healthy people:‘contact with nature’as an upstream health promotion intervention for populations. Health Promot Int. 21:45–54.
- Mann CJ. 2003. Observational research methods. Research design II: cohort, cross sectional, and case-control studies. Emerg Med J. 20:54–60.
- Mannell RC. 2007. Leisure, health and well-being. World Leis J. 49:114–128.
- Mariani AW, Pego-Fernandes PM. 2014. Observational studies: why are they so important?
- Martin-Moreno JM, Boyle P, Gorgojo L, Maisonneuve P, Fernandez-Rodriguez JC, Salvini S, Willett WC. 1993. Development and validation of a food frequency questionnaire in Spain. Int J Epidemiol. 22:512–519.
- Matsumura S, Beardmore B, Haider W, Dieckmann U, Arlinghaus R. 2019. Ecological, angler, and spatial heterogeneity drive social and ecological outcomes in an integrated landscape model of freshwater recreational fisheries. Rev Fish Sci Aquac. 27:170–197.
- Matthews KA, Gallo LC. 2011. Psychological perspectives on pathways linking socioeconomic status and physical health. Annu Rev Psychol. 62:501–530.
- McColl E, Thomas R. 2000. The use and design of questionnaires. London: Royal College of General Practitioners London.
- Mitchell R. 2013. Is physical activity in natural environments better for mental health than physical activity in other environments? Soc Sci Med. 91:130–134.
- Mitchell R, Popham F. 2008. Effect of exposure to natural environment on health inequalities: an observational population study. Lancet. 372:1655–1660.
- Moore CJ, Cunningham SA. 2012. Social position, psychological stress, and obesity: a systematic review. J Acad Nutr Diet. 112:518–526.
- Morales-Nin B, Arlinghaus R, Alós J. 2021. Contrasting the motivations and wildlife-related value orientations of recreational fishers with participants of other outdoor and indoor recreational activities. Front Mar Sci. 8:1005.
- Morales-Nin B, Cardona-Pons F, María Grau A, García E, Alvarez I, Pérez-Mayol S. 2013. Does angling activity influence consumer choices of fresh fish? Br Food J. 115:1054–1066.
- Mueller KB, Taylor WW, Frank KA, Robertson JM, Grinold DL. 2008. Social networks and fisheries: the relationship between a charter fishing network, social capital, and catch dynamics. North Am J Fish Manag. 28:447–462. doi:10.1577/M07-016.1.
- Murphy R, Gu Q, Marklund M, Riserus U, Virtanen J, Tintle N, Wood A, Gudnason V, Carnethon M, Harris W. 2020. Omega-3 fatty acid biomarkers and sleep: pooled analysis of prospective studies in the fatty acids and outcome research consortium (FORCE). Curr Dev Nutr. 4:1460.
- Öhrvik V, Malmborg A, Mattisson I, Wretling S, Åstrand C. 2012. Fish, shellfish and fish products-analysis of nutrients. Livsmedels Verk Natl Food Agency, Sweden.
- Oksanen J, Blanchet FG, Friendly M, Kindt R, Legendre P, McGlinn D, Minchin PR, O’Hara RB, Simpson GL, Solymos P, et al. 2019. Vegan: community ecology package.
- Olsen SO. 2003. Understanding the relationship between age and seafood consumption: the mediating role of attitude, health involvement and convenience. Food Qual Prefer. 14:199–209.
- Pachucki MA, Jacques PF, Christakis NA. 2011. Social network concordance in food choice among spouses, friends, and siblings. Am J Public Health. 101:2170–2177.
- Pammolli F, Riccaboni M, Magazzini L. 2012. The sustainability of European health care systems: beyond income and aging. Eur J Heal Econ. 13:623–634.
- Parmalee NL, Aschner M. 2017. Metals and circadian rhythms. Adv Neurotoxicology. 1:119–130.
- Peuhkuri K, Sihvola N, Korpela R. 2012. Diet promotes sleep duration and quality. Nutr Res. 32:309–319.
- Piantadosi S, Byar DP, Green SB. 1988. The ecological fallacy. Am J Epidemiol. 127:893–904.
- Pita P, Ainsworth GB, Alba B, Anderson AB, Antelo M, Alos J, Artetxe I, Baudrier J, Castro JJ, Chicharro B, et al. 2021. First assessment of the impacts of COVID-19 pandemic on global marine recreational fisheries. Front Mar Sci. 8:735741.
- Pita P, Alos J, Antelo M, Artetxe I, Biton-Porsmoguer S, Carreño A, Cuadros A, Font T, Beiro J, García-Charton JA, et al. 2020. Assessing knowledge gaps and management needs to cope with barriers for environmental, economic and social sustainability of marine recreational fisheries: the case of Spain. Front Mar Sci. 7:23. doi:10.3389/fmars.2020.00023. Assessing
- Pita P, Hyder K, Gomes P, Pita C, Rangel M, Veiga P, Vingada J, Villasante S. 2018. Economic, social and ecological attributes of marine recreational fisheries in Galicia, Spain. Fish Res. 208:58–69.
- Pita P, Villasante S. 2019. The building of a management system for marine recreational fisheries in Galicia (NW Spain). Ocean Coast Manag. 169:191–200. https://doi.org/10.1016/j.ocecoaman.2018.12.027.
- Pollock KH, Jones CM, Brown TL. 1994. Angler survey methods and their application in fisheries management. Bethesda (MD): American Fisheries Society Special Publication; p. 25.
- Pulford E, Polidoro BA, Nation M. 2017. Understanding the relationships between water quality, recreational fishing practices, and human health in Phoenix, Arizona. J Environ Manage. 199:242–250.
- R Core Team. 2019. R: a language and environment for statistical computing.
- Read CR, Watson SL, Perez JL, Estes AR. 2017. Competitive bass anglers: a new concern in sports medicine. Phys Sportsmed. 45:309–315.
- Richardson S, Shaffer JA, Falzon L, Krupka D, Davidson KW, Edmondson D. 2012. Meta-Analysis of perceived stress and its association with incident coronary heart disease. Am J Cardiol. 110:1711–1716.
- Robling M, Hood K. 2002. Response shift, responsiveness or recall bias? Br J Gen Pract. 52:585.
- Rodríguez-Hernández Á, Camacho M, Henríquez-Hernández LA, Boada LD, Ruiz-Suárez N, Valerón PF, González MA, Zaccaroni A, Zumbado M, Luzardo OP. 2016. Assessment of human health hazards associated with the dietary exposure to organic and inorganic contaminants through the consumption of fishery products in Spain. Sci Total Environ. 557:808–818.
- Rosenquist JN, Fowler JH, Christakis NA. 2011. Social network determinants of depression. Mol Psychiatry. 16:273–281.
- Santiago CD, Wadsworth ME, Stump J. 2011. Socioeconomic status, neighborhood disadvantage, and poverty-related stress: prospective effects on psychological syndromes among diverse low-income families. J Econ Psychol. 32:218–230.
- Scott D, Shafer CS. 2001. Recreational specialization: A critical look at the construct. J Leis Res. 33:319–343.
- Shavers VL. 2007. Measurement of socioeconomic status in health disparities research. J Natl Med Assoc. 99:1013.
- Snyder S. 2007. New streams of religion: fly fishing as a lived, religion of nature. J Am Acad Relig. 75:896–922.
- St-Onge M-P, Mikic A, Pietrolungo CE. 2016. Effects of diet on sleep quality. Adv Nutr. 7:938–949.
- Steffens W, Winkel M. 2002. Evaluating recreational fishing in Germany. In: Pitcher TJ, Hollingworth C, editors. Recreational fisheries: ecological, economic and social evaluation. Oxford (UK): Blackwell Scientific Publications; p. 130–136.
- Taylor DL, Williamson PR. 2017. Mercury contamination in Southern New England coastal fisheries and dietary habits of recreational anglers and their families: implications to human health and issuance of consumption advisories. Mar Pollut Bull. 114:144–156.
- Thompson Coon J, Boddy K, Stein K, Whear R, Barton J, Depledge MH. 2011. Does participating in physical activity in outdoor natural environments have a greater effect on physical and mental wellbeing than physical activity indoors? A systematic review. Environ Sci Technol. 45:1761–1772.
- Thompson T, Hubert WA. 1990. Influence of survey method on estimates of statewide fishing activity. North Am J Fish Manag. 10:111–113.
- Tur JA, Bibiloni MM, Sureda A, Pons A. 2012. Dietary sources of omega 3 fatty acids: public health risks and benefits. Br J Nutr. 107:S23–S52.
- Vahle-Hinz T, Bamberg E, Dettmers J, Friedrich N, Keller M. 2014. Effects of work stress on work-related rumination, restful sleep, and nocturnal heart rate variability experienced on workdays and weekends. J Occup Health Psychol. 19:217.
- Van Buuren S, Groothuis-Oudshoorn K. 2010. Mice: multivariate imputation by chained equations in R. J Stat Softw. 45:1–67.
- van den Bosch M, Sang ÅO. 2017. Urban natural environments as nature-based solutions for improved public health–a systematic review of reviews. Environ Res. 158:373–384.
- Venes D. 2017. Taber’s Cyclopedic medical dictionary. Philadelphia: FA Davis.
- Venter Z, Barton D, Gundersen V, Figari H, Nowell M. 2020. Urban nature in a time of crisis: recreational use of green space increases during the COVID-19 outbreak in Oslo, Norway. Environ Res Lett. 15:104075.
- Vitiello MV. 1997. Sleep, alcohol and alcohol abuse. Addict Biol. 2:151–158.
- Von Elm E, Altman DG, Egger M, Pocock SJ, Gøtzsche PC, Vandenbroucke JP. 2007. The Strengthening the Reporting of Observational Studies in Epidemiology (STROBE) statement: guidelines for reporting observational studies. Ann Intern Med. 147:573–577.
- White MP, Alcock I, Grellier J, Wheeler BW, Hartig T, Warber SL, Bone A, Depledge MH, Fleming LE. 2019. Spending at least 120 minutes a week in nature is associated with good health and wellbeing. Sci Rep. 9:1–11.
- Wong MM, Brower KJ, Fitzgerald HE, Zucker RA. 2004. Sleep problems in early childhood and early onset of alcohol and other drug use in adolescence. Alcohol Clin Exp Res. 28:578–587.
- World Health Organization. 2020. How much of physical activity is recommended? [www document]. Physical Activity. [accessed 2021 Oct 28]. https://www.who.int/news-room/fact-sheets/detail/physical-activity.
- Xunta de Galicia. 2019. Instituto Galego de Estadística [www document]. Statistics databases. [accessed 2021 Oct 28]. https://www.ige.eu/web/index.jsp?idioma=gl.
- Young MAL, Foale S, Bellwood DR. 2016. Why do fishers fish? a cross-cultural examination of the motivations for fishing. Mar Policy. 66:114–123.