
ABSTRACT
Maintaining a resilient and sustainable agro-production system is replete with challenges, because management practices designed to enhance productivity can overlook the range of values derived from ecosystems and concerns about their future. Further complicating the decisions being made about agricultural settings is the variation in social-ecological stressors that shape how diverse community members interpret landscape change. We engaged residents of the Kaskaskia River Watershed in Illinois, USA in discussions about agroecosystems through participatory mapping exercises and focus groups. The spatially explicit data that were derived from this process were then modeled in relation to changes in watershed hydrology simulated using a Soil and Water Assessment Tool (SWAT) model. We observed that the four most salient ‘values’ associated with the watershed were recreation, erosion protection, crop production, and flood control. Erosion, siltation and sedimentation, increased flooding, and invasive species were considered the most relevant ‘disvalues’ because they represented the social-ecological stressors of greatest concern. Respondents believed that the values from ecosystems were more spatially clustered than disvalues, and the main river corridor was at greater risk of degradation than the associated tributaries despite these second order streams being more biologically diverse. The use of participatory mapping data coupled with SWAT to simulate changes in systemic responses of the watershed provided a social-ecological basis for identifying high and low-priority locations at a regional scale. Our results therefore aim to spatial prioritize and guide evidence-based decisions anchored in the social and ecological complexities of a Midwestern watershed.
EDITED BY:
Introduction
Agricultural landscapes are instrumental in the provision of nature’s contributions to people (Díaz et al. Citation2018) to support rural communities that depend on natural resources for their livelihoods, food security, and quality of life (Zhang et al. Citation2007; Lescourret et al. Citation2015; Prokopy et al. Citation2015). Diversified farmlands, in particular, can enhance biodiversity, increase food production, regulate water retention, and support soil health (Porter et al. Citation2009; Hanaček and Rodríguez-Labajos Citation2018). Broadly, agroecosystems reflect layers of rural development and historical land uses that carry meaning for residents (Leitschuh et al. Citation2022; Slemp et al. Citation2012) and a ‘sense of place’ that motivates conservation behavior (Gosling and Williams Citation2010; Mullendore et al. Citation2015). Multiple benefits from nature – such as aesthetics, recreational opportunities, and therapeutic qualities of nature – are associated with agricultural landscapes but have largely remained implicit in land management decisions because they are difficult to quantify (Milcu et al. Citation2013). To facilitate the sustainable management of agroecosystems, research is urgently needed to account for a more comprehensive array of benefits, especially those that provide insights into the intrinsic motivations that underpin ownership, management, and conservation of natural resources (Chan et al. Citation2012; Plieninger et al. Citation2012; Hölting et al. Citation2020).
Pressure being placed on agroecosystems from intensification of industrial practices, land conversion, and increased demand for food is degrading ecosystems at unsustainable rates (Fischer et al. Citation2014; Garbach et al. Citation2017). Further, the biophysical capacity of agricultural production is at risk of being altered by pathogens and invasive species (Pimentel et al. Citation2001; McDonald and Stukenbrock Citation2016), soil erosion (Steinhoff-Knopp et al. Citation2021), and changing climates (Tubiello and Fischer Citation2007). Changes in the global food system, especially in the period following World War II, have led to the further degradation of agroecosystems. The global food system is a complex network of political, economic, and social factors, but the transition to high-input monocultures of corn and soybean have had a particularly large and negative impact on ecosystems of the Midwest and elsewhere (Lobao and Meyer Citation2001; Shipley et al. Citation2022; Singh et al. Citation2023). These changes to working landscapes have led to forms of environmental degradation such as nonpoint source pollution that affects downstream community members from rural to urban contexts (Lee et al. Citation2015). There have been increasing calls for broader engagement and inclusivity in decision-making to develop more sustainable policy solutions, given the benefits that have emerged from collaborative management across diverse interest groups (Lamarque et al. Citation2011; Garnett et al. Citation2018; Wilhelm et al. Citation2020; Zagata et al. Citation2021). Specifically, previous research has emphasized the value of public involvement in decision-making to enable more equitable distributions of nature’s contributions to people (King et al. Citation2015) and sound governance to support the use and appreciation of agroecosystems (Robards et al. Citation2011; Wardropper et al. Citation2020).
Participatory research is rapidly gaining traction as a mechanism for acknowledging and responding to different relationships that form between people and places (Pérez-Ramírez et al. Citation2021). The process for understanding the benefits of working landscapes is particularly important for rural community members who are faced with rapid change that is challenging traditional ways they have identified, connected with, and cared for the natural world (Stewart et al. Citation2019). Research advanced at spatially explicit scales can help to direct attention toward high and low priority areas in agroecosystems that are especially vulnerable due to factors such as increasing uncertainty from global environmental change (Hein et al. Citation2006; García-Nieto et al. Citation2015). Specifically, Public Participation in Geographic Information Systems (PPGIS) (Brown and Fagerholm Citation2015) can be used to reveal the relative importance and spatial distribution of benefits identified by communities as primary resource users. This method carries potential to improve agroecosystem governance by providing rural communities with a platform for voicing their concerns and translating these points into concrete land-use change directives. However, the extant literature has predominantly focused on understanding the positive rather than negative associations with places (for an exception, see Klain and Chan Citation2012). There is consequently an urgent need to shift attention toward the idea of ‘disvalues’ defined as aspects of nature that reduce human well-being, degrade relationships, and embody inherently dysfunctional outcomes (Lliso et al. Citation2022). Though understudied, this research approach can support agroecosystem resilience in the face of change, because it reveals points of conflict and highlights issues that may thwart the provision of benefits over longer time periods (DeClerck et al. Citation2016).
Engaging local communities in discussions about the values and disvalues of nature is replete with challenges, owing to the complexity of coupled social-ecological systems. Over three decades of research has fortified knowledge of integrated systems that recognize humans as being nested within broader environments (Adger et al. Citation2005; Liu et al. Citation2007; Berkes et al. Citation2008; Ostrom Citation2009), urging researchers to think beyond nature-people dualisms and instead focus on hybrid social-ecological spaces (West et al. Citation2020). Indeed, a ‘relational turn’ toward assumptions of transactional relationships between people and places is better equipped to reflect integrated system resilience (Walker et al. Citation2002; Cinner and Barnes Citation2019) and adaptive governance (Folke et al. Citation2005) that can be supported by participatory research with community members. For example, Alessa et al. (Citation2008) worked with communities on the Kenai Peninsula in Alaska, U.S.A., and used PPGIS methods to advance the concept of a spatially explicit social-ecological system. The authors identified hotspots, coldspots, and warmspots defined by shared social-ecological spaces that had different levels of perceived versus on-ground biodiversity. Sherrouse et al. (Citation2011) also developed spatial priorities for resource management agencies in response to the values people associated with places, which were modeled alongside environmental data through a participatory process. These studies show great promise in their ability to support more comprehensive policy decisions that integrate knowledge from multiple disciplines, as well as establish more inclusive processes for engaging community members in decisions about landscapes that are undergoing rapid change (Mehryar et al. Citation2017; Schwartz et al. Citation2021).
This study aimed to understand how the spatial distribution of values provided by a regional agroecosystem and disvalues that threatened the sustainability of these places related to changing social-ecological conditions in the Kaskaskia River Watershed, Illinois, U.S.A. Drawing on a conceptual framework established by the Intergovernmental Panel on Biodiversity and Ecosystem Services (IPBES), we first probed qualitative data from focus groups to explore the reciprocal relationships among participants and landscapes. This gave rise to knowledge of the relative importance of values and disvalues that paralleled the idea of ‘relational values’ established in previous research (Gould et al. Citation2019). That is, the process of engaging in discussions about nature’s contributions evoked consideration of their relationships between people and places. Next, we used participatory mapping exercises to geographically locate the positive and negative qualities of a landscape that reflected ‘specific values’ defined by the importance of nature in particular situations (Pascual et al. Citation2023). Finally, we modeled a suite of social-ecological stressors to better understand the basis for participants’ evaluations of values and disvalues from agroecosystems in the Kaskaskia River Watershed. Our mixed methods approach thus leveraged multiple forms of knowledge to address the following objectives: 1) Evaluate the prominence of values and disvalues; 2) Understand the spatial dynamics of values and disvalues; and 3) Determine the relationships between social and ecological data.
Methods
Study context
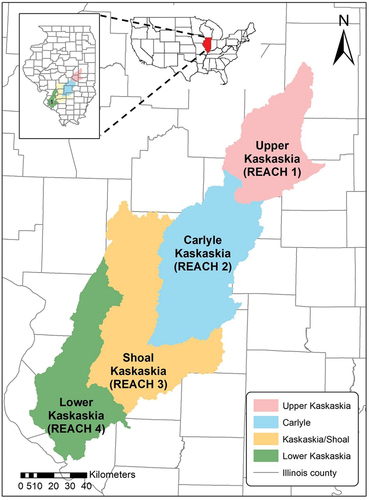
This research was conducted in the Kaskaskia River Watershed, which is the second largest watershed (~1,506,800 ha) in Illinois encompassing 10% of the state’s total land area. An estimated 97.6% of the watershed is privately owned (Krohe Citation2001), and the majority (>70%) of the watershed’s land is dedicated to farming, including the production of corn, soybeans, pasture, and hay (Acero et al. Citation2021). Due to the high proportion of private and working lands, public access to natural resources and conservation initiatives have been largely concentrated in two reservoirs managed by the Army Corps of Engineers, including Lake Shelbyville in the northern part of the watershed and Carlyle Lake in the middle to lower sections, completed in 1970 and 1967 respectively (Taylor and Stemler Citation2006). As of 2005, approximately 560,000 people lived in the watershed with the population concentrated in Madison and St. Clair Counties. The largest city in the watershed is Belleville, located in St. Clair County with a population of approximately 43,000 (Dziegielewski and Thomas Citation2011). The watershed is divided into four politically and ecologically defined ‘reaches’ including the Upper Kaskaskia Reach, Carlyle Reach, Kaskaskia/Shoal Reach, and the Lower Kaskaskia Reach. These four units served as boundaries that guided our study design and data collection processes (see ).
Figure 1. A map of southwestern Illinois depicting the four reaches of the Kaskaskia River Watershed, including the Upper Kaskaskia (Reach 1), Carlyle Kaskaskia (Reach 2), Shoal Kaskaskia (Reach 3), and Lower Kaskaskia (Reach 4).
Data collection
We conducted four focus groups, including one in each of the reaches of the Kaskaskia River Watershed. We worked with the Kaskaskia Watershed Association (KWA) to recruit participants for the focus groups. The study took advantage of the regularly held meetings for the KWA to engage study participants. As such, most of the people who participated in our focus groups were members of the KWA and had deep connections to farming, either having grown up with a family that farms or being a farmer themselves. More specifically, our focus groups included people with connections to farm businesses (e.g. farmers, non-farming landowners), tourism, environmentalism, and state or federal agencies such as the U.S. Army Corps of Engineers and Illinois Department of Natural Resources (n = 52). Participation ranged from a low of six people in one focus group (Reach 1) up to a high of 25 people (Reach 4).
During the focus groups, participants were first asked to engage in an individual mapping exercise that included two steps. First, participants were asked to rank a list of 18 values (that we termed, ‘benefits’) of and 14 disvalues (that we termed ‘threats’) to the watershed by allocating 100 preference points across the list of values and 100 preference points across the list of disvalues to reflect the relative importance of each category to the specific participant. The lists presented to study participants were derived from previous research (Shipley et al. Citation2020) that involved a Delphi process used to inductively identify the most important landscape features according to residents. Mean value scores were calculated to determine the relative importance of all values and disvalues across the entire watershed. The second step in the individual mapping exercise involved participants assigning the values and disvalues selected in the first step of the mapping exercise to specific places within the watershed. These locations were marked using points, lines, and polygons. The paper map was displayed on a standard letter sized sheet of paper (8 ½” x 11”) of participants’ respective watershed reach.
Following the individual mapping exercise, all focus group participants were engaged in larger group discussions about the locations of values and disvalues to build interactional expertise (Carolan Citation2006). These discussions were intended to elucidate the reasons why places carried positive and negative associations for participants and revolved around a larger map of the watershed that served as a boundary object to stimulate dialogue among participants (Steger et al. Citation2018). Discussions generated 205 minutes of audio from 10 recordings. The recordings were transcribed verbatim and coded using a closed coding method in which two researchers identified passages of text that directly reference one of the predetermined values and disvalues. The purpose of this analysis was to complement the data collected through the individual mapping exercise and capture any new information on how both values and disvalues were perceived at the group level in the Kaskaskia River watershed.
Spatial data derived from the individual mapping exercise were systematically digitized using ArcMap 10.6 and loaded into a geodatabase (total value and disvalue points = 793). The preference points allocated to all value and disvalue categories were also added to the geodatabase and connected to the digitized points using a unique identifier. To test if the spatial point distributions generated from the PPGIS dataset differed from a completely spatially random (CSR) distribution, Average Nearest Neighbor (NN) statistics in ArcGIS were applied to both the values and disvalues point datasets (Brown et al. Citation2018). This point pattern analysis indicated the extent to which a set of data points were clustered or dispersed. Nearest Neighbor ratio values below one indicated spatial clustering while values above one indicated spatial dispersion in a dataset. Next, a kernel density estimation in ArcGIS was completed to visualize the spatial concentration of the data points. A fixed bandwidth was developed for this analysis using the calculation following Bailey and Gatrell (Citation1995).
Three landscape metrics were also developed and added as layers to the geodatabase for further analysis, including 1) Distance to River; 2) Runoff, and 3) Crop Yield (see ). The Distance to River metric represented the shortest straight-line distance from the main channel of the river to each cell at a 30-m resolution across the study area. The Runoff and Crop Yield metrics were simulated daily using a Soil and Water Assessment Tool (i.e. SWAT model), which is a semi distributed hydrologic model that quantifies the impacts of land management practices in a watershed. Being a hydrologic model, SWAT can simulate the hydrologic processes at the watershed scale. In addition, it has an ecological component that can simulate plant growth changes and nutrient cycling for agricultural landscapes. The model developed for this research was validated against observational data in Acero et al. (Citation2021). Specifically, the daily values of runoff and crop yield from SWAT were converted into annual average values and then uploaded to the geodatabase. Additionally, Crop Yield was estimated by additively combining corn and soybean yields. The rationale for selecting these three metrics as well as the detailed description of the model and results can be found in Acero et al. (Citation2021).
Table 1. Description and range of three landscape metrics analyzed in relation to the perceived values and disvalues derived from the Kaskaskia River Watershed.
A kernel density map was created as an exploratory step to visualize the spatial distribution of the data points. A fixed bandwidth was developed for the kernel map using the calculation following Bailey and Gatrell (Citation1995). Next, Average Nearest Neighbor statistics in ArcGIS were applied to test for global clustering of values and disvalues. This point pattern analysis indicated the extent to which a set of data points were clustered or dispersed. Additionally, spatial clustering between the mapped data layers was assessed using the cross K-function to determine if different types of points (values versus disvalues) were clustered near each other.
Analysis of social-ecological data
Both values and disvalues were analyzed in relation to three landscape metrics that represented social-ecological stressors in the Kaskaskia River Watershed. The four most salient values were analyzed separately from the four most salient disvalues using the digitized points derived from the participatory mapping exercises, which were weighted according to the preference points allocated to each value and disvalue presented to the study participants. Using a GIS mapping application called ‘Social Values for Ecosystem Services’ (SolVES) (Sherrouse et al. Citation2011, Citation2014), Value Index and Disvalue Index scores were created as a standardized representation of the relative importance and spatial location of values and disvalues, respectively. The SolVES program worked in conjunction with Maximum Entropy (MaxEnt) modeling (Phillips et al. Citation2006), which was originally developed as a species distribution modeling tool to determine the probability of the presence of a species based on its known location in relation to its habitat depicted by landscape metrics. MaxEnt uses machine learning to generate logistic surface layers for each value and disvalue type to indicate the likelihood – on a cell-by-cell basis – that places within the watershed would be selected by respondents (Sherrouse et al. Citation2014). To do this, the program drew from the three landscape metrics that we developed using a SWAT model (i.e. Distance to River, Runoff, and Crop Yield) previously developed by Acero Triana et al (Citation2021, Citation2022). and partitioned the value and disvalue points into training and test data to develop spatial prediction layers. The resulting logistic surface layers were characterized using zonal statistics that included mean value scores to reflect the relationships between our social science point data and the three landscape metrics (see van Riper et al. Citation2017). To evaluate the predictive capacity of models generated using our social and ecological data, Area Under the Curve (AUC) statistics were calculated by MaxEnt (Swets Citation1988).
Results
The most prominent values and disvalues
Results from the participatory mapping exercises revealed the relative importance of values and disvalues across the Kaskaskia River Watershed, while transcripts from the group discussions provided rich details of participant viewpoints by contextualizing the preference points and mapped data within a broader regional discourse (see Supplementary Material). The four most salient values identified in the watershed were recreation, erosion protection, crop production, and flood control. These four values were selected for further analysis based on participant accounts of how they interacted with the watershed (see ).
Figure 2. Average value points (mean ± standard error) assigned by respondents (n = 52) to (a) 18 values and (b) 14 disvalues of the Kaskaskia River Watershed.
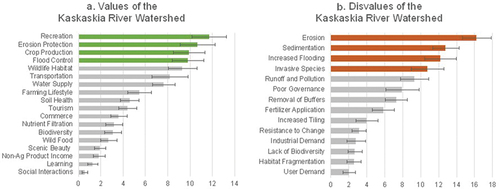
First, a diversity of nature-based recreation opportunities emerged and included boating, fishing, sightseeing, camping, and exploring the traditional farming lifestyle of Amish communities. For example, a participant from Reach 1 highlighted the importance of recreational boating: ‘We have over 300 slips in the marina and probably 150 of them are houseboats. People will come down every weekend. We have people that have been coming down from Chicago renting boats for 40 years’. Another participant from Reach 2 stressed the significance of fishing activity on the lake and its associated river networks by indicating ‘ … the lake is the more important part to me, realizing that there’s fishing going on the river, etc. That was what was important to me’. Second, regarding erosion protection, one participant from Reach 1 stressed the value of vegetation cover in keeping the soil intact in their statement: ‘I think the filtration of nutrients is an important benefit. Vegetative buffer grass and riparian forest buffers are also important’. Another participant from Reach 2 observed, ‘it’s always the erosion [protection] because that affects the farming, the livestock, the lake, the recreation, all the above’. Third, crop production was largely considered the ultimate value of the watershed due to the financial support it provides, as illustrated by a participant from Reach 3: ‘Everything is related to farming. That’s got to be the main moneymaker’. Another participant from Reach 2 underscored the importance of farming to meet human survival needs: ‘Crops are important to life’. Finally, flood control was a salient value. Participants recognized the critical role of having trees and vegetation in the landscape that could absorb the excess runoff water, and one individual from Reach 3 stressed the importance of Lake Shelbyville and Carlyle Lake serving as critical buffers during heavy downpours that would otherwise cause damage to residents’ properties:
And that wouldn’t have been for Shelbyville or would it have been for Carlyle? There was [sic] over 50,000 CFS [cubic feet per second or water] coming down here. And then in a station out there. Carlyle was taking it in and holding 50,000. It would have been double the flood in 2015. And it would have washed out bridges, interstate, railroad. It would have damaged a lot of people’s homes besides mine.
The four most salient disvalues associated with the Kaskaskia River watershed were erosion, siltation and sedimentation, increased flooding, and invasive species (see ). First, a participant from Reach 2 provided insight on the importance of erosion, while also nuancing a deeper understanding of how erosion should be understood: ‘To me, the erosion should be divided into two, as sheet erosion on the fields and bank erosion. The bank erosion on the Kaskaskia between here and Shelbyville is by far the biggest problem’. Another farmer participant from Reach 3 shared their interest in halting erosion of farmland so that the next generation could farm by saying, ‘I would like to actually keep in the family (farmland), make it better for them. Farms around the Kaskaskia that are losing some property to erosion and actually figure out a way to stop that’.
Three other prominent disvalues emerged, the first of which was sedimentation. A participant from Reach 2 argued sedimentation was a function of landscape alterations: ‘Siltation and sedimentation was my number one threat. The increased tilling and removal of environmental buffers drives siltation’. Another participant from Reach 1, while acknowledging the sedimentation and siltation problem in the region, believed that sedimentation at the bottom of Lake Shelbyville and Carlyle Lake that could have resulted from continued siltation over the decades when he stated: ‘There really hasn’t been anything done. Well, I’ve been on the drainage district that includes the main stem for about 20 years and we have done no dredging’. Third, participants shared memories from the region while they underscored the importance of considering floods as a hazard. For instance, a participant from Reach 1 recalls: ‘We farm right there. And there’s 30 acres of river bottoms on that farm. It used to take a day for the water to get down there, now takes about 12 hours’. Another participant from Reach 3 recounted: ‘The floods of 2012 and 2015, we would have had water over the interstate. We would’ve lost the railroads and bridges up at 161 (a local highway)’. Finally, participants discussed the role of invasive fish species and exotic plants as a disvalue to the Kaskaskia River Watershed. One participant from Reach 1 expressed concern about invasive fish species replacing native ones in their water bodies over the decades: “I just can’t believe they are not in there. It’s just a matter of time … It just takes one fish on the other side of the dam. And you got them, you know? Another participant from Reach 1 articulated how exotic invasive plants posed threats to their farmlands aside from the invasive fish species in water bodies: ‘All of the invasive species and not just fish. They brought them. The state has brought them in and planted them in the 80’s and now our neighbors have got them, and they planted them’.
In addition to the highly ranked values and disvalues, participants expressed concerns about a range of topics; they emphasized how each of the mapped points was nested in a closely interconnected system, thus making it difficult to evaluate the relative importance of one. For example, during the focus groups, participants either explicitly or implicitly mentioned the intricate associations among intensive crop production, fertilizer application, soil health, deforestation, runoff and pollution, and lack of biodiversity. Participants also shared the realization that addressing the multi-faceted issues afflicting the watershed would be challenging and require broad consensus, as well as coordination at different scale to develop more sustainable management of agroecosystems.
Spatial dynamics of values and disvalues
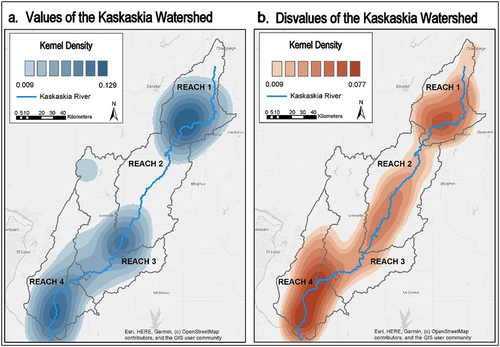
The point data that were generated from the participatory mapping exercises illustrated not only the relative importance of values and disvalues, but also the spatial patterns of these perceived landscape features. Results from the Average Nearest Neighbor analysis showed that significant clustering occurred throughout the watershed for both if the values (NN ratio = 0.479, z-score = −21.637, p < 0.001) and disvalues (NN ratio = 0.667; z-score = −11.427, p < 0.001) assigned to places by the study participants. Kernel density maps generated from a spatial clustering analysis revealed high density areas of points located along the Kaskaskia River (see ). The densest area of both value and disvalue point assignments was in the southern and central parts of Reach 4. Other high-density areas of value abundance were observed in the southern half of Reach 1 and the southwestern corner of Reach 2.
Figure 3. Kernel density maps showing the values (n = 471) and disvalues (n = 322) that were spatially located by study participants during participatory mapping exercises. Darker colors of blue and orange indicate higher density of values and disvalues, respectively, across the Kaskaskia River Watershed.
Relationships between social and ecological data
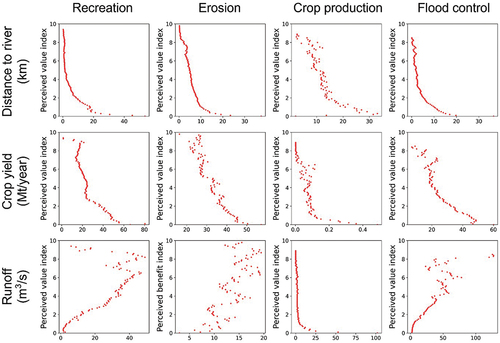
Results from our analysis of social-ecological data using SolVES and MaxEnt revealed how values and disvalues were changing in relation to conditions including Distance to the Kaskaskia River, Runoff and Crop Yield (see ). Good fitting models were developed according to our training (AUC = 0.91 for values and 0.89 for disvalues) and test data (AUC = 0.71 for both values and disvalues). The zonal statistics generated with SolVES (i.e. zones defined by the integer values from the Value Index scores) were used to illustrate the relationships between social and ecological data. Distance to River was negatively related to all four values, given that as distance increased, the perceived benefits of places exponentially decreased (see top panels in ). More variation emerged with respect to the relationship between crop production and Distance to River, such that places farther away from the river were likely to carry stronger crop production values according to study participants. The second landscape metric of Crop Yield was analyzed in relation to the four most salient values, and negative relationships emerged indicating that as crop yield of an area increased, participants were less likely to associate these places with recreation, crop production, erosion protection, and flood control (see middle panels in ). Finally, runoff (i.e. flow of water on the ground surface) was evaluated in relation to the perceived benefits of places and showed weak, positive relationships with recreation, erosion protection, and flood control but a strong negative relationship with the value of crop production (see bottom panels in ). Specifically, areas with greater runoff were less likely to be seen as beneficial for the purposes of providing corn and soy to local communities. Areas with runoff greater than 25 m3/s were perceived to carry little value for crop production. The increase in the disvalues with the proximity to the river is expected because they are all driven by runoff whose impacts are significantly high closer to water bodies. For instance, erosion is more severe closer to the river since the river has a lower elevation and that is where flow accumulates. Similarly, the higher runoff provides a better habitat for species in terms of food availability and mobility.
Figure 4. Zonal statistics showing the relationships between the average values for three landscape metrics plotted on the x-axes and value index scores for the four primary values of the Kaskaskia River Watershed plotted on the y-axes. Social-ecological relationships are depicted for the values of recreation, erosion protection, crop production, and flood control.
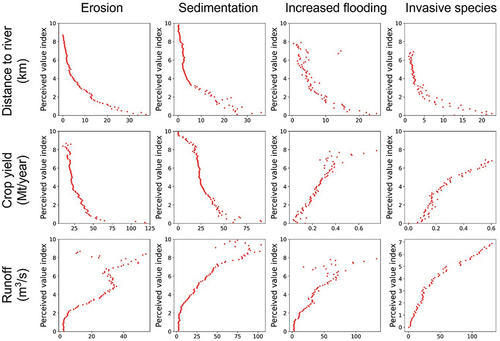
Results from our comparison of perceived disvalues to the Kaskaskia River Watershed in relation to three landscape metrics showed varied directional relationships (see ). Specifically, Distance to River was strongly and negatively correlated with all four perceived disvalues, in that as distance increased, concerns about erosion, sedimentation, increased flooding, and invasive species lessened. Erosion in relation to the landscape metric of crop yield was also negative, likely due to the common understanding that soil erosion is caused by cropping operations (e.g. tilling). Runoff was positively related to the four perceived disvalues, in that areas with higher runoff were rated with increased threats of erosion, sedimentation, flooding, and invasive species.
Figure 5. Relationships between the disvalue index and landscape metrics (i.e. distance to river, agricultural runoff, crop yield) for the four primary disvalues of erosion, sedimentation, increased flooding, and invasive species.
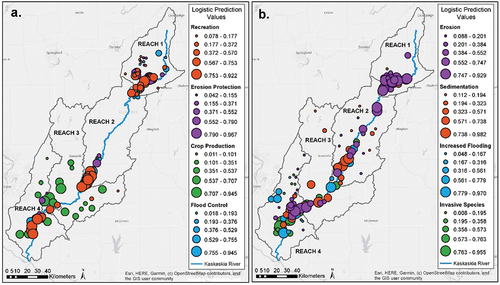
The projected probability of the distribution of both values and disvalues varied across the landscape (see ). We observed uneven spatial patterns across the four primary values of recreation, erosion protection, crop protection, and flood control that were clustered in the northern portion of the watershed and along the main stem of the Kaskaskia River. In particular, crop production was almost exclusively concentrated in the lower two reaches of the watershed. The four primary disvalues of erosion, sedimentation, increased flooding, and invasive species were more evenly distributed along the main stem of the Kaskaskia River and concentrated toward the southern end of the watershed. Concerns about increased flooding and invasive species were associated with the lower three reaches, but not the Upper Kaskaskia.
Figure 6. Projected probability of presence for the: (a) Four primary values of recreation, erosion protection, crop production, and flood control, and (b) Four primary disvalues of erosion, sedimentation, increased flooding, invasive species in the Kaskaskia River watershed. The point data used to represent specific locations (n = 793) were assigned by all focus group participants (n = 52) and analyzed in relation to three landscape metrics to generate logistic surface layers using maximum entropy modeling.
Discussion
This study demonstrates that nature’s contributions to people can be depicted in spatially explicit ways to give more balanced consideration to the social and ecological dynamics that characterize agro-production systems. Residents in the Kaskaskia River Watershed of Illinois, USA identified a diverse suite of values and disvalues related to recreation, crop production, and environmental degradation (i.e. erosion, flooding, invasive species). We observed that these values and disvalues exhibited distinct spatial patterns and were concentrated at opposite ends of the agricultural watershed, yet both tended to congregate along the main stem of the Kaskaskia River, thus identifying specific locales that warrant research attention and that can be prioritized by local leaders and policymakers. Our focus on the relationships between the perceived qualities of places and landscape features (i.e. distance to river, agricultural runoff, crop yield) also offered a template for building transdisciplinary knowledge of the relationships between expert residents and social-ecological conditions. We aimed to empower our study participants with an opportunity to share their perspectives and thus catalyze more fair and equitable consideration of local residents as part of a process for advancing more sustainable management of agroecosystems.
Given that human-environment interactions within working landscapes generate both positive and negative associations with places, the idea of (dis)values (Lliso et al. Citation2022) was useful for building a more complete representation of how individuals and groups interacted with places. Our conceptual framework encompassed the values and disvalues of nature and extended previous research by Pascual et al. (Citation2023) as part of the IPBES Values Assessment. We observed that the contexts for participants’ judgments about both the desirable outcomes (i.e. values), concern for undesirable outcomes (i.e. disvalues), and the spatial relationships that existed between them paralleled the IPBES notion of ‘specific values’. The insights shared by our study participants were sometimes rooted in past experiences that also brought disvalues to the surface. For example, the spatial distribution of erosion control was believed to be stronger near the river compared to distant locations due to past experiences and first-hand knowledge of the risks of erosion on poorly managed stream embankments. Although the IPBES framework recognizes the interrelationship of values and their interconnections with knowledge systems, the specific situations in which people interacted with nature through our study provided insight into the uptake, prioritization, and relevance of both positive and negative associations with nature for policymaking. We suggest that the social-ecological lens of this research coupled with its sensitivity to spatial relations was well-suited for describing the linkages between values and disvalues.
We identified and spatialized the values and disvalues of the Kaskaskia River watershed using PPGIS methods (Brown and Weber Citation2012; Brown et al. Citation2020). On one hand, the predominant values of recreation, crop production, erosion protection, and flood control emphasized the importance of water, and rivers in particular, as the lifeblood for sustaining the provision of nature’s benefits to people (Wardropper et al. Citation2015; Yeakley et al. Citation2016; Garcia-Martin et al. Citation2017). Indeed, aquatic resources within the watershed offered a host of opportunities for supporting well-being, quality of life and even local livelihood (Swinton et al. Citation2007; Assandri et al. Citation2018). These benefits were also a major source for structural control of water flow rates, contaminants, and biodiversity conservation (Schilling et al. Citation2023). Our findings reinforce previous PPGIS research that has demonstrated the multifunctional and often contrasting nature of benefits provided by agricultural watersheds, such as recreation vs. crop production (Braslow et al. Citation2016; Cusens et al. Citation2022). On the other hand, study participants ranked erosion, sedimentation, increased flooding, and invasive species as primary threats identified facing the agricultural watershed (Shipley et al. Citation2020). These findings are consistent with studies that have demonstrated negative impacts of agricultural intensification on water and soil quality (Matson et al. Citation1997; Berka et al. Citation2001). In contrast to values, disvalues were distributed more evenly along the Kaskaskia River and concentrated toward the southern end of the watershed. The lower reaches had particularly high perceived values for crop production in parallel with concerns about invasive species and flood control. The more uniform spatial distribution of disvalues may indicate that participants were more uncertain about the location of disvalues than values. Alternatively, the elevated disvalues of the main stem could be due to floods that have occurred in recent decades. These floods have generated concern and brought visibility to the need for flood control and careful management of other benefits from the river, particularly for nearby communities (Shipley et al. Citation2022). Similar to values, all four disvalues increased with proximity to rivers.
We observed that the values and disvalues of places exhibited statistically significant spatial clustering, specifically along the main stem of the Kaskaskia River. This concentration of values and disvalues could be due to several factors. First, given that an estimated 97.6% of the watershed is privately owned (Krohe Citation2001), the major public areas were two reservoirs managed by the Army Corps of Engineers in Reaches 1 and 2. It could be that these were considered iconic places and visible settings for those who live and work in the region (Taylor and Stemler Citation2006). Secondly, many participants were staff members of public agencies and previously collaborated on initiatives related to the reservoirs and surrounding land, rendering a strong shared knowledge based with a focus on the main stem and reservoirs. Thirdly, the Kaskaskia River and its two reservoirs are well-marked and visible along the many roads that crisscross the watershed. They often have viewpoints or pull-outs that invite travelers to step out of their cars and rest, which keeps the main stem and reservoirs at the top of one’s mind. Finally, the morphology of Reach 1 is comparatively hilly and has higher risks of erosion, along with a settlement pattern of Amish families that have comparatively smaller family farms resulting in a distinct sense of place (Zook Citation1994). The uneven distribution of benefits from the watershed highlights the importance of public goods and services that contribute disproportionately to human well-being and quality of life (Hale et al. Citation2019; Thiele et al. Citation2020).
Our social-ecological research approach identified areas of concern to support future resource management and conservation (van Berkel and Verburg Citation2014; Hirons et al. Citation2016). Given that most attention was directed toward the main stem of the river, participant knowledge of the broader basin was underrepresented. That is, places that were more distant from the Kaskaskia River tended to be undervalued. For example, integration of the SWAT model with participatory mapping results showed that Crop Yield was negatively associated with crop production according to study participants. It could be that weaknesses in a participatory mapping process can be unveiled by ecological modelling results (Sherrouse et al. Citation2011). Moreover, there were weak relationships observed between Runoff and several perceived values such as erosion, possibly owing to lower knowledge of runoff processes. Indeed, runoff is a complex process that might not be widely understood by non-experts. The increase in disvalues relative to proximity to the river could indicate that accessibility, knowledge, and remoteness may play a role in the values perceived by people. These results demonstrate that social and ecological data should be coupled and considered in concert to inform future management initiatives that aim to account for the importance of rivers to community members and thus support sustainable management of multifunctional landscapes.
We examined how expert residents valued an agricultural watershed to advance a process of balancing competing interests, prioritizing scarce resources, and incorporating public opinion in the decision-making process (Prokopy and Genskow Citation2016). In response to coupled social-ecological knowledge, we found potential evidence of tradeoffs among nature’s contributions to people. Specifically, the strong inverse correlations between crop yield and the perceived value indices for recreation, erosion protection, and flood control demonstrated that participants realized the potential impacts of increased agricultural intensification, despite the critical importance of crop production as a benefit of agroecosystems (Acero et al. Citation2022). This result may signal the potential for conflict among individuals who value agriculture over other important services such as recreation or biodiversity conservation (Henle et al. Citation2008). However, our approach of uniting community members to build interactional expertise through deliberation may provide a way forward to preemptively identify and circumvent contentious resource management topics. Given that facilitated dialogue has been shown to shift values in previous research (Andrade et al. Citation2023), it could be that our participatory research approach is used as a mechanism for future efforts to build social cohesion and more deeply understand sources of concern. We therefore contend that useful knowledge can be generated from the interactions among community members with different levels of expertise through reflections on the diverse range of benefits that emerge from their local environments (Carolan Citation2006).
Conclusions and management implications
We provide an integrated, publicly informed perspective of the values and disvalues of the Kaskaskia River Watershed. A diverse range of benefits and threats facing an agro-production system are showcased in response to in-depth focus group discussions and point data from participatory mapping exercises with expert community members. When combined with landscape metrics generated using a SWAT model, we show that most expert attention is directed toward areas in close proximity to the Kaskaskia River corridor, demonstrating its instrumental role in sustaining the provision of services to communities. Specifically, sections of the river (e.g. the northern and southern ends of the watershed) emerged as the epicenters of both values and disvalues that will require future policy and/or management attention. We also found discordances in our combined social and ecological data, indicating a potential lack of awareness of nature’s contributions to people originating outside of the main stem of the Kaskaskia River. This knowledge gap merits further consideration, as do management efforts focused on sustaining publicly available resources provided by agricultural watersheds.
Supplementary Material
Download PDF (223 KB)Acknowledgements
Thanks are extended to Drs. Nathan Shipley, Cory Suski, and Jeff Stein for their contributions to the conceptualization of this project and assistance with data collection. Yen-Hsuan “Kimmy” Chang and Haley Ware were also instrumental in developing earlier versions of this manuscript and entering survey data. Juan Sebastian Acero Triana was also instrumental in developing the SWAT model and landscape metrics analyzed using the SoLVES software.
Disclosure statement
No potential conflict of interest was reported by the author(s).
Supplementary material
Supplemental data for this article can be accessed online at https://doi.org/10.1080/26395916.2024.2309391
Correction Statement
This article has been corrected with minor changes. These changes do not impact the academic content of the article.
Additional information
Funding
References
- Acero JS, Chu ML, Shipley NJ, van Riper CJ, Stewart WP, Suski CD. 2022. A decision-making framework for evaluating environmental tradeoffs in enhancing ecosystem services across complex agricultural landscapes. J Environ Manage. 314:115077. doi: 10.1016/j.jenvman.2022.115077.
- Acero Triana JS, Chu ML, Stein JA. 2021. Assessing the impacts of agricultural conservation practices on freshwater biodiversity under changing climate. Ecol Modell. 453:109604. doi: 10.1016/j.ecolmodel.2021.109604.
- Adger WN, Hughes TP, Folke C, Carpenter SR, Rockstrom J. 2005. Social-ecological resilience to coastal disasters. Science. 309(5737):1036–15. doi: 10.1126/science.1112122.
- Alessa L, Kliskey A, Brown G. 2008. Social–ecological hotspots mapping: a spatial approach for identifying coupled social–ecological space. Landsc Urban Plan. 85(1):27–39. doi: 10.1016/j.landurbplan.2007.09.007.
- Andrade R, van Riper CJ, Goodson DJ, Johnson DN, Stewart W, López-Rodríguez MD, Raymond CM. 2023. Values shift in response to social learning through deliberation about protected areas. Glob Environ Chan. 78:102630. doi: 10.1016/j.gloenvcha.2022.102630.
- Assandri G, Bogliani G, Pedrini P, Brambilla M. 2018. Beautiful agricultural landscapes promote cultural ecosystem services and biodiversity conservation. Agr Ecosyst Environ. 256:200–210. doi: 10.1016/j.agee.2018.01.012.
- Bailey TC, Gatrell AC. 1995. Interactive spatial data analysis. Vol. 413. No. 8. Essex: Longman Scientific & Technical.
- Berka C, Schreier H, Hall K. 2001. Linking water quality with agricultural intensification in a rural watershed. Water Air Soil Pollut. 127(1/4):389–401. doi: 10.1023/A:1005233005364.
- Berkes F, Colding J, Folke C, editors. 2008. Navigating social-ecological systems: building resilience for complexity and change. New York: Cambridge University Press.
- Braslow J, Cordingley JE, Snyder KA. (2016). A guide for participatory mapping of ecosystem services in multiuse agricultural landscapes: how to conduct a rapid spatial assessment of ecosystem services.
- Brown G, Fagerholm N. 2015. Empirical PPGIS/PGIS mapping of ecosystem services: a review and evaluation. Ecosyst Serv. 13:119–133. doi: 10.1016/j.ecoser.2014.10.007.
- Brown G, Reed P, Raymond CM. 2020. Mapping place values: 10 lessons from two decades of public participation GIS empirical research. Appl Geogr. 116:102156. doi: 10.1016/j.apgeog.2020.102156.
- Brown G, Rhodes J, Dade M. 2018. An evaluation of participatory mapping methods to assess urban park benefits. Landsc Urban Plan. 178:18–31. doi: 10.1016/j.landurbplan.2018.05.018.
- Brown G, Weber D. 2012. Measuring change in place values using public participation GIS (PPGIS). Appl Geogr. 34:316–324. doi: 10.1016/j.apgeog.2011.12.007.
- Carolan MS. 2006. Sustainable agriculture, science and the co-production of ‘expert’ knowledge: the value of interactional expertise. Local Environ. 11(4):421–431. doi: 10.1080/13549830600785571.
- Chan KM, Guerry AD, Balvanera P, Klain S, Satterfield T, Basurto X, Woodside U. 2012. Where are cultural and social in ecosystem services? A framework for constructive engagement. BioScience. 62(8):744–756. doi: 10.1525/bio.2012.62.8.7.
- Cinner JE, Barnes ML. 2019. Social dimensions of resilience in social-ecological systems. One Earth. 1(1):51–56. doi: 10.1016/j.oneear.2019.08.003.
- Cusens J, Barraclough AM, Måren IE. 2022. Participatory mapping reveals biocultural and nature values in the shared landscape of a Nordic UNESCO Biosphere Reserve. People Nat. 4(2):365–381. doi: 10.1002/pan3.10287.
- DeClerck FA, Jones SK, Attwood S, Bossio D, Girvetz E, Chaplin-Kramer B, Zhang W. 2016. Agricultural ecosystems and their services: the vanguard of sustainability? Curr Opin Env Sust. 23:92–99. doi: 10.1016/j.cosust.2016.11.016.
- Díaz S, Pascual U, Stenseke M, Martín-López B, Watson RT, Molnár Z, Shirayama Y. 2018. Assessing nature’s contributions to people. Science. 359(6373):270–272. doi: 10.1126/science.aap8826.
- Dziegielewski B, Thomas T. 2011. Future water demands and coal development potential in Kaskaskia River basin in Illinois. Carbondale, IL: Southern Illinois University Carbondale.
- Fischer RA, Byerlee D, Edmeades GO. 2014. Crop yields and global food security: will yield increase continue to feed the world? ACIAR Monograph No. 158. Australian Centre for International Agricultural Research: Canberra: p. xxii + 634.
- Folke C, Hahn T, Olsson P, Norberg J. 2005. Adaptive governance of social-ecological systems. Annu Rev Environ Resour. 30(1):441–473. doi: 10.1146/annurev.energy.30.050504.144511.
- Garbach K, Milder JC, DeClerck FAJ, Montenegro de Wit M, Driscoll L, Gemmill-Herren B. 2017. Examining multi-functionality for crop yield and ecosystem services in five systems of agroecological intensification. Int J Agric Sustain. 15(1):11–28. doi: 10.1080/14735903.2016.1174810.
- Garcia-Martin M, Fagerholm N, Bieling C, Gounaridis D, Kizos T, Printsmann A, Müller M, Lieskovský J, Plieninger T. 2017. Participatory mapping of landscape values in a Pan-European perspective. Landsc Ecol. 32(11):2133–2150. doi: 10.1007/s10980-017-0531-x.
- García-Nieto AP, Quintas-Soriano C, García-Llorente M, Palomo I, Montes C, Martín-López B. 2015. Collaborative mapping of ecosystem services: the role of stakeholders’ profiles. Ecosyst Serv. 13:141–152. doi: 10.1016/j.ecoser.2014.11.006.
- Garnett ST, Burgess ND, Fa JE, Fernández-Llamazares Á, Molnár Z, Robinson CJ, Leiper I, Zander KK, Austin B, Brondizio ES, Collier NF. 2018. A spatial overview of the global importance of indigenous lands for conservation. Nat Sustain. 1(7):369–374. doi: 10.1038/s41893-018-0100-6.
- Gosling E, Williams KJ. 2010. Connectedness to nature, place attachment and conservation behaviour: testing connectedness theory among farmers. J Environ Psychol. 30(3):298–304. doi: 10.1016/j.jenvp.2010.01.005.
- Gould RK, Pai M, Muraca B, Chan KM. 2019. He ʻike ʻana ia i ka pono (it is a recognizing of the right thing): how one indigenous worldview informs relational values and social values. Sustain Sci. 14(5):1213–1232. doi: 10.1007/s11625-019-00721-9.
- Hale RL, Cook EM, Beltrán BJ. 2019. Cultural ecosystem services provided by rivers across diverse social-ecological landscapes: a social media analysis. Ecol Indic. 107:105580. doi: 10.1016/j.ecolind.2019.105580.
- Hanaček K, Rodríguez-Labajos B. 2018. Impacts of land-use and management changes on cultural agroecosystem services and environmental conflicts—a global review. Glob Environ Chan. 50:41–59. doi: 10.1016/j.gloenvcha.2018.02.016.
- Hein L, van Koppen K, De Groot RS, van Ierland EC. 2006. Spatial scales, stakeholders and the valuation of ecosystem services. Ecol Econ. 57(2):209–228. doi: 10.1016/j.ecolecon.2005.04.005.
- Henle K, Alard D, Clitherow J, Cobb P, Firbank L, Kull T, Young J. 2008. Identifying and managing the conflicts between agriculture and biodiversity conservation in Europe–a review. Agr Ecosyst Environ. 124(1–2):60–71. doi: 10.1016/j.agee.2007.09.005.
- Hirons M, Comberti C, Dunford R. 2016. Valuing cultural ecosystem services. Annu Rev Environ Resour. 41(1):545–574. doi: 10.1146/annurev-environ-110615-085831.
- Hölting L, Komossa F, Filyushkina A, Gastinger MM, Verburg PH, Beckmann M, Cord AF. 2020. Including stakeholders’ perspectives on ecosystem services in multifunctionality assessments. Ecosyst People. 16(1):354–368. doi: 10.1080/26395916.2020.1833986.
- King E, Cavender-Bares J, Balvanera P, Mwampamba TH, Polasky S. 2015. Trade-offs in ecosystem services and varying stakeholder preferences: evaluating conflicts, obstacles, and opportunities. Ecol Soc. 20(3). doi: 10.5751/ES-07822-200325.
- Klain SC, Chan KM. 2012. Navigating coastal values: participatory mapping of ecosystem services for spatial planning. Ecol Econ. 82:104–113. doi: 10.1016/j.ecolecon.2012.07.008.
- Krohe J Jr. 2001. The Kaskaskia River basin: an inventory of the region’s resources. Springfield: Illinois Department of Natural Resources Office of Realty and Environmental Planning.
- Lamarque P, Tappeiner U, Turner C, Steinbacher M, Bardgett RD, Szukics U, Schermer M, Lavorel S. 2011. Stakeholder perceptions of grassland ecosystem services in relation to knowledge on soil fertility and biodiversity. Reg Environ Chan. 11(4):791–804. doi: 10.1007/s10113-011-0214-0.
- Lee YC, Ahern J, Yeh CT. 2015. Ecosystem services in peri-urban landscapes: the effects of agricultural landscape change on ecosystem services in Taiwan’s western coastal plain. Landsc Urban Plan. 139:137–148. doi: 10.1016/j.landurbplan.2015.02.023.
- Leitschuh B, Stewart WP, van Riper CJ. 2022. Place-making in the Corn Belt: the productivist landscapes of the “good farmer”. J Rural Stud. 92:415–424.
- Lescourret F, Magda D, Richard G, Adam-Blondon AF, Bardy M, Baudry J, Soussana JF. 2015. A social–ecological approach to managing multiple agro-ecosystem services. Curr Opin Env Sust. 14:68–75. doi: 10.1016/j.cosust.2015.04.001.
- Liu J, Dietz T, Carpenter SR, Alberti M, Folke C, Moran E, Taylor WW. 2007. Complexity of coupled human and natural systems. Science. 317(5844):1513–1516. doi: 10.1126/science.1144004.
- Lliso B, Lenzi D, Muraca B, Chan KM, Pascual U. 2022. Nature’s disvalues: what are they and why do they matter? Curr Opin Env Sust. 56:101173. doi: 10.1016/j.cosust.2022.101173.
- Lobao L, Meyer K. 2001. The great agricultural transition: crisis, change, and social consequences of twentieth century US farming. Annu Rev Sociol. 27(1):103–124. doi: 10.1146/annurev.soc.27.1.103.
- Matson PA, Parton WJ, Power AG, Swift MJ. 1997. Agricultural intensification and ecosystem properties. Science. 277(5325):504–509. doi: 10.1126/science.277.5325.504.
- McDonald BA, Stukenbrock EH. 2016. Rapid emergence of pathogens in agro-ecosystems: global threats to agricultural sustainability and food security. Phil Trans R Soc B. 371(1709):20160026. doi: 10.1098/rstb.2016.0026.
- Mehryar S, Sliuzas R, Sharifi A, Reckien D, van Maarseveen M. 2017. A structured participatory method to support policy option analysis in a social-ecological system. J Environ Manage. 197:360–372. doi: 10.1016/j.jenvman.2017.04.017.
- Milcu AI, Hanspach J, Abson D, Fischer J. 2013. Cultural ecosystem services: a literature review and prospects for future research. Ecol Soc. 18(3). doi: 10.5751/ES-05790-180344.
- Mullendore ND, Ulrich-Schad JD, Prokopy LS. 2015. US farmers’ sense of place and its relation to conservation behavior. Landsc Urban Plan. 140:67–75. doi: 10.1016/j.landurbplan.2015.04.005.
- Ostrom E. 2009. A general framework for analyzing sustainability of social-ecological systems. Science. 325(5939):419–422. doi: 10.1126/science.1172133.
- Pascual U, Balvanera P, Anderson CB, Chaplin-Kramer R, Christie M, González-Jiménez D, Martin A, Raymond CM, Termansen M, Vatn A, et al. 2023. Diverse values of nature for sustainability. Nature. 620(7975):813–823.
- Pérez-Ramírez I, García-Llorente M, Saban de la Portilla C, Benito A, Castro AJ. 2021. Participatory collective farming as a leverage point for fostering human-nature connectedness. Ecosyst People. 17(1):222–234.
- Phillips SJ, Anderson RP, Schapire RE. 2006. Maximum entropy modeling of species geographic distributions. Ecol Modell. 190(3–4):231–259. doi: 10.1016/j.ecolmodel.2005.03.026.
- Pimentel D, McNair S, Janecka J, Wightman J, Simmonds C, O’Connell C, Wong E, Russel L, Zern J, Aquino T, et al. 2001. Economic and environmental threats of alien plant, animal, and microbe invasions. Agr Ecosyst Environ. 84(1):1–20. doi: 10.1016/S0167-8809(00)00178-X.
- Plieninger T, Schleyer C, Schaich H, Ohnesorge B, Gerdes H, Hernández‐Morcillo M, Bieling C. 2012. Mainstreaming ecosystem services through reformed European agricultural policies. Conserv Lett. 5(4):281–288. doi: 10.1111/j.1755-263X.2012.00240.x.
- Porter J, Costanza R, Sandhu H, Sigsgaard L, Wratten S. 2009. The value of producing food, energy, and ecosystem services within an agro-ecosystem. Ambio. 38(4):186–193. doi: 10.1579/0044-7447-38.4.186.
- Prokopy LS, Genskow K. 2016. Social indicator variations across watersheds: implications for developing outreach and technical assistance programs. Soc Nat. 29(5):617–627. doi: 10.1080/08941920.2015.1081310.
- Prokopy LS, Morton LW, Arbuckle JG Jr, Mase AS, Wilke AK. 2015. Agricultural stakeholder views on climate change: implications for conducting research and outreach. Bull Am Meteorol Soc. 96(2):181–190. doi: 10.1175/BAMS-D-13-00172.1.
- Robards MD, Schoon ML, Meek CL, Engle NL. 2011. The importance of social drivers in the resilient provision of ecosystem services. Glob Environ Chan. 21(2):522–529. doi: 10.1016/j.gloenvcha.2010.12.004.
- Schilling KE, Anderson E, Streeter MT, Theiling C. 2023. Long-term nitrate-nitrogen reductions in a large flood control reservoir. J Hydrol. 620:129533. doi: 10.1016/j.jhydrol.2023.129533.
- Schwartz C, Shaaban M, Bellingrath-Kimura SD, Piorr A. 2021. Participatory mapping of demand for ecosystem services in agricultural landscapes. Agriculture. 11(12):1–20. doi: 10.3390/agriculture11121193.
- Sherrouse BC, Clement JM, Semmens DJ. 2011. A GIS application for assessing, mapping, and quantifying the social values of ecosystem services. Appl Geogr. 31(2):748–760. doi: 10.1016/j.apgeog.2010.08.002.
- Sherrouse BC, Semmens DJ, Clement JM. 2014. An application of Social Values for Ecosystem Services (SolVES) to three national forests in Colorado and Wyoming. Ecol Indic. 36:68–79. doi: 10.1016/j.ecolind.2013.07.008.
- Shipley NJ, Johnson DN, van Riper CJ, Stewart WP, Chu ML, Suski CD, Stein JA, Shew JJ. 2020. A deliberative research approach to valuing agro-ecosystem services in a worked landscape. Ecosyst Serv. 42:101083. doi: 10.1016/j.ecoser.2020.101083.
- Shipley NJ, Stewart WP, van Riper CJ. 2022. Negotiating agricultural change in the Midwestern US: seeking compatibility between farmer narratives of efficiency and legacy. Agric Human Values. 39(4):1465–1476. doi: 10.1007/s10460-022-10339-w.
- Singh BK, Fraser ED, Arnold T, Biermayr-Jenzano P, Broerse JE, Brunori G, Webb P, De Schutter O, Fabbri K, Fan S, Fanzo J. 2023. Food systems transformation requires science–policy–society interfaces that integrate existing global networks and new knowledge hubs. Nat Food. 4(1):1–3. doi: 10.1038/s43016-022-00664-y.
- Slemp C, Davenport MA, Seekamp E, Brehm JM, Schoonover JE, Williard KW. 2012. “Growing too fast:” local stakeholders speak out about growth and its consequences for community well-being in the urban–rural interface. Landsc Urban Plan. 106(2):139–148. doi: 10.1016/j.landurbplan.2012.02.017.
- Steger C, Hirsch S, Evers C, Branoff B, Petrova M, Nielsen-Pincus M, Wardropper C, van Riper CJ. 2018. Ecosystem services as boundary objects for transdisciplinary collaboration. Ecol Econ. 143:153–160. doi: 10.1016/j.ecolecon.2017.07.016.
- Steinhoff-Knopp B, Kuhn TK, Burkhard B. 2021. The impact of soil erosion on soil-related ecosystem services: development and testing a scenario-based assessment approach. Environ Monit Assess. 193(S1). doi: 10.1007/s10661-020-08814-0.
- Stewart WP, Gobster PH, Rigolon A, Strauser J, Williams DA, van Riper CJ. 2019. Resident-led beautification of vacant lots that connects place to community. Landsc Urban Plan. 185:200–209.
- Swets JA. 1988. Measuring the accuracy of diagnostic systems. Science. 240(4857):1285–1293. doi: 10.1126/science.3287615.
- Swinton SM, Lupi F, Robertson GP, Hamilton SK. 2007. Ecosystem services and agriculture: cultivating agricultural ecosystems for diverse benefits. Ecol Econ. 64(2):245–252. doi: 10.1016/j.ecolecon.2007.09.020.
- Taylor J, Stemler J. 2006. The Kaskaskia Watershed: a case study on cooperation, conflicting project purposes, and the watershed approach. In: Zimbelman D, Loehlein WC, editors. Operating reservoirs in changing conditions. Sacramento, CA: Environmental and Water Resources Institute of the American Society of Civil Engineers; p. 156–165.
- Thiele J, Albert C, Hermes J, von Haaren C. 2020. Assessing and quantifying offered cultural ecosystem services of German river landscapes. Ecosyst Serv. 42:101080. doi: 10.1016/j.ecoser.2020.101080.
- Tubiello FN, Fischer G. 2007. Reducing climate change impacts on agriculture: global and regional effects of mitigation, 2000–2080. Technol Forecast Soc. 74(7):1030–1056. doi: 10.1016/j.techfore.2006.05.027.
- van Berkel DB, Verburg PH. 2014. Spatial quantification and valuation of cultural ecosystem services in an agricultural landscape. Ecol Indic. 37:163–174. doi: 10.1016/j.ecolind.2012.06.025.
- van Riper CJ, Kyle GT, Sherrouse BC, Bagstad KJ, Sutton SG. 2017. Toward an integrated understanding of perceived biodiversity values and environmental conditions in a national park. Ecol Indic. 72:278–287. doi: 10.1016/j.ecolind.2016.07.029.
- Walker B, Carpenter S, Anderies J, Abel N, Cumming G, Janssen M, Pritchard R. 2002. Resilience management in social-ecological systems: a working hypothesis for a participatory approach. Conserv Ecol. 6(1). doi: 10.5751/ES-00356-060114.
- Wardropper CB, Chang C, Rissman AR. 2015. Fragmented water quality governance: constraints to spatial targeting for nutrient reduction in a Midwestern USA watershed. Landsc Urban Plan. 137:64–75. doi: 10.1016/j.landurbplan.2014.12.011.
- Wardropper CB, Mase AS, Qiu J, Kohl P, Booth EG, Rissman AR. 2020. Ecological worldview, agricultural or natural resource-based activities, and geography affect perceived importance of ecosystem services. Landsc Urban Plan. 197:103768. doi: 10.1016/j.landurbplan.2020.103768.
- West S, Haider LJ, Stålhammar S, Woroniecki S. 2020. A relational turn for sustainability science? Relational thinking, leverage points and transformations. Ecosyst People. 16(1):304–325.
- Wilhelm JA, Smith RG, Jolejole-Foreman MC, Hurley S. 2020. Resident and stakeholder perceptions of ecosystem services associated with agricultural landscapes in New Hampshire. Ecosyst Serv. 45:101153. doi: 10.1016/j.ecoser.2020.101153.
- Yeakley JA, Ervin D, Chang H, Granek EF, Dujon V, Shandas V, Brown D. 2016. Ecosystem services of streams and rivers. In: Gilvear GJ, Greenwood MT, Thoms MC, Wood PJ, editors. River science: research and management for the 21st century. West Sussex, UK: John Wiley & Sons Ltd; p. 335–352.
- Zagata L, Uhnak T, Hrabák J. 2021. Moderately radical? Stakeholders’ perspectives on societal roles and transformative potential of organic agriculture. Ecol Econ. 190:107208. doi: 10.1016/j.ecolecon.2021.107208.
- Zhang W, Ricketts TH, Kremen C, Carney K, Swinton SM. 2007. Ecosystem services and dis-services to agriculture. Ecol Econ. 64(2):253–260. doi: 10.1016/j.ecolecon.2007.02.024.
- Zook L. 1994. The Amish farm and alternative agriculture: a comparison. J Sustain Agr. 4(4):21–30. doi: 10.1300/J064v04n04_04.