
ABSTRACT
Denitrifying bacterial communities play an important role in nitrogen removal. The diversity, abundance and distribution of denitrifiers can be applied in eutrophication assessment for the bay ecosystems. In this study, the composition and variation of cytochrome cd1-type nitrite reductase gene (nirS)-type denitrifiers in the sediments of Haizhou Bay were investigated by using a PCR-based cloning approach. A total of 156 valid sequences were grouped into 76 OTUs based on 97% sequence similarity. The nirS sequences were identified with their closest-matched sequences from sediments of estuary and eutrophied bay, indicating similarity of the denitrifying bacterial communities in similar coastal environments. Canonical correspondence analysis indicated that nitrogen nutrient and dissolved oxygen were the major contributing parameters for the diversity and spatial distribution of denitrifying bacteria of Haizhou Bay.
1. Introduction
Due to increased anthropogenic accumulation of reactive N, Coastal eutrophication has become one of the largest pollution problems [Citation1]. Microorganism-mediated denitrification is the reduction of nitrate stepwisely to gaseous products (NO, N2O and N2),which is capable of removing significant quantities of the excessive N load from these N-enriched environments. Denitrification activities are more intense in the anaerobic layers of the inner bay, wetland, estuary and marine coastal sediments [Citation2–Citation5]. Globally, about 50% of total nitrogen in the bays and estuaries was removed by denitrification [Citation6,Citation7]. On the other hand, denitrification also contributes to the degradation of xenobiotic pollutants [Citation8]. The influence of anthropogenic activity on denitrification rate and N2O production may manifest itself via the change in denitrifying community structures [Citation9]. The diversity, abundance and distribution of denitrifiers in sediments can provide more information about the quality of the bay eco-environment. Considering redundant nitrogen removal and pollution indicating effects, it is critical to understand the community dynamics and distribution of the underlying denitrifiers in estuarine ecosystems.
Denitrification proceeds by a diverse assemblage of microorganisms, encoding different types of metabolic enzymes [Citation2,Citation10]. The denitrifiers comprise taxonomically and physiologically diverse groups of microorganisms. On account of most of the denitrifiers are difficult to cultivate, the functional genes method is more accurate than 16S rRNA genes. Nitrite reduction to nitric oxide, catalyzed by the cytochrome cd1-containing nirS or Cu-containing nirK nitrite reductase, is the rate-limiting step in denitrification [Citation11,Citation12]. Compared with the nirK gene, nirS gene is more widespread in the bacterial world and is found in the three-quarters of culturable denitrifying bacteria, so the nirS gene is frequently targeted for molecular diversity studies of denitrifiers. Previous studies demonstrated that the nirS-type denitrifying bacterial community structure might be influenced by anthropogenic activities. Denitrifiers should be understood more deeply as a biological indicator for eutrophication assessment.
Haizhou Bay is at the most western end of the southern Yellow Sea and a wide-mouthed inlet belonging to the Jiangsu Province. In recent years with the coastal economic development, the discharge of a large amount of aquaculture and industrial wastewater has resulted in increased organic pollutants and nutrients inputs [Citation13,Citation14]. As a thermal trap for Tianwan nuclear power plants, ecological environment of Haizhou Bay is further affected by the change of water temperature due to the cooling water emissions. Disturbance action of the cooling water and the change of temperature can accelerate the release of nitrogen nutrient from sediment deposition, leading to more serious eutrophication of waters [Citation15,Citation16].
In this study, three representative sites located around the coastal zone of Haizhou Bay were selected and the functional marker gene nirS was used to investigate the diversity, abundance and distribution of denitrifiers in sediments of Haizhou Bay. The basic information and insights of the environmental conditions under anthropogenic stress will be further studied.
2. Materials and methods
2.1 The sample collection and environmental factor measurements
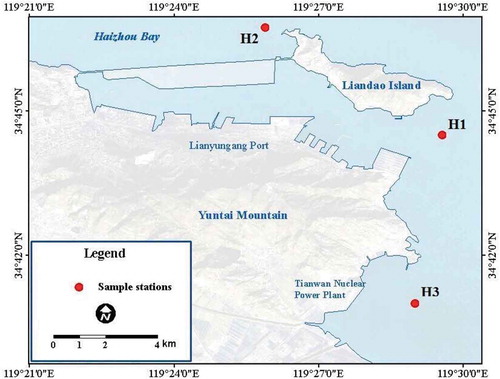
Sediment samples were collected with a column sampler from three stations in Haizhou Bay (). Sediment samples were homogenized and stored in airtight sterile plastic bags at 0°C with ice bag during the cruise and stored at −20°C and −80°C for chemical and microbiological analysis after returning to the laboratory, respectively. The dissolved oxygen (DO) and temperature (T) of surface water were measured using pH meter (Sartorius PB-10, Go¨ttingen, Germany). Pore-water dissolved Nitrate (NO3−), nitrite (NO2−) and ammonium (NH4+) were measured with a nutrient QUAATRO AutoAnalyzer (Bran + Luebbe, Germany). Purge & Trap-Gas Chromatography-Mass Spectrometry (GC-MS) with internal standards was used to quantify volatile organic compounds (VOCs).
Figure 1. Sampling stations in the Haizhou Bay.
2.2 Gene clone library analyses
DNA was extracted from 0.3 g of sediments using a FastPrep DNA Extraction Kit for Soil and a FastPrep FP120 Cell Disrupter instrument (Qbiogene, USA). The nirS gene fragments (890 bp) were amplified with the primers nirS-1F (5ʹ-CCTAYTGGCCGCCRCART-3ʹ) and nirS-6R (5ʹ-CGTTGAACTTRCCGGT-3ʹ) in a PTC-200™ Thermal Cycler (Bio-Rad, USA) [Citation17]. PCR was performed in a total volume of 25 μL containing 100 µM dNTP, 1.5 µM MgCl2, 1× Taq buffer, 1.5 U Taq DNA Polymerase, 2 µM primers (Sangon, China) and 1 μL of genomic DNA. PCR was performed in a thermal cycler under the following conditions: initial denaturation at 95°C for 5 min; 34 touchdown cycles of denaturation at 95°C for 30 s; annealing at 56°C from the first cycle (reduced from to 51°C in increments of 1°C per cycle) extension at 72°C for 1 min; an additional 25 cycles with a constant annealing temperature of 54°C; and a final extension at 72°C for 10 min. PCR products from three reactions were pooled to minimize PCR bias, gel-purified, ligated into pMD19-T simple vectors (Takara, Japan) and used to transform Escherichia coli TOP10 competent cells. Recombinants were selected using X-Gal-IPTG LB indicator plates with 100 μg/mL ampicillin, and a miniprep method was used for plasmid preparations. Cloned nirS fragments were tested by PCR using vector primers RV-M (5ʹ-GTAAAACGACGGCCAG-3ʹ) and M13-D (5ʹ-CAGGAAACAGCTATGAC-3ʹ). Amplified DNA was sent to HuaDa Genomics Corporation (Beijing, China) for sequencing. The sequences with more than 97% identity were grouped into one operational taxonomic unit (OTU) using DOTUR version 1.53 program. The assembled sequences were compared with those in BLAST, NCBI (http://www.ncbi.nlm.nih.gov/) and then translated by BIOEDIT to amino acid sequences. Sequence alignments were constructed by ClustalX. Phylogenetic trees were created by the distance matrices from the neighbor-joining method and were calculated after bootstrapping (1,000 replicate trees) in MEGA.
2.3 Statistical analyses
These diversity indices and richness estimators were simple statistical tools to compare the relative complexity of communities and to estimate the completeness of sampling. Indices of diversity (Shannon and Simpson) and abundance-based coverage estimator (SACE) and bias-corrected Chao1 were calculated by DOTUR. The percent coverage was calculated as follows: [1-(n/N)] × 100, where n is the number of unique clones and N is the total number of clones [Citation18]. The Mothur program was used to generate a rarefaction curve for the observed OTUs. Correlations between the nirS-encoding bacterial assemblages and environmental factors were analyzed with canonical correspondence analysis (CCA) using the software Canoco (version 4.5, Microcomputer Power, USA) [Citation19]. A single peak model in CCA analysis was more suitable than the linear model for our data according to the software user’s guide. These multivariate statistical methods are useful tools to decode the microbial community structure and distribution related to environment variables.
3. Results and discussion
3.1 Haizhou Bay environmental condition
The geochemical parameters of the three sediment samples were summarized in . Due to the circulating cooling water discharged by Tianwan Nuclear Power Plant, the station H3 has special environmental characteristics. The Higher water temperature and the lower levels of dissolved oxygen were observed. Station H2 is located near the east-west island, whose main pollutant is mainly from the discharge of domestic wastewater. DIN of H2 was 140.83 μmol/L, showing significantly higher than the other two stations. The ubiquities of volatile organic compounds and the high concentrations of N nutrients have the implication that the environmental conditions of sampling sites were obviously influenced by anthropogenic activities.
Table 1. Geochemical characteristics of the three Haizhou Bay sediment samples.
3.2 Diversity of the nirS sequences
A clone library of nirS gene sequences amplified from DNA extracted from the three sites was constructed. A total of 156 valid sequences were grouped into 76 OTUs based on 97% sequence similarity, which presented the substantial diversities of each library. The percent coverage values of the recovered nirS in the clone libraries ranged from 61.9% to 84.0% (). The dominant and common nirS encoding bacterial denitrifiers in the sedimentary environments of the Haizhou Bay were probably detected.
Table 2. Coverage and diversity indices of nirS sequences libraries of the three Haizhou Bay sediment samples.
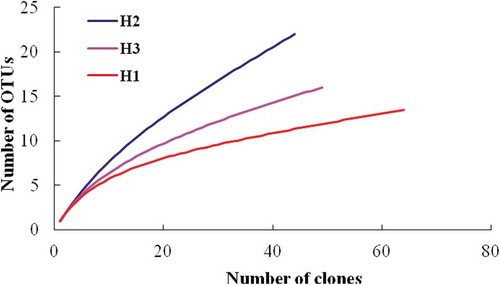
Rarefaction analysis as well as the diversity indices of Shannon and Simpson showed the highest diversity of denitrifying community in the nitrogen-rich sample H2 and the lowest diversity in sample H1 (). The richness estimators SACE and Chao1 showed a similar pattern, except for station H3 that showed lower nirS richness ().
Figure 2. Rarefaction curves for the sedimentary bacterial nirS OTUs of the three sampling stations of Haizhou Bay.
3.3 Phylogenies of the nirS sequences
Phylogenetic tree constructed with the MEGA neighbor-joining method of the nirS sequences translated from the nirS sequences collected from Haizhou Bay and other typical coastal habitats and isolates (). The unique nirS sequences recovered from the sediments of the Haizhou Bay shared 83–100% identities with their closest-matched GenBank sequences detected from a variety of environments, including sediments of Changjiang Estuary, Pearl River Estuary, Essex River Estuary, Jiaozhou Bay, Chesapeake Bay, East Lake, Hai River, as well as clones obtained from surface constructed wetland and mariculture sediments. About 85.5% of the Haizhou Bay nirS sequences had their closest matches originally retrieved from estuarine, bay and coastal sediments, however, some relatively special sequences from greenhouse soil, Arabian Sea oxygen minimum zone and activated sludge were found in the lower DO and Higher temperature site H3. Thiobacillus denitrificans and Pseudomonas stutzeri, as cultivated denitrification model microorganisms [Citation20,Citation21], were noted to be similar to the sequences of the Haizhou Bay.
Figure 3. Phylogenetic tree constructed with the neighbor-joining method of the nirS sequences derived from sediments in Haizhou Bay and cultured bacterial and other typical environmental clones. The scale bar represents the expected number of changes per homologous position. Bootstrap values greater than 70% of 100 resamplings are shown near the corresponding nodes. The station name in parentheses indicates distribution of nirS sequences and the number refers to no. of OTUs based on 3% sequence distance cutoff.
Most of the Haizhou Bay nirS sequences had their closest matches detected in Changjiang Estuary and Jiaozhou Bay. A lot of the same environmental conditions among the three zones, such as the eutrophication and declining oxygen concentration [Citation22,Citation23]. Moreover, sample H3 had closest-matched sequences detected from oxygen minimum zone and warmer activated sludge, which is consistent with special environmental characteristics. This shows that our result strongly supports the hypothesis of environmental control on the composition and distribution of microbial communities, especially the key functional bacteria groups. In comparable environments, similar denitrifying communities might develop [Citation24,Citation25].
3.4 CCA analysis
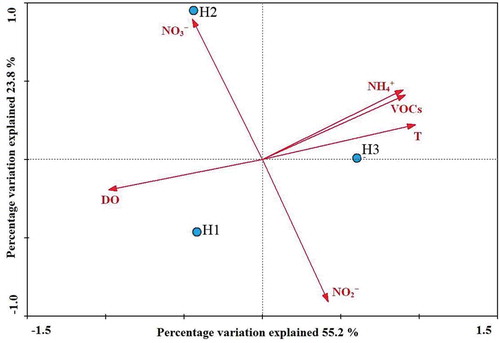
Spatial distribution of sediment nirS-encoding bacterial assemblages might be influenced by a variety of natural and anthropogenic factors, such as the geochemical background and eutrophication condition [Citation24,Citation26,Citation27]. Canonical correlation analysis is useful tools to decode the microbial community structure and distribution related to environment variables [Citation28]. CCA analysis of the nirS-encoding bacterial assemblages in response to environmental variables confirmed is shown in . There is a good negative correlation between water temperature and level of DO, instead, a positive correlation of NH4+ and VOCs. In the CCA of environmental factors and denitrifying communities, the samples H3 were found to be correlated with NH4+ and temperature, whereas those from samples H1 and H2 were correlated with dissolved oxygen and NO3−, respectively. CCA indicated that nitrogen nutrient and dissolved oxygen were the major contributing parameters for the diversity and spatial distribution of denitrifying bacteria of Haizhou Bay. We were able to determine the nirS-encoding bacterial community structure in relation to various environmental gradients.
Figure 4. CCA ordination plots for the first two principal dimensions of the relationship between nirS-type denitrifier communities with the environmental parameters. T, NH4+, NO3−, NO2−, VOCs and DO represent temperature, ammonium, nitrate, nitrite, volatile organic compounds and dissolved oxygen, respectively.
4. Conclusion
Denitrifying microorganisms play a key role in the global nitrogen cycle. Denitrification is one of the main processes of this cycle and trace gases originating from it cause climatic effects. Owing to most of the denitrifiers are difficult to cultivate, Nitrite reductase genes as functional markers to investigate the diversity of denitrifying bacteria. A gene-clone-library-based molecular approach was used to study the denitrifiers–environment relationship. Phylogenetic analysis indicated that similarity of the abundance and distribution of denitrifiers in similar environments in spite of geographical distance. Canonical correlation analysis showed that the nirS-type denitrifying bacteria communities had distinctive spatial heterogeneity along Haizhou Bay. In view of the serious eutrophication of Haizhou Bay increasing, nirS-type denitrifying bacteria may be applied to risk assessments of nitrogen nutrient contaminants in the bay ecosystems.
Acknowledgments
We wish to thank the anonymous reviews and editors for their valuable suggestions on revising and improving the work.
Disclosure statement
No potential conflict of interest was reported by the authors.
Additional information
Funding
References
- Howarth RW, Sharpley A, Walker D. Sources of nutrient pollution to coastal waters in the United States: implications for achieving coastal water quality goals. Estuaries. 2002;25:656–676.
- Seitzinger S, Harrison J, Bohlke J, et al. Denitrification across landscapes and waterscapes: a synthesis. Ecol Appl. 2006;16:2064–2090.
- Abell GCJ, Revill AT, Smith C, et al. Archaeal ammonia oxidizers and nirS-type denitrifiers dominate sediment nitrifying and denitrifying populations in a subtropical macrotidal estuary. ISME J. 2010;4:286–300.
- Guo L, Hu Z, Fang F, et al. Trophic status determines the nirS-denitrifier community in shallow freshwater lakes. Ann Microbiol. 2014;64:999–1006.
- Gongol C, Savage C. Spatial variation in rates of benthic denitrification and environmental controls in four New Zealand estuaries. Mar Ecol Prog Ser. 2016;556:59–77.
- Galloway JN, Townsend AR, Erisman JW, et al. Transformation of the nitrogen cycle: recent trends, questions, and potential solutions. Science. 2008;320:889–892.
- Gruber N, Galloway JN. An earth-system perspective of the global nitrogen cycle. Nature. 2008;451:293–296.
- Song B, Ward BB. Nitrite reductase genes in halobenzoate degrading denitrifying bacteria. FEMS Microbiol Ecol. 2003;43:349–357.
- Philippot L, Hallin S. Finding the missing link between diversity and activity using denitrifying bacteria as a model functional community. Curr Opin Microbiol. 2005;8:234–239.
- Wallenstein MD, Myrold DD, Firestone M, et al. Environmental controls on denitrifying communities and denitrification rates: insights from molecular methods. Ecol Appl. 2006;16:2143–2152.
- Tamegai H, Aoki R, Arakawa S, et al. Molecular analysis of the nitrogen cycle in deep-sea microorganisms from the Nankai Trough: genes for nitrification and denitrification from deep-sea environmental DNA. Extremophiles. 2007;11:269–275.
- Bothe H, Jost G, Schloter M, et al. Molecular analysis of ammonia oxidation and denitrification in natural environments. FEMS Microbiol Rev. 2000;24:673–690.
- Chen JH, Han TZ, Li XT. Occurrence and distribution of marine natural organic pollutants: lipophilic marine algal toxins in the Yellow Sea and the Bohai Sea, China. Sci Total Environ. 2018;612:931–939.
- Xu Y, Zhang Y, Zhang D. Retrieval of dissolved inorganic nitrogen from multi-temporal MODIS data in Haizhou Bay. Mar Geod. 2010;33:1–15.
- Dias CDO, Bonecker SLC. Long-term study of zooplankton in the estuarine system of Ribeira Bay, near a power plant (Rio de Janeiro, Brazil). Hydrobiologia. 2008;614:65–81.
- Yarushina MI, Guseva VP, Chebotina MY. Species composition and ecological characteristic of algae from the cooling reservoir of the Beloyarsk nuclear power plant. Russ J Ecol. 2003;34:20–26.
- Braker G, Fesefeldt A, Witzel KP. Development of PCR primer systems for amplification of nitrite reductase genes (nirK and nirS) to detect denitrifying bacteria in environmental samples. Appl Environ Microbiol. 1998;64:3769–3775.
- Singleton DR, Furlong MA, Rathbun SL, et al. Quantitative comparisons of 16S rRNA gene sequence libraries from environmental samples. Appl Environ Microbiol. 2001;67:4374–4376.
- Braak CJFT, Smilauer P. CANOCO reference manual and CanoDraw for windows user’s guide: software for canonical community ordination (version 4.5). Ithaca: Microcomputer Power; 2002.
- Claus GH, Kutzner J. Physiology and kinetics of autotrophic denitrification by Thiobacillus denitrificans. Appl Microbiol Biot. 1985;22:283–288.
- Lalucat J, Bennasar A, Bosch R, et al. Biology of Pseudomonas stutzeri. Microbiol Mol Biol R. 2006;70:510–547.
- Dang HY, Wang CY, Li TG, et al. Diversity and distribution of sediment nirS-encoding bacterial assemblages in response to environmental gradients in the eutrophied Jiaozhou Bay, China. Microb Ecol. 2009;58:161–169.
- Zheng YL, Hou LJ, Liu M, et al. Diversity, abundance, and distribution of nirS-harboring denitrifiers in intertidal sediments of the Yangtze estuary. Microb Ecol. 2015;70:30–40.
- Castro-González M, Braker G, Farias L, et al. Communities of nirS-type denitrifiers in the water column of the oxygen minimum zone in the eastern South Pacific. Environ Microbiol. 2005;7:1298–1306.
- Falk S, Hannig M, Gliesche C, et al. nirS-containing denitrifier communities in the water column and sediment of the Baltic Sea. Biogeosciences. 2007;4:255–268.
- Francis CA, O’Mullan GD, Cornwell JC, et al. Transitions in nirS-type denitrifier diversity, community composition, and biogeochemical activity along the Chesapeake Bay estuary. Front Microbiol. 2013;4:237.
- Dang H, Li J, Chen R, et al. Diversity, abundance, and spatial distribution of sediment ammonia-oxidizing Betaproteobacteria in response to environmental gradients and coastal eutrophication in Jiaozhou Bay, China. Appl Environ Microbiol. 2010;76:4691–4702.
- Li Y, Li F, Zhang X, et al. Vertical distribution of bacterial and archaeal communities along discrete layers of a deep-sea cold sediment sample at the East Pacific Rise (approximately 13 degrees N). Extremophiles. 2008;12:573–585.