
 ?Mathematical formulae have been encoded as MathML and are displayed in this HTML version using MathJax in order to improve their display. Uncheck the box to turn MathJax off. This feature requires Javascript. Click on a formula to zoom.
ABSTRACT
Precision farming based on soil total nitrogen status is crucial to informed fertilization strategies while enhancing environmental quality of agricultural ecosystems. Hyperspectral technology was applied for rapid assessment of soil total nitrogen content in a long-term fertilization experiment of wheat-corn rotation system. The first-order derivative of squared spectra and Soil Adjusted Spectral Index transformation provided the highest correlation with soil total nitrogen contents. Inversion modeling results involving multiple linear regression, back propagation neural network (BPNN), and partial least square regression indicated that BPNN provided the best performance with coefficient of determination (R2) reaching 0.8 and 0.9, respectively, for wheat and corn seasons. Model performance with wheat and corn season combined was poor due to seasonal difference in hyperspectral patterns and different decomposition of straws returned to the field. This study provided a quantitative tool for rapid and accurate diagnosis of soil total nitrogen content for precision agriculture.
1. Introduction
Nitrogen (N) is one of the most essential nutrients in soil, for supporting the productivity and functioning of agriculture ecosystems. Soil total N content (TN) is an important indicator of soil N supply capacity to sustain crop yield [Citation1–Citation3]. Rapid and accurate diagnosis of soil TN is of great significance for farmland management and efficient use of N fertilizer. Traditional measurements of soil TN rely on soil digestions such as the Kjeldahl method or instrumental analysis [Citation4]. While these methods offer high precision in measurements, they are costly, time consuming, and complicated in operations, thereby limiting their suitability for rapid analysis of large quantity of samples. The development of precision agriculture requires innovative technology for rapid assessment of soil TN status to achieve precise and accurate adjustment of various field management measures, optimize the highest yield and maximum economic benefits while reducing environmental risks [Citation5–Citation7].
The laboratory hyperspectral method is a non-destructive technique that requires only a few seconds to scan each sample [Citation1,Citation8]. The method identifies substances in soils and determines their chemical composition according to the reflection characteristics of the materials and the physical and chemical properties of the soil. Once a soil sample is scanned, the same spectra can be used for estimation of a variety of soil quality parameters such as soil organic matter, nitrogen, phosphorus, potassium, and soil water content. Its rapid and non-destructive nature also provides a research tool to elucidate mathematical means of analyzing the spectra data for rapid monitoring of soil TN content [Citation9]. Several authors have used statistical models to establish relationships between soil reflectance and soil TN content. Wu et al. optimized the prediction of soil TN using in the hyperspectral sensitive bands and inversion characteristics of a subtropical red soil through a stepwise multiple linear regression modeling procedure [Citation10]. Qiao et al. compared various pretreatment methods of reflection data and used partial least squares regression method to establish the prediction model of calcareous cinnamon soil [Citation11]. They identified the optimal wavelength of the inversion model as well as the optimal combination of soil nutrients and pretreatment methods. Guy Serbin et al. used hyperspectral remote sensing to diagnose soil nutrients under straw mulching and X-ray diffraction analysis technology to determine the influence of soil minerals on the spectrum [Citation12]. These authors did not find any effect of crop stubble on soil functional groups. However, Alabbas et al. found that several functional groups of organic compounds in soil such as hydroxyl and carboxyl groups responded to soil spectra [Citation13].
The current literature clearly shows that the quantitative relationships between soil spectra and soil nutrient properties are confined to specific regions and time in association with changes in cropping systems and regional hydrological conditions. Few studies have established hyperspectral analysis models for soil TN content under the long-term effects of controlled-release fertilizer applications for crop rotations. In this study, we selected experimental plots that have received the same fertilization treatments with controlled release N fertilizer for 10 years in the North China Intensive Agro-ecosystem Experimental Station (Shandong, China). The objectives of this study were to: (i) elucidate the relationships among TN content, organic functional groups, and hyperspectral patterns of soil in different harvest season under wheat and corn rotation; (2) compare and contrast the accuracy of three types of quantitative modeling procedures for prediction of soil TN using soil hyperspectral characteristics at wheat and corn harvests.
2. Materials and methods
2.1 The study area
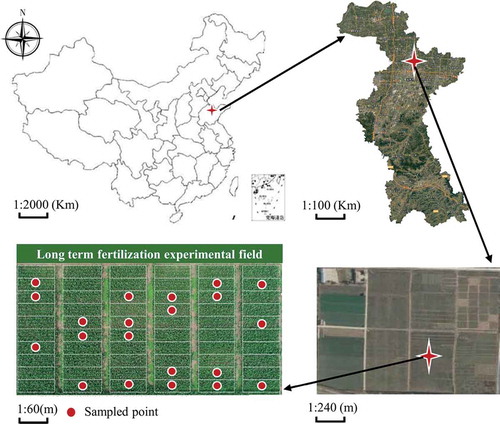
The North China Intensive Agro-ecosystem Experimental Station (117°21ʹ59”E, 36°57ʹ75”N) is located in Huantai County Shandong Province (). The soil belongs to the fluvo-aquic soil subgroup, a light lime moist embryonic soil in Chinese Soil Taxonomy (Carbonatic Ochri – Aquic Cambosols). Planting system is winter wheat-summer corn rotation. After wheat and corn harvest, straw is returned directly to the field by mechanized crushing every year with a depth of returning about 20 cm [Citation2]. Soil samples were collected at wheat maturity stage (June) and corn maturity stage (September) in 2014, 2015 and 2017, respectively. The diagonal five-point sampling method was employed. All soil samples were air-dried and passed through 0.25 mm sieve for further analysis.
Figure 1. Research area showing the experimental plots and soil sampling locations.
2.2 Hyperspectral measurements
The reflectance measurements were accomplished with the FieldSpec4 spectrometer produced by Analytical Spectral Devices Inc. The wavelength range was 350–2500 nm. The spectral sampling interval was 1.4 nm in 350–1000 nm wavelength with a spectral resolution of 3 nm. The spectral sampling interval was 1 nm in 1000–2500 nm wavelength with a spectral resolution of 2 nm. Total outputs were 2115. In order to avoid the interference of natural light, the measurement was conducted in the darkroom where all light sources were cut off. The height of halogen lamp was 70 cm and the angle was 15 degrees. Whiteboard calibration was performed after 20 min of preheating. Every time when the sample spectrum was collected, the white board calibration was carried out. The field of view angle of the probe was 25 degrees. The distance between optical head and sample or reference panel was 16 cm, and 10 spectral curves were obtained within the field of view angle range [Citation14]. Ten spectral curves of each sample were averaged and corrected splice. The spectral curve of each soil sample removes 350–399 nm and 2451–2500 nm wavelength with high noise. Soil TN content was determined with Vario Micro cube manufactured by Elemental Analyzer.
2.3 Data pre-processing and representative bands
Soil reflectivity data were pre-processed with operations involving reciprocal, square, square root, logarithm, first-order differential, first-order differential of reciprocal, first-order differential of square, and first-order differential of square root. Sensitive bands were identified by correlation analysis between soil TN content and processed spectral reflectance obtained at each incremental wavelength of 1 nm. The absolute values of Pearson correlation coefficient (r) were compared for identification of the most efficient pre-processing method.
In order to further improve the correlation, the spectral parameters were further transformed after selecting the best pre-processing method [Citation15]. Parameter transformation is suitable in areas where soil brightness varies greatly due to differences in moisture, roughness, shadows or organic matter. In this study, the Soil Adjusted Spectral Index (SASI) was chosen to transform the soil reflectance with Equation (1) [Citation16] such that
where R1 and R2 are consecutive bands in the sequential analysis. After transformation, the characteristic bands of the soil samples were screened based on the combined spectral reflectance absorption rules and collinearity diagnosis [Citation17,Citation18]. The bands with absolute r values larger than 0.55 were firstly selected. Collinearity diagnosis was further conducted in IBM SPSS Statistics 22 with selection criteria of tolerances >0.1 and the variance expansion factor <10.
2.4. Quantitative modeling procedures
Three modeling methods were used: Multiple Linear Regression model, Back Propagation Neural Network model, and Partial Least Squares Regression method. The independent variables were characteristic bands and the dependent variables were measured total nitrogen content.
Multiple Liner Regression (MLR), also known as inverse least squares method, uses the least squares method to estimate the coefficient matrix [Citation19]. A linear regression model of soil TN content and characteristic bands was constructed using multiple linear regression models. The pre-processed data were used as the independent variable, and the measured values were used as dependent variables to perform multiple linear regression analysis using IBM SPSS Statistics 22.
Back Propagation Neural Network (BPNN) is a distributed processing mathematical model that simulates the neural activity of human brain. The BPNN generally includes an input layer, a hidden layer and an output layer. The implicit layer transfer function, the number of nodes and the network, different settings of the training function strive to achieve the purpose of predictive optimization [Citation20]. The response values of the respective wavelengths are inputs at the input layer, and the estimated values of the concentrations to be measured are obtained by the nonlinear function in the hidden layer [Citation21]. In this study, MATLAB R2016 was used to build BPNN model. The nonlinear logsig function was used to train the data with a network learning rate of 0.05.
Partial Least-Square regression (PLS) is a comprehensive modeling method using principal component analysis, multiple linear regression analysis and least squares regression [Citation22]. It uses the extracted principal components to screen for variables with high contributions. PLS features with abilities to interpret multiple autocorrelation between multiple hyperspectral features and construct regression models using valid data [Citation23]
In this study, two principal components were extracted for subsequent least squares analysis. This analysis was conducted using IBM SPSS Statistics 22.
The samples were divided according to the growth seasons of different crops with twice inversions being carried out. Specifically, soil samples in the wheat maturation stage collected in June 2014 and June 2015 were used for model calibration and the soil samples in the wheat season of June 2017 were used for model validation. Similarly, soil samples in the corn maturation stage collected in September 2014 and September 2015 were used for model calibration and soil samples collected in September 2017 were used for model validation. For comparison purposes, the same procedures were applied for data with wheat and corn seasons combined for model calibration and validation.
The performance of the model was evaluated using the determination coefficient R2, root mean square error (RMSE), and relative percent deviation (RPD). Typically, large R2 and small RMSE indicate that the model has high estimation accuracy. In addition, values of RPD > 2 are indicative of ‘good’ model predictive ability while RPD < 1.4 suggest ‘poor’ model predictive ability [Citation24]. RPD values in between suggest that the model could be improved further by model optimization.
2.5 Infrared spectroscopy
Infrared spectroscopy is a method commonly used for identification and structural analysis of organic compounds in soil [Citation25]. These spectral patterns of double and combined frequencies of molecular vibration have been linked to organic compounds containing C-H, N-H, O-H groups [Citation26]. In this study, samples collected at the same location during wheat harvest and corn harvest were analyzed with Fourier transform infrared (FTIR) spectroscopy. The sample was ground into fine powder, and a small amount of sample was mixed with potassium bromide at the ratio of 1:100 and pressed into thin sheets. Since most of the basic absorption bands of organic compounds occur in the mid-infrared region, the absorption peaks ranging from 400 to 4000 cm−1 were selected.
3. Results
3.1 Soil total nitrogen
Soil TN contents are summarized in according to the modeling and validation procedure for each crop. For samples taken during wheat harvest, soil TN content averaged 1.27 g/kg (range: 0.94 to 1.49 g/kg) for the modeling data set, and 1.32 g/kg (range: 0.99 to 1.51 g/kg) for the validation data set. For samples taken during corn harvest, soil TN content averaged 1.23 g/kg (range: 0.93 to 1.49 g/kg) for the modeling data set, and 1.30 g/kg (range: 1.11 to 1.43 g/kg) for the validation data set.
Table 1. Total nitrogen content (g/kg) in soil samples.
Overall, soil TN contents in the wheat season were only slightly higher than in the corn season, possibly due to the difference in N demand, N fertilization, and soil management between the wheat and corn seasons [Citation17]. Meanwhile, compared to soil TN contents of modeling set with soil TN contents of verification set, the conclusion is drawn that the inter-annual difference was not significant ().
Table 2. T-test of total nitrogen content of the validation set and the modeling set.
3.2 Soil reflectance
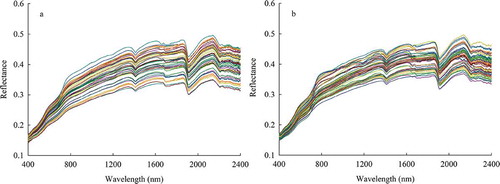
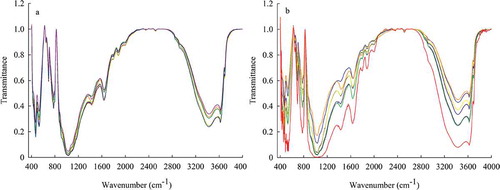
The general trend of soil spectral reflectance in the wavelength of 400–2400 nm was similar for wheat season and corn season is shown in with samples signed as different colors. Features of baseline translation and tilt between the spectra, which may be caused by scattering effects of different soil particles [Citation18], occurred at roughly the same bands of wavelength. However, variations among samples at a particular wavelength were generally larger for the wheat season than for the corn season. The average reflectance of all the samples was also larger for the wheat season than for the corn season.
Figure 2. Difference original reflectance of soil samples in wheat (a) and corn (b) seasons.
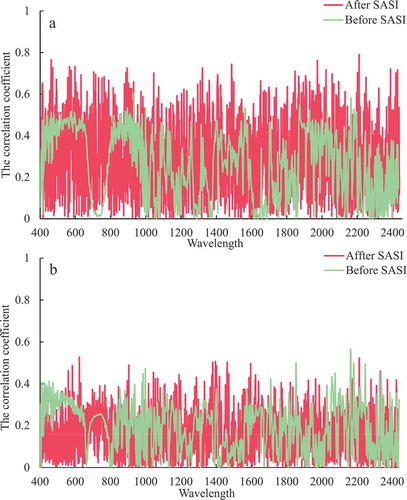
The pre-processing procedures performed on the spectral data reduced noise in the data to varying degrees. Among all the pre-processing methods used, the first-order differentiation after squaring had the best effect. The correlation coefficient reached the highest level in both wheat and corn seasons (). After the SASI transformation, the correlation coefficients for the wheat season and corn season were further improved (), affirming that this method was suitable for the transformation of hyperspectral data in this study. The characteristic wavelengths of soil samples for both wheat and corn seasons were further screened and selected. For the wheat season, the characteristic wavelengths were 602, 720, 775, 926, and 2215 nm. For the corn season, the characteristic wavelengths were 442, 553, 998, 1082, 1087, 1285, 1314, 1969, and 2377 nm. When the two data set were combined, the sensitive wavelengths were 926, 935, 1082, 1087, and 1491 nm. These wavelengths are consistent with those of other studies [Citation26,Citation27].
Figure 3. Correlation degree between soil reflectance and soil total nitrogen content after pretreatment of soil reflectance in wheat (a) and corn (b) seasons.
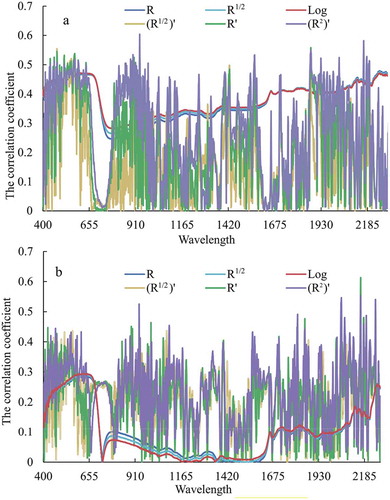
Figure 4. Comparison of correlation coefficients between wheat season (a) and corn (b) season soil reflectance before and after SASI calculation.
3.3 Modeling results
The modeling analysis results are summarized in with the goodness of fit visually displayed in for the wheat season and for the corn season. For the wheat season, BPNN provided the best model for both the modeling and validation data sets. For example, the R2 values of the modeling data sets were 0.73, 0.80, and 0.52, respectively, by MLR, BPNN and PLS. The corresponding RMSE were 0.0807, 0.0708, and 0.0815, respectively. The performance in the validation period was similar with RPD of 2.219 for BPNN, suggesting a good model predictability. Values of RPD were <2 for both MLR and PLS.
Figure 5. Measured vs. Predicted values of MLR, BPNN, PLSR modeling data (a), validation data (b) of wheat seasons.
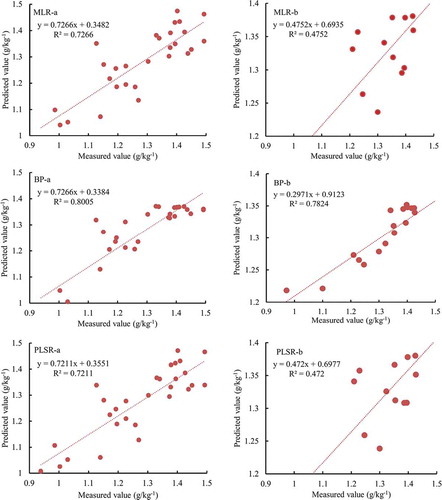
Figure 6. Measured vs. Predicted values of MLR, BPNN, PLSR modeling data (a), validation data (b) of corn seasons.
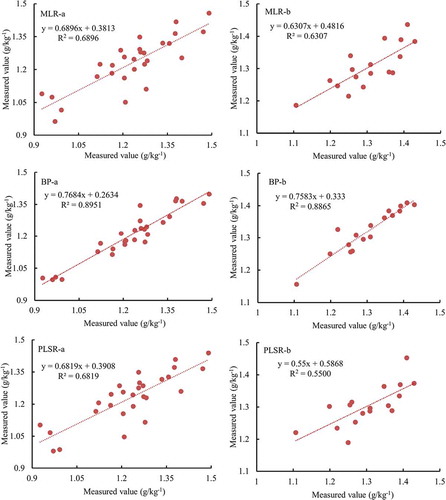
Table 3. Model analysis accuracy of different modeling methods for wheat-corn double cropping system.
For the corn season, model performance was similar to that for the wheat season with BPNN being the best. For example, for the modeling data set, the R2 values of MLR, BPNN, and PLS were 0.6900, 0.8951, 0.6819, respectively (). The corresponding RMSE were 0.084, 0.054, and 0.087, respectively. The validation performance was comparable though the RDP value for BPNN was only 1.93, possibly due to the lower number of validation data than for the wheat season. Nevertheless, the most suitable hyperspectral inversion model for both the wheat and corn seasons was obtained with BPNN.
For data combining wheat and corn seasons, the model performance was not as good as that for either wheat season or corn season in spite of a larger data set. While BPNN was still the best among the three quantitative procedures during the model calibration stage, its performance was slightly worse than MLR and PLS. The RDP values there all less than 1, indicating poor model predictability.
3.4 Infrared spectra
Infrared spectra of soil samples displayed similar trends between the wheat season and the corn season with obvious absorption peaks at 469, 777, 1030 and 3427 cm−1 while differences among samples were much less in the wheat season than in the corn season (). The absorption intensity of characteristic peaks was more dynamic in the corn season than in the wheat season, especially for the carbonyl absorption peaks (1900–1650 cm−1). The absorption peaks below 900 cm−1 are overlapped peaks of protein NH and carbohydrate sugar ring vibration [Citation28]. Absorption peaks around 1031 and 3426 cm−1 are more prominent. The peaks of 1050 − 1000 cm−1 are mainly carbohydrate absorption bands. The absorption peaks of 1031 cm−1 represent Si-O stretching vibration in silicate minerals and C-O stretching vibration in carbohydrate and polysaccharide structures [Citation29]. The absorption peaks at 3426 cm−1 manifest the existence of hydroxyl groups in soil clay. These groups are linked with hydrogen bonds, representing stretching vibration of -OH forming hydrogen bond and the absorption of N-H stretching vibration in amino acids, cellulose, hemicellulose, starch and monosaccharide [Citation30,Citation31].
Figure 7. Infrared spectrum of corn (a) and wheat (b) seasons soil.
4 Discussion
4.1 Model comparison
The excellent model performance exhibited by BPNN suggests that the relationship between soil TN and spectral wavelengths was non-linear in this study. The essence of multivariate linear regression is to estimate the coefficient matrix by least square method while the partial least square method incorporates the principal component analysis into least square regression [Citation32]. Both methods suffer from their inherent inability to handle nonlinear relationships in a data set. The limited number of input data in this study does not benefit much from the PLS’ advantage of reduced data dimension and redundancy [Citation33].
With BPNN, proper selection of input data is perhaps one of the most crucial steps for modeling success. Typically, a larger number of input neurons provide better model performance at the cost of a more cumbersome BPNN. The larger R2 and smaller RMSE () of the corn season than the wheat season during the model calibration stage was partly associated with more sensitive wavelength bands for the corn season than for wheat season (9 vs. 5). Our BPNN accuracy was comparable to that of Camacho-Tamayo et al. [Citation34], though our number of samples was much less. BPNN often achieves better results with a large number of data separately for model training and testing [Citation35].
4.2 Soil characteristics
The long-term fixed fertilization scheme did not lead to significant inter-annual and seasonal variations in soil total nitrogen content. However, soil reflectance spectral patterns were different between wheat season and corn season. The spectral curves of winter wheat crop showed an increasing trend in visible and near-infrared bands, consistent with the results of Lou’s study [Citation25]. The difference of soil spectral reflectance between summer corn and winter wheat in the same year may be partly caused by straw returned to the field. With 236 days of growth period for wheat, it is expected that continuous decomposition of straw likely released water soluble substances and crude protein. This explains why carboxyl content increased and the fatty property was weakened in soil with corn straw. The remaining substances were mainly tannin and lignin, which are stable in structure and difficult to decompose. In contrast, at the time of corn harvest, wheat straw had matured for about 90 days, and the decomposition rate of straw reached 48.88–59.95% [Citation36]. The content of carbohydrate and sugar gradually decreased, and the soluble organic matter such as amino acid and organic acid was decomposed. Compared with corn straw, wheat straw contained relatively more cellulose and lignin which were difficult to decompose, thus affecting the physical and chemical properties of soil during the corn harvest season. This may be responsible for the different patterns at 1969 and 2377 and 2215 nm bands in this study. Some workers pointed out that the reflectivity near 1710, 2100 and 2350 nm is closely related to the concentration of hemicellulose, cellulose and lignin [Citation37]. Lydia Serrano showed that the abundant lignin and cellulose in crop stubble resulted in obvious absorption characteristics of 2100–2300 nm [Citation38].
Another factor attributing the difference in hyperspectral patterns between wheat and corn season is timing in the year. Corn is planted typically in October while local rainfall occurs mainly from June to September (75% of the annual rainfall) [Citation3]. The abundant soil moisture was more conducive to the decomposition of wheat stubble and straw, so the soil color and soil reflectance in September were different from that in June. The overall distinction in seasonal soil management and hydrological pattern explained the different soil hyperspectral patterns between wheat and corn season, which in turn, provided the basis for modeling with seasonal data than with annual data ().
5. Conclusions
A quantitative tool for rapid assessment of soil total nitrogen content has now been successfully developed using characteristic hyperspectral wavelengths identified through first-order differential of squared spectra and Soil Adjusted Spectral Index (SASI) transformation, respectively, in a wheat-corn rotation system. The back propagation neural network has clear advantage over multiple linear regression and partial least square regression for its ability to fit data with non-linear relationships. The preferred number of characteristic wavelengths ranges from 5 to 9 as demonstrated in this study. While the long-term fixed fertilization scheme did not lead to significant difference in inter-annual and seasonal variations in soil total nitrogen, differences in functional groups of soil organic matter, decomposition of returned straws, and seasonal soil hydrological regimes between the wheat season and corn season resulted in different soil spectra patterns. This warranted the development of prediction models separately at the harvest of wheat and corn. These models have practical implications in providing timely fertilization recommendations in a context of precision agriculture.
Acknowledgments
The present study was supported by the National Key Research and Development Program of China (Grant # 2017YFD0200706, 2017YFD0200701), the Key Research and Development Program of Shandong Province (Grant # 2019GNC106011), the National Natural Science Foundation of China (Grant # 41977019, 41907067), the Graduate Education Teaching Reform Research Project of Shandong Agricultural University (Grant # YZD2018002). We thank undergraduates Zhenzhen Zhang, Tao Tan and Changyu Man for sample handling and analysis.
Disclosure statement
No potential conflict of interest was reported by the authors.
Related Research Data
References
- Stephan G, Daniel V, Darlene Z, et al. Hyperspectral analysis of soil nitrogen, carbon, carbonate, and organic matter using regression trees[J]. Sensors. 2012;12(8):10639–10658.
- Zheng W, Zhang M, Liu Z, et al. Combining controlled-release urea and normal urea to improve the nitrogen use efficiency and yield under wheat-maize double cropping system[J]. Field Crops Res. 2016;197(13):52–62.
- Zheng W, Liu Z, Zhang M, et al. Improving crop yields, nitrogen use efficiencies, and profits by using mixtures of coated controlled-released and uncoated urea in a wheat-maize system[J]. Field Crops Res. 2017;205(6):106–115.
- Bao S. Analysis of soil agrochemistry [M]. Beijing: China agricultural press; 2000. p. 42–54.
- Bai Y, Jin J, Yang L, et al. Technology of low altitude remote sensing and its applications in precision agriculture [J]. Soil Fert. 2004;(01):3–5.
- Yang L. Present situation and development trend of remote sensing technology in precision agriculture [J]. Agric Technol. 2019;39(16):21–22.
- Wang H, Liu F, Yunger John A, et al. A fitting model of hyperspectral characteristics of soil total nitrogen content with different particle size treatments[J]. Trans Chin Soc Agric Mach. 2019;50(02):195–204.
- Vigneau N, Rabatel G, Rabatel G, et al. Potential of field hyperspectral imaging as a non destructive method to assess leaf nitrogen content in Wheat[J]. Field Crops Res. 2011;122(102):25–31.
- Yang H, Kuang B, A M Q M, et al. Quantitative analysis of soil nitrogen and carbon at a farm scale using visible and near infrared spectroscopy coupled with wavelength reduction[J]. Eur J Soil Sci. 2012;63(3):27–34.
- Mingzhu W, Xiaomei L, Sha J, et al. Spectral inversion models for prediction of red soil total nitrogen content in subtropical region (Fu zhou) [J]. Specftroscopy Spectral Anal. 2013;33(11):3111–3115.
- Qiao X, Wang C, Feng M, et al. Hyperspectral estimation of soil organic matter based on different spectral preprocessing techniques[J]. Spectrosc Lett. 2017;50(3):156–163.
- Serbin G, Daughtry CST, Raymond Hunt Jr E, et al. Effects of soil composition and mineralogy on remote sensing of crop residue cover[J]. Remote Sens Environ. 2009;113(1):224–238.
- A H A-A, P H S, Baumgardner MF. Relating organic matter and clay content to the multispectral radiance of soils[J]. Soil Sci. 1972;114(6):477–485.
- Iman T, Xu Z, Boyd S, et al. Laboratory-based hyperspectral image analysis for predicting soil carbon, nitrogen and their isotopic compositions[J]. Geoderma. 2018;330:254–263.
- Bi YM, Yuan KL, Xiao WQ, et al. A local pre-processing method for near-infrared spectra, combined with spectral segmentation and standard normal variate transformation[J]. Analytica Chimica Acta. 2016;909:30–40.
- Huete AR. A soil-adjusted vegetation index (SAVI)[J]. Remote Sens Environ. 1988;25(3):295–309.
- C M M, R P Z, Robertson JA. An analysis of soil organic matter dynamics in relation to management, erosion and yield of wheat in long-term crop rotation plots[J]. Can J Soil Sci. 1997;77(4):553–563.
- Jia S, Hongyang L, Wang Y, et al. Hyperspectral imaging analysis for the classification of soil types and the determination of soil total nitrogen[J]. Sensors. 2017;17(10):2252.
- Broadhurst D, Goodacre R, Jones A, et al. Genetic algorithms as a method for variable selection in multiple linear regression and partial least squares regression, with applications to pyrolysis mass spectrometry[J]. Anal Chim Acta. 1997;348(1–3):71–86.
- Luan F, Zhang X, Xiong H, et al. Comparative analysis of soil organic matter content based on different hyperspectral inversion models[J]. Spectrosc Spectral Anal. 2013;33(1):196.
- Liu C, Fang Z, Chen Z, et al. Nitrogen nutrition diagnosis of winter wheat based on ASD Field Spec3[J]. Trans Chin Soc Agric Eng. 2018;34(19):162–169.
- Udelhoven T, Emmerling C, Jarmer T, et al. Quantitative analysis of soil chemical properties with diffuse reflectance spectrometry and partial least-square regression: A feasibility study[J]. Plant Soil. 2003;251(2):319–329.
- Zheng D, Jeong YS, Myong K, et al. Multidimensional local spatial autocorrelation measure for[J]. Appl Intell. 2012;36(3):542–552.
- Yang XS, Wang LL, Zhou XR, et al. Determination of protein, fat, starch, and amino acids in foxtail millet [Setaria italica (L.) Beauv.] by Fourier transform near-infrared reflectance spectroscopy [J]. Food Science and Biotechnology. 2013;22(6):1495–1500.
- Jin YH, Xiong HG, Fang Z. Comparative study of canopy spectral reflectance characteristics of spring wheat in irrigated land and dry land[J]. Remote Sensing for Land & Resources. 2014;26(3):24–30.
- Yanli L, Bai Y, Wang L, et al. Determination for total nitrogen content in black soil using hyperspectral data. Trans CSAE. 2010;26(1):256-261.
- Yan L, Wang R, Guan Y, et al. Prediction analysis of soil total nitrogen content based on hyperspectral[J]. Remote Sens Technol Appl. 2017;32(01):173–179.
- Shao X, Ning Y, Liu F, et al. Application of near infrared spectroscopy in the analysis of inorganic trace components [J]. J Chem. 2012;70(20):2109–2114.
- Yang H, Irudayaraj J, Paradkar MM, et al. Discriminant analysis of edible oils and fats by FTIR, FT-NIR and FT-Raman spectroscopy[J]. Food Chem. 2005;93(1):25–32.
- Jiabo L. Research carbon, nutrient elements and FTIR characteristics of lateritic red soil of guangxi natural forest ecosystem[D]; 2017:48–50. Guangxi: Guangxi University.
- M V C, J D R, A R F, et al. The decomposition of straw in soil: use of multiple internal reflectance infrared spectroscopy[J]. Eur J Soil Sci. 1993;44(4):693–702.
- J D R, A R F, A H G, et al. Rumen digestion of untreated and alkali-treated cereal straws: a study by multiple internal reflectance infrared spectroscopy[J]. J Sci Food Agric. 2010;45(2):95–107.
- Gomez C, Lagacherie P, Coulouma G, et al. Continuum removal versus PLSR method for clay and calcium carbonate content estimation from laboratory and airborne hyperspectral measurements[J]. Geoderma. 2008;148(2):141–148.
- Tamayo C, Jesús H, Rubiano SY, et al. Near-infrared (NIR) diffuse reflectance spectroscopy for the prediction of carbon and nitrogen in an Oxisol[J]. Agron Colomb. 2014;32(1):86–94.
- Sun B, Chen W. Classification of sEMG signals using integrated neural network with small sized training data [J]. Biomed Eng Appl Basis Commun. 2012;24(04):365–376.
- Wu J, Guo XS, Wang YQ, et al. Decomposition characteristics of rapeseed and wheat straws under different rice cultivations and straw mulching models[J]. Scientia Agricultura Sinica. 2011;44(16):3351–3360.
- Xiaoli L, Sun C, Zhou B, et al. Determination of hemicellulose, cellulose and lignin in moso bamboo by near infrared spectroscopy[J]. Sci Rep. 2015;5:17210.
- Serrano L, S L U,Ustin SL, et al. Remote sensing of nitrogen and lignin in Mediterranean vegetation from AVIRIS data: decomposing biochemical from structural signals[J]. Remote Sens Environ. 2002;81(2–3):355–364.