
ABSTRACT
Fluoride content of drinking water sources in 12 communities in North-Eastern states, Nigeria, was investigation. The fluoride concentration analyses were performed using the SPADNS method according to the standard method for examining water and wastewater. Fluoride concentration was in the range of 0.35–3.46 mg/L in the drinking water sources. Notably, communities with high fluoride content above the World Health Organization (WHO) guideline were observed in Tumu-2 (2.88 mg/L), Lapan (3.46 mg/L), Jalingo (1.79 mg/L), and Kaleh (1.60 mg/L), respectively. The physical survey conducted indicates severe affliction of fluorosis in Lapan communities; (38% dental fluorosis, 27% skeletal fluorosis, 22% dental and skeletal, 13% without fluorosis), thus, demanding to be urgently redressed. Different water de-fluoridation processes, technologies selection, limitations, and strengths that could serve as treatment purposes in diverse conditions were proposed and highlighted to aid relevant authorities in the future implementation of mitigation measures.
1. Introduction
Contaminated sources of drinking water consumed by people globally amounted to around 1.8 billion [Citation1]. In Nigeria, there is sufficient surface, and groundwater supply, only a few states in the North-Eastern region of the country witnessed water scarcity due to temporal and spatial distribution [Citation2]. Globally 50% of groundwater sources are used as portable drinking water; this had posed some health dangers because of some anthropogenic and naturally occurring trace elements [Citation3]. Al-Sulaiman et al. [Citation4] reported that arsenic and fluoride are the most significant inorganic pollutants in groundwater, affecting human health globally. Fluoride is naturally occurring among geochemical sediments, natural water systems, and minerals often passed onto the body chain through drinking water [Citation5–9].
Alexander et al. [Citation10] conducted an extensive study on trace elements in groundwater sources within southern Nigeria and reported that most trace element concentrations complied with the WHO minimum concentration standard. However, the report might be typically applied to the country’s southern region, while the situation is different in Nigeria’s Northern parts. Most notably, the North-Eastern regions’ groundwater sources are highly impacted with high fluoride and arsenic contents. Anthropogenic pathways could be through various manufacturing processes such as glass and ceramic production plants, coal power plants, electroplating, uranium refinement units, fertilizer manufacturing plants, rubber, and others [Citation11]. These had contributed to the environmental degradation of water sources due to fluoride pollution [Citation12]. Artificial groundwater extraction can alter the original water level and then induces leakage of high fluoride water into the water supply aquifer [Citation13,Citation14]. This is also an anthropogenic way that induced high fluoride concentration in drinking water sources. The natural fluoride occurrences are primarily via rocks rich in fluoride; the fluoride concentrations during water-rock interactions are directly uniform to the crystalline minerals’ dissolution [Citation15,Citation16].
WHO’s prime fluoride concentrations in drinking water safe for consumption are between the 0.5 and 1.0 mg/L acceptable limits [Citation17]. While in Nigeria, according to Nigerian Standards for Drinking Water Quality [Citation18], the optimal permissible fluoride concentration in drinking water is 1.5 mg/L. Health effects from high fluoride contents in drinking water can result in skeletal and dental fluorosis, bone deformation, while a higher concentration above 10 mg/L causes cancer. Based on the fluoride quantity in drinking water sources, de-fluoridation can be applied if the fluoride contents are high. At the same time, fluoridation can be introduced into the water source to increase fluoride contents, viz-viz the situation in context. Lower amounts of 1.0 mg/L consumed water are generally well-thought-out to be good with a beneficial effect on the rate of dental carriers occurrence, most especially among children [Citation19]. However, due to fluoride’s high negative impact on drinking water sources in Nigeria’s Northern region, it is crucial to de-fluoridate the water.
In recent years, various research was conducted to establish the route and removal of fluoride in drinking water sources; the method mostly adopted includes the sorption, chemical, membrane, and ion-exchange techniques [Citation20]. Sachin et al [Citation16]. reported fluoride and arsenic in the contaminated groundwater; current technologies reviews for contaminants removal, the study categorized the technologies into three distinct groups. Further investigation has been dedicated to developing the latest natural materials with cost-effectiveness for the fluoride removal in water by employing bone char, red clay, citreous lemon leaf [Citation21–23].
There had been several studies on the high concentration of fluoride levels in some parts of Nigeria’s South West and North Central geopolitical zones and the South-South geopolitical lowlands zone (altitude <100 m) [Citation24]. However, an in-depth investigation of selected communities afflicted with severe fluorosis within the North-Eastern part of Gombe state is still short of investigation. Based on the limitation and the necessity to focus on mitigation of high fluoride in water resources planning and its environmental consequences. The study aimed to measure drinking water sources with high fluoride concentration; identify the source of pollution/contamination; understand fluoride prevalence among different age groups within a particular community, and establish a water quality data bank fluoride-affected region for future planning purposes.
2. Methodology
2.1. Site specifications and sampling
The assessment was conducted in Gombe state () and within five Local Government Areas (L.G.A). Gombe state is located in the North-Eastern part of Nigeria. The state is among one of the country’s 36 states and shares conjoint borders with Yobe, Borno, Adamawa, Bauchi, and Taraba. The state covered an area of 20,265 km3 with almost 2,353,000 people in the population. It is characterized by a tropical climate with two distinct seasons; a rainy season (May-October) and a dry/harmattan season (November-April). Based on the vegetation classification of Nigeria, the study area falls into the Sudan savanna climate. The monthly mean temperature records range from 18 °C to 39 °C, with an annual rainfall of 954 mm [Citation25].
Figure 1. Showing map of Nigeria and the potential geological sources of fluoride sampling points in Gombe state
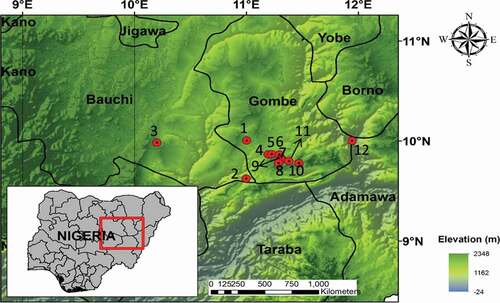
In the Gombe State of Nigeria, water storage formations and their hydrogeological sequence indicate that hydrogeology is consisting of crystalline and sedimentary rocks. Crystalline environments comprised of 3 to 4 zones, decompose (mostly topsoil), weathered, fractured, and fresh crystalline zones with water typically found within weathered and fractured zones [Citation26]. The sedimentary environments contain several rock formations with different water content dependent on soil type and root of recharge. The fractured crystalline rocks are often seen in boreholes and hand-dug wells at various depths in Gombe state [Citation27].
2.2. Water sample collection
The assessment areas include Five Local Government Areas and twelve communities within Gombe state, as shown in . Water samples were collected from different underground water sources within twelve communities. Groundwater is the primary source of the communities’ drinking water sources; hence, the water samples are collected through hand pumps or tube wells. From each sampling location, 3 water samples were collected, totaling 36 samples for all the communities. The positions of all sample locations were recorded with GPS, while the grab method of sampling collection was used. Water sampling bottles were held at the bottom for water collection to evade sample contamination. The water was allowed to run out freely for about 5–6 min to maintain an ambient temperature. The sampling bottles used for the collection of the water were one-liter capacity sterilized polyethylene and pre-cleaned bottles. During sample collection, handling, and preservation, standard procedures recommended by Standard Examination Methods for Drinking Water were followed to ensure data quality and consistency.
2.3. Physical survey
Physical observations were made on 100 children by random sampling between 0–25 years in the communities, as shown in . These selected age ranges are all-inclusive with all fluorosis effects and with an established distinct dentition. Children who were born and nurtured in the same communities participated in the study. Prior to proceeding to the survey, the survey’s purpose was systematically presented to the children’s parents/guidance, and appropriate consent was sought to conduct the study.
Table 1. Fluoride contents and organoleptic parameters in drinking water samples of the study areas
Table 2. Physical random sampling of 100 young children at Lapan communities
2.4. Analytical method
Water samples were analyzed for fluoride concentration within 24 h after collection in the laboratory using an iCE™ 3300 atomic absorption spectrometer (AAS). Two cubic cells in size 10 mm were utilized; deionized water was contained in one, while the sample solution was in the other cubic cell. Subsequently, the SPADNS solution (2 mL) was added to each cell with continuous stirring for 60 min. Each cell was read with the spectrophotometer at a wavelength of 580 nm and measured using a spectrophotometer (DR/5000, USA) according to the method previously described [Citation28]. Finally, data analysis was conducted with excel software, which has been previously applied for the fluoride concentration analysis of data and then compared with the standard of the WHO guidelines [Citation29].
The pH 7.0, Conductivity, TDS (Total Dissolved Solids), and color were also previously determined on-site. The physical/organoleptic parameters are considered on-site to ensure stability and consistency, while chemical parameters were conducted in the laboratory. However, for this study, a reference would only be referred to the organoleptic parameters and fluoride contents in the water sources; characteristics of the sampling parameters and analytical method used are as stated below and analyzed according to the Analytical Methods for Environmental Water Quality [Citation30]. The sampling water temperature, pH, and conductivity measurement was performed on-site using a calibrated conductivity/temperature metre °C/°F made by DIST Hanna, UK. The organoleptic method’s visual process was conducted for watercolors in the field, mainly considering the water appearance.
3. Results and discussion
3.1. Water sample collection
shows the analyzed fluoride and organoleptic concentrations in the drinking water within the five L.G.A of the twelve communities of Gombe state. The laboratory sample analysis was conducted to assess fluoride’s health risk among numerous age ranges. In the Lapan communities of Shongom L.G.A, a severe concentration level of fluoride (3.46 mg/L) was observed. Other impacted communities with fluoride above the recommended WHO standard are the Tumu-2 and Kalmai-2 with respective fluoride levels of 2.88 and 0.35 mg/L (). Dependent on the daily ingested concentration dose of fluoride in drinking water, it can be either harmful to human health or beneficial [Citation31]. Meanwhile, high fluoride concentration in the drinking water may not be the only reason for the endemic fluorosis as this might reflect more of correlation and no casualty. Further interpretation on casualty via different sources of fluoride intake is encouraged to be investigated. A mixture of drinking water with a low fluoride concentration (0.30 mg/L) with that of higher fluoride concentration levels (1.94 mg/L) can pave the way as a solution to obtain moderately fluoridated water [Citation20]. The water sample analysis from these four communities (Kalmai-2, Tumu-2, and Lapan) indicates non-compliance with the Kaleh drinking water regulation for 1.5 mg/L fluoride concentrations. In such communities, virtually with no evidence of industrial activities and discharges; the fluoride contamination can be principally due to hard rock aquifers [Citation20,Citation32]. On this quantitative assertion, drinking water with high fluoride content was collected from underground water sources for investigation. The fluoride severity prompted further surveillance to ascertain the fluorosis percent prevalence rate among the communities’ different age groups ( and ).
Fluorine is an element with electronegativity; it has a strong affinity to get attracted to calcium, a positively charged ion. Therefore, in humans’ developmental period, teeth and bone tissues possessed vast amounts of calcium to attract a high amount of fluoride, resulting in deposits such as calcium–fluorapatite crystals [Citation33]. Irrespective of this phenomenon, fluoride essential for healthy teeth cannot be underestimated since endorsements for fluoride levels were made for stimulating more nutritional well-being [Citation34]. High exposure to fluoride drinking water or deficiency might lead to serious health fluoride complications. Low fluoride could lead to tooth decay [Citation17], while exposure on an extended period with high fluoride concentrations could cause harmful effects on human health and skeletal fluorosis [Citation35].
3.2. Physical Investigation
The selected areas for assessment in the Local Government Areas were considered a case study because their primary drinking water sources are groundwater and obvious personal physical deformations. These deformations include; discoloration of the teeth and bone deformation mainly found among young children between the ages of 2–6.
Figure 2. The different fluoride prevalence rate among physically impacted people of Lapan communities
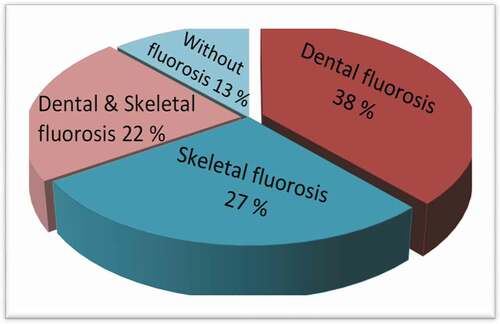
critical observations indicate significant differences in the age group with peculiar high fluoride impact, mostly on children. Summarily, 17–20 yrs were affected by dental fluorosis. In contrast, 0–4 year’s fluorosis also has an increased risk of both skeletal and dental fluorosis, and finally, children from the age of 13–16 years witnessed no defects. Dental fluorosis (38%) is more distinct within the Lapan communities () and characterized in the tooth by white, opaque areas. Arif et al. [Citation36] reported that a study conducted in some communities of Iran revealed the prevalence of dental fluorosis was a result of fluoride in drinking water sources >1 mg/dL concentration. The highest fluoride exposure for different Poldasht city-regions was observed in young consumers, children, and teenager groups [Citation37]; these findings were similar to the report obtained from this study.
Dental fluorosis can be further described as yellowish-brown to black tints with severe pitting of the teeth [Citation38]. The severity of this discoloration is dependent on the quantity of exposure to fluoride in the age range of 15–18 years. This effect can sometimes be concealed in adults, though not indicating the adult fluoride consumption complies with the safety limit. The dental fluorosis impact may not be evident if the teeth are entirely developed earlier to overexposure to the fluoride. Hence, an adult’s circumstances that displayed no signs of dental fluorosis do not necessitate that their fluoride consumption is within the recommended safety limit. A dental fluorosis prevalence of 12–33% has been reported with drinking water concentrations of 0.9–1.2 mg/L, while higher fluoride concentrations might cause anemia in pregnancy and other health complications [Citation39].
The effects and the manifestation of skeletal fluorosis in both adults and children are (27%); the rate precedes the skeletal and dental fluorosis combined on the communities. Its effects are more pronounced within the knee, shoulder bones, and the neck, causing difficulties to walk, with symptoms similar to arthritis or spondylitis [Citation33]. Adequate health care measures should be sought for skeletal fluorosis patients to prevent fusing of the vertebrate that can eventually lead to crippling, in addition to a severe nervous disorder. Impact and exposure to heavy metals [Citation40], and excessive fluoride have been previously reported to accompany several health disorders in adults and children; teeth mottling and bone deformation [Citation41]. Alteration in the digestive system’s functional enzymes, liver, excretory system, central nervous system, reproductive, respiratory system, and the kidney [Citation33] and several other high fluoride intake associated problems [Citation42], has been reported. shows the different fluoride health effects previously reported [Citation33,Citation43,Citation44]. Anses-French Agency for Food [Citation45] reported no foreseen harmful effect in daily fluoride concentration consumption lower than the safety limit of 0.5 mg/L or equal to the same amount.
Table 3. Different fluoride human health effects [Citation33,Citation43,Citation44]
4. Fluoride mitigation and De-fluoridation treatment process
The study identified variation in fluoride concentration and the prevalence of fluorosis impact in the different communities. Therefore, mitigation measures such as providing alternative water sources, nutritional value, and health value improvement are considered an essential approach to fluoride minimization. Further, a large-scale approach is adapting low-cost treatment techniques for the community water supply system. Each of these approaches is also discussed in the subsequent subsection.
4.1. Improve nutritional health value
The deficiency of dietary values with vitamins, calcium, and phosphorous can impact tooth formation because these are crucial nutrients for tooth development. The risk of dental fluorosis is reduced with appropriate calcium consumption [Citation46]. Calcium participants in fluoride metabolism are phosphorous, calcium, and vitamins are considered crucial nutrients in the tooth [Citation47,Citation48]. The essential linkage between fluorosis and malnutrition identification is likely associated with the high consumption of fluoride. A study previously conducted in Karnataka reported a high frequency of malnourishment and fluorosis and a connection between these two conditions [Citation49]. Communities identified with fluorosis and malnutrition can be supported with fluoridated salts to improve the fluoride concentration level in their drinking water. Simultaneously, such action should not be implemented in high water fluoride communities above 1.50 mg/L.
4.2. Supplemental water sources
Profoundly impacted fluorosis communities, such as Lapan’s drinking water source, are mainly from the well and few tap water. Boiling of low fluoridated water might increase the fluoride concentration to about 50% during the evaporation process [Citation50]. Alternative water sources with moderate fluoride are rainwater, surface water, and low-fluoride groundwater [Citation33]. The number of different water elements might affect the severity of fluorosis within the community’s drinking water sources. In such a situation, supplementary water sources such as surface water that can be heavily polluted with chemical and biological contaminants should not be directly utilized for drinking without adequate disinfection and treatment. The rainwater can be considered a much suitable cleaner source alternative with more accessible, low-cost remediation. Proper storage and distribution facilities within fluorosis afflicted communities should be implemented to alleviate limited water sources’ in the household and communities.
The distributions of fluoride in groundwater sources are unevenly dispersed and varied with time, and need serious monitoring; this attributes to supplemental water sources shortcomings [Citation33]. Therefore, hydrogeology assessment and different diseases associated with numerous ions (Arsenic, Lead, Sulphur, Chromium, Mercury, Cadmium, Radium, and Lithium) of the drinking water sources is significant when considering its association with the health situations of afflicted communities [Citation46]. In this study, the individual impact of different water source elements associated with the fluorosis severity was not conducted, hence challenging to comprehend such effect correlation. The documentation of high-risk impacted environmental areas will facilitate implementing appropriate remediation schemes to diminish the inhabitants’ harmful effects.
4.3. De-fluoridation water techniques
Since the intake of a higher concentration of fluoride drinking water caused several fluorosis effects, several de-fluoridation water treatment techniques have been proposed and implemented, most notably in communities lacking alternate drinking water sources. Most of these techniques are designed on the membrane process principles, ion exchange, adsorption, electrodialysis, coagulation, or precipitation, among several others [Citation51]. Consideration on the choice of appropriate treatment techniques is dependent on various factors such as the fluoride ion levels in the water, associated numerous chemical ions in the water sources, affordability, sustainability, and economic feasibility of the process. These techniques have their respective shortcomings and advantages; therefore, they will need to consider environmentally friendly and affordable alternatives for the impacted communities. Based on an extensive literature survey, some of these techniques, strengths, and limitations are further summarized in .
Table 4. The strengths and limitations of de-fluoridation water process
In developing countries, adsorption is commonly singly used, while in the industrialized nations, combined adsorption process of composite materials and synthetic ion resin with membrane processes were often adopted [Citation52]. Several kinds of adsorbent materials (activated carbon, activated alumina, bone charcoal, activated soil, tri-calcium phosphate, groundnut shell, activated coconut shell, rice husk) for the de-fluoridation process has been previously reported [Citation33,Citation53,Citation54]. The essential features of adsorbent in fluoride removal encouraged further exploitation of its potential applications. The three-phase process is involved during adsorption; fluoride ions are transferred to the external adsorbent surface from the aqueous solution; fluoride ions adsorption onto the particle surface, fluoride ions adsorbed are transferred to the adsorbent particles internal surface [Citation52].
Several factors influence adsorbent efficiency in fluoride removal and do not necessarily correlate that a high adsorbent capability will have optimal removal effectiveness [Citation53]. The advantages and limitations associated with the adsorption process are discussed further in ().
Membrane technology in water de-fluoridation has been demonstrated to be highly efficient; reverse osmosis has been proven as a proficient option to offer better drinking water compared to other conventional techniques [Citation53]. Similar examples of membrane technologies with high capability to provide adequate drinking water sources are dialysis, electrodialysis, and the nanofiltration process. The continuous technical developments in material research and design lead to membrane technology for the water treatment process to be highly reliable and cost-effective. In water de-fluoridation, membrane technology presents varied advantages than other conventional methods () [Citation33,Citation60,Citation61].
The ion exchange process is another feasible option for de-fluoridation of water, and ion exchange materials are utilized to allow water to flow through the material to remove undesirable ions. De-fluoridation of water with a durable anion-exchange basic resin comprising ammonium quaternary functional groups is feasible in utilizing resin as an ion exchanger, replacing fluoride ions with the chloride ions of the resin. Backwashing of the resin using the dissolved sodium chloride’s supersaturated water allows new ions of chloride to replace ions of the fluoride, leading to the revitalization of resin and refreshing the process again. The simple removal principle was previously further described [Citation33]. The ion exchanger is usually of two kinds; the cations exchanger and the anion exchanger are the charged positive ions and the charged negative ions. In addition to the resin, green sand, inorganic metallic oxides, zeolite, etc., were the commonly employed anion exchanger [Citation62]. The shortcomings and advantages of an ion-exchange process are highlighted further in .
Alum and lime are generally used as coagulants in the de-fluoridation of water. Adding lime results in fluoride precipitation as insoluble calcium fluoride and rising water pH value to the range (11–12). Ayoob et al. [Citation63] reported extensively on drinking water de-fluoridation with different technologies; they inferred that the process is sustainable in water de-fluoridation, but with limitations to effectively reducing fluoride concentrations to the desired level. Such limitations are overcome via a two-step process employing precipitation by lime as a first step and subsequently alum addition to cause coagulation. The reaction of alum with alkalinity ions generates insoluble aluminum hydroxide. Further interactions of the alum with fluoride ions in the water for de-fluoridation are achieved with a final water pH of 5.5–7.5 values [Citation33].
Electrochemical treatments: dialysis and electrodialysis is another process widely used in water de-fluoridation. The process splits solutes by transporting the solutes via a membrane instead of utilizing a membrane to hold the solutes. At the same time, water runs over as similar to the reverse osmosis and nano-filtration process. Precisely, the membrane ion-exchanger permits only the ions to pass through it and not water. Several studies on the deployment of electrodialysis for fluoride removal from aqueous solution [Citation53,Citation64] and fluoride removal rate (92%) have been previously reported [Citation65]. Water purification, disinfection, and de-fluoridation efficiency utilizing the ion-exchange membrane process are some of these techniques’ strengths (). Consideration for sustainability and demand for low-cost effective fluoride treatment techniques, further investigations on the benefits and defects of these techniques regarding the specific study area and the entire Gombe states are recommended.
5. Conclusions
This study makes available up-to-date information to better comprehend high-fluoride drinking water problems in twelve different Gombe state-Nigeria communities. The physical survey conducted presented severe fluorosis affliction in Lapan communities; (38% dental fluorosis, 27% skeletal fluorosis, 22% dental and skeletal, 13% without fluorosis) due to high fluoride concentration (2.4 mg/L). Considering the present study results, it is recommended that the responsible institutions adopt socio-economically feasible de-fluoridation techniques. Such treatment methods could be adsorption, coagulation/precipitation, membrane process, ion-exchange with the explicit aim of reducing the levels of the fluoride concentrations and comply with the WHO drinking water range.
Acknowledgments
This work was supported by the Waste water Pollution Control and Treatment grant of the Green Intelligent Environment School, Yangtze Normal University, China (Grant No. 01160056). The authors would like to thank the Gombe state university for their help and technical assistance during the study.
Disclosure statement
The authors declare that there is no conflict of interests regarding the publication of this paper.
Additional information
Funding
References
- WHO (World Health Organization); UNICEF (United Nations International Children’s Emergency Fund). Update and MDG assessment. World Heal Organ. 2015;2015:90.
- Asubiojo OI, Nkono NA, Ogunsua AO, et al. Trace elements in drinking and groundwater samples in Southern Nigeria. Sci Total Environ. 1997;208(1–2):1–8.
- Gleeson T, Befus KM, Jasechko S, et al. The global volume and distribution of modern groundwater. Nat Geosci. 2016;9(2):161–164.
- Al-Sulaiman SAA-W. Chemical Safety of drinking-water: assessing priorities for risk management. Int J Environ Stud. 2012;69(6):1001.
- Abbasnia A, Alimohammadi M, Mahvi AH, et al. Assessment of groundwater quality and evaluation of scaling and corrosiveness potential of drinking water samples in villages of Chabahr city, Sistan and Baluchistan province in Iran. Data Br. 2018;16:182–192.
- Dehghani MH, Zarei A, Yousefi M, et al. Fluoride contamination in groundwater resources in the southern Iran and its related human health risks. Desalin Water Treat. 2019;153:95–104.
- Li P, He X, Li Y, et al. Health implication of fluoride in groundwater of loess aquifer in the Chinese Loess Plateau: a case study of Tongchuan, Northwest China. Expo Heal. 2019;11(2):95–107. .
- He X, Li P, Wu J, et al. Poor groundwater quality and high potential health risks in the Datong Basin, northern China: research from published data. Environ Geochem Health 2020;43:791–812. .
- Adimalla N, Li P. Occurrence, health risks, and geochemical mechanisms of fluoride and nitrate in groundwater of the rock-dominant semi-arid region, Telangana State, India. Hum Ecol Risk Assess. 2019;25(1–2):81–103.
- Alexander LU, Elements T. Health: an environmental risk in Nigeria. Earth Sci. 2013;2:66.
- Li YH, Li YH, Wang S, et al. Adsorption of Fluoride from water by amorphous alumina supported on carbon nanotubes. Chem Phys Lett. 2001;350(5–6):412–416. .
- Ismail ZZ, AbdelKareem HN. Sustainable approach for recycling waste lamb and chicken bones for fluoride removal from water followed by reusing fluoride-bearing waste in concrete. Waste Manag. 2015;45:66–75.
- Li P, Qian H, Wu J, et al. Occurrence and hydrogeochemistry of fluoride in alluvial aquifer of Weihe River, China. Environ Earth Sci. 2014;71(7):3133–3145.
- Wu J, Li P, Qian H. Hydrochemical characterization of drinking groundwater with special reference to fluoride in an arid area of China and the control of aquifer leakage on its concentrations. Environ Earth Sci. 2015;73(12):8575–8588.
- Aranda PR, Llorens I, Perino E, et al. Removal of arsenic(V) ions from aqueous media by adsorption on multiwall carbon nanotubes thin film using XRF technique. Environ Nanotechnology, Monit Manag. 2016;5:21–26.
- Sachin V, JadhavaEugenioBringasbGanapati D, YadavaVirendra K, et al. Arsenic and fluoride contaminated groundwaters : a review of current technologies for contaminants removal. J Environ Manage. 2015;162:306–325.
- Mohammadi AA, Yousefi M, Mahvi AH. Fluoride concentration level in rural area in Poldasht city and daily fluoride intake based on drinking water consumption with temperature. Data Br. 2017;13:312–315.
- Nigerian Standards for Drinking Water Quality. (NSDWQ 554) 2007:ICS 13.060.20.
- WHO. Guidelines for drinking-water quality, volume 2: health criteria and other supporting information. Sci Total Environ. 2003;61:274.
- Guissouma W, Hakami O, Al-Rajab AJ, et al. Risk assessment of fluoride exposure in drinking water of Tunisia. Chemosphere. 2017;177:102–108.
- Vinati A, Mahanty B, Behera SK. Clay and clay minerals for fluoride removal from water: a state-of-the-art review. Appl Clay Sci. 2015;114:340–348.
- Tomar V, Prasad S, Kumar D. Adsorptive removal of fluoride from aqueous media using citrus limonum (lemon) leaf. Microchem J. 2014;112:97–103.
- Biswas G, Kumari M, Adhikari K, et al. Review on occurrence of fluoride and its removal through adsorption with an emphasis on natural minerals. Curr Pollut Reports. 2017;3(2):104–119.
- Akpata ES, Danfillo IS, Otoh EC, et al. Geographical mapping of fluoride levels in drinking water sources in Nigeria. Afr Health Sci. 2009;9(4):227–233.
- Sabo A, Adamu H, Umar Yuguda A. Assessment of wash-borehole water quality in Gombe metropolis, Gombe State, Nigeria. In: J Environ Earth Sci. 2013. p. 3.
- Baba S, Okechukwu M, State B. Prevalence of fluoride concentration in ground water sources in Kaltungo, Gombe State, Nigeria. Int J Trend Res Develop (IJTRD). 2019;6:14–20.
- Lovelyn SK, Hamidu H, Mbiimbe Y, et al. Suitability of ground and surface water resources for different uses in boh community Gombe State Northeastern Nigeria. Nat Sci. 2016;14:22–31.
- Azhdarpoor A, Radfard M, Rahmatinia M, et al. Data on health risk assessment of fluoride in drinking water in the Khash city of Sistan and Baluchistan province, Iran. Data Br. 2018;21:1508–1513.
- Moghaddam VK, Yousefi M, Khosravi A, et al. High concentration of fluoride can be increased risk of abortion. Biol Trace Elem Res. 2018;185(2):262–265.
- UNEP. Analytical methods for environmental water quality 2014:61.
- Dehbandi R, Moore F, Keshavarzi B. Geochemical sources, hydrogeochemical behavior, and health risk assessment of fluoride in an endemic fluorosis area, central Iran. Chemosphere. 2018;193:763–776.
- Alaya MB, Saidi S, Zemni T, et al. Suitability assessment of deep groundwater for drinking and irrigation use in the Djeffara aquifers (Northern Gabes, south-eastern Tunisia). Environ Earth Sci. 2014;71(8):3387–3421.
- Meenakshi MRC. Fluoride in drinking water and its removal. J Hazard Mater. 2006;137(1):456–463.
- Abouleish MYZ. Evaluation of fluoride levels in bottled water and their contribution to health and teeth problems in the United Arab Emirates. Saudi Dent J. 2016;28(4):194–202.
- Radfard M, Gholizadeh A, Azhdarpoor A, et al. Health risk assessment to fluoride and nitrate in drinking water of rural residents living in the Bardaskan City, Arid Region, Southeastern Iran. Desalin Water Treat. 2019;145:249–256.
- Arif M, Husain I, Hussain J, et al. Assessment of fluoride level in groundwater and prevalence of dental fluorosis in Didwana block of Nagaur district, central Rajasthan, India. Int J Occup Environ Med. 2013;4(4):178–184.
- Yousefi M, Ghoochani M, Hossein Mahvi A. Health risk assessment to fluoride in drinking water of rural residents living in the Poldasht city, Northwest of Iran. Ecotoxicol Environ Saf. 2018;148:426–430.
- Mandinic Z, Curcic M, Antonijevic B, et al. Fluoride in drinking water and dental fluorosis. Sci Total Environ. 2010;408(17):3507–3512.
- Yousefi M, Mohammadi AA, Yaseri M, et al. Epidemiology of drinking water fluoride and its contribution to fertility, infertility, and abortion: an ecological study in west azerbaijan province, poldasht county, Iran. Fluoride. 2017;50:343–353.
- Memon AG, Xing Y, Zhou X, et al. Ultrasensitive colorimetric aptasensor for Hg2+ detection using Exo-III assisted target recycling amplification and unmodified AuNPs as indicators. J Hazard Mater. 2020;384:3–8.
- Barghouthi Z, Amereih S. Field method for estimation of fluoride in drinking groundwater by photometric measurement of spot on aluminium quinalizarin reagent paper. Arab J Chem. 2017;10:S2919–25.
- Sunitha V, Reddy BR, Srinivas B. FLuoride in ground water of Anantapur town, Anantapur District, Andhra Pradesh, India. India J Appl Geochem. 2004;6:368–372.
- Murray JJ. A history of water fluoridation. Br Dent J. n.d.;134:347–350. 250–254, 299–302
- Chaturvedi AK, Yadava KP, Pathak KC, et al. Defluoridation of water by adsorption on fly ash. water, air, and soil pollution. Water Air Soil Pollut. 1990;49(1–2):51–61.
- Anses-French Agency for Food, Environmental and Occupational Health & Safety, 2015. (Report No. 2012-SA-0142). Maisons-Alfort n.d.
- Irigoyen-Camacho ME, García Pérez A, Mejía González A, et al. Nutritional status and dental fluorosis among schoolchildren in communities with different drinking water fluoride concentrations in a central region in Mexico. Sci Total Environ. 2016;541:512–519.
- Petersen PE, Lennon MA. Effective use of fluorides for the prevention of dental caries in the 21st century: the WHO approach. Community Dent Oral Epidemiol. 2004;32(5):319–321.
- Prevention and Control of Fluorosis in India, Rajiv gandhi national drink- ing water mission, manual, 1993. n.d.
- Gowri S, Parappa S, Manjula R, et al. 2013. The association between malnutrition, sorghum (jowar) and dental fluorosis among school children in urban field practice area of S.N. Medical College, Bagalkot, Karnataka. Indian J Contemp Dent. 2013. 14–17.
- Grimaldo M, Borja-Aburto VH, Ramírez AL, et al. Endemic fluorosis in San Luis Potosi. Mexico. Identification of risk factors associated with human exposure to fluoride. Environ Res. 1995;68(1):25–30.
- Hernández-Montoya V, Ramírez-Montoya LA, Bonilla-Petriciolet A, et al. Optimizing the removal of fluoride from water using new carbons obtained by modification of nut shell with a calcium solution from egg shell. Biochem Eng J. 2012;62:1–7.
- Habuda-Stanic´ M, Ravancˇic´ AF ME. A review on adsorption of fluoride from aqueous solution. Materials (Basel). 2014;7(9):6317–6366.
- Kumar K, Gupta N, Kumar V, et al. Review article A review of emerging adsorbents and current demand for de fl uoridation of water : bright future in water sustainability. Environ Int. 2018;111:80–108.
- Velazquez-jimenez LH, Vences-alvarez E, Flores-arciniega JL, et al. Water defluoridation with special emphasis on adsorbents-containing metal oxides and/or hydroxides : a review. Sep Purif Technol. 2015;150:292–307.
- Amuda OS, Giwa AA, Bello IA. Removal of heavy metal from industrial wastewater using modified activated coconut shell carbon. Biochem Eng J. 2007;36(2):174–181.
- Samadi MT, Zarrabi M, Sepehr MN, et al. Removal of fluoride ions by ion exchange resin: kinetic and equilibrium stu- dies. Environ Eng Manag J. 2014;2014(13):205–214.
- Potgeiter JH. An experimental assessment of the efficiency of different defluoridation methods.. Chem SA. 1990;317–318.
- Shen F, Chen X, Gao P. GC. Electrochemical removal of fluoride ions from industrial wastewater. Chem Eng Sci. 2003;58(3–6):987–993.
- Suneetha M, Sundar BS, Ravindhranath K. Studies on defluoridation techni- ques. Int J Chem Tech Res. 2015;8:295–309.
- Singh J. Fluoride ions vs removal technologies : a study. Arab J Chem. 2016;9(6):815–824.
- Bason A, Ben-David Y, Oren VF. Characterization of ion transport in the active layer of RO and NF polyamide membranes Desalination. Arab J Chem. 2006;199:31–33.
- Singh J, Singh P, Singh A. Fluoride ions vs removal technologies: a study. Arab J Chem. 2016;9(6):815–824.
- Ayoob S, Gupta AK. VTB. A conceptual overview on sustainable tech- nologies for defluoridation of drinking water and removal mechanisms. Crit Rev Environ Sci Technol. 2008;38(6):401–470.
- Majewska-Nowak K, Grzegorzek M, Kabsch-Korbutowicz M. Removal of fluoride ions by batch electrodialysis. Environ Prot Eng. 2015;41:67–81.
- Gmar S, Sayadi IBS, Helali N, et al. Desalination and de- fluoridation of tap water by electrodialysis. Environ Process. 2015;2(S1):209–222. .