
ABSTRACT
The funding situation for start-ups is influenced by factors such as policy interest rates and the trends of the stock market. However, the impact is not uniform across all growth stages, and it varies depending on the growth stage. As a result, the funding situation may be different for each funding round. This study aims to examine the funding situation of American start-ups since 2017 using a commercial database, analyze each funding round, and clarify the relationship between changes in external conditions and the funding situation for each round. Many reports suggest that the valuation of start-ups is decreasing due to the impact of financial tightening and the Ukrainian crisis, but detailed articles analyzing the situation for each funding round are not readily available. The media, such as the Nikkei, reported that the overall fundraising situation for start-ups is worsening. However, this study found that the impact on the funding situation for start-ups varies depending on the growth stage, and, particularly in the series B round, the investment amount has hardly changed. Based on these results, it is suggested that venture capital funds and companies should continue to invest in start-ups while considering the characteristics of each funding stage, without shrinking their investments.
Introduction
The amount of start-up investment in the United States temporarily decreased in the second quarter of 2020 (Q2 2020) due to the global outbreak of COVID-19, but has since been on an upward trend. According to a report by CB Insights (Citation2023a), which investigates and analyzes the trends of start-ups and venture capital, the total amount of funds raised reached a record high of $311.5 billion in 2021, more than double the $151.2 billion in 2020. Looking at the total amount of funds raised each quarter, the Q4 2021 set a new record, with $92.8 billion.
However, since the beginning of 2022, there has been a sharp brake on the historical growth of start-up investment. The fundraising amount for Q1 2022 was $71.2 billion, a 24 percent decrease compared to Q4 2021, and it turned negative for the first time in seven quarters. There have been many reports that the high uncertainty of the stock market due to factors such as the tapering and rapid interest rate hikes of the U.S. Federal Reserve and the skyrocketing of energy and food prices triggered by the Ukrainian crisis are major factors in the stagnation of the high-tech stock market and the initial public offering (IPO) market. On the other hand, there have been reports of venture capital firms forming new large funds and start-ups raising more than $100 million (Primack, Citation2023; Rooney, Citation2022).
The funding process is reported to be impacted by the following factors:
the number of employees, amount of revenues, investment, profit, and the developing status of a product (Shelters, Citation2013);
a founder’s risk tolerance and preference (Ang et al., Citation2010);
the intrinsic characteristics of a founder (Gastaud et al., Citation2019);
the offered products and services (Roeder et al., Citation2018);
start-ups’ characteristics, such as reputation and experience (Cumming et al., Citation2005);
business connections (Cohen et al., Citation2008); and
entrepreneurial characteristics of the investors (Bachher et al., Citation1999; Clarysse et al., Citation2005; Franke et al., Citation2006; Zacharakis & Shepherd, Citation2005).
While numerous studies have delved into the factors influencing the entrepreneurial funding process, there exists a notable gap in the literature with regard to the comprehensive analysis of funding trends resulting from this process, especially concerning distinct funding rounds. In this study, we focused on the trends in funding rounds previously unreported. We hypothesized that the severity of deterioration in start-ups funding varies depending on the funding stage of the start-ups, namely the funding round. To test this hypothesis, we compiled the situation of funding rounds for start-ups in the United States since 2017 using a commercial database and clarified the relationship between the funding stage of start-ups and changes in the fundraising environment.
Data collection
We used data provided by CB Insights, a U.S.-based private company with a business analytics platform and global database, as well as data from Crunchbase Pro, the world’s largest start-ups database, to analyze the relationship between the growth stage of start-ups and changes in the funding environment by summarizing the situation of start-ups funding rounds in the United States since 2017. We created graphs and other visualizations using the numbers derived from these two databases. While Pitchbook is another commonly used database for start-up investment data, we judged that using these two databases was sufficient to investigate trends.
Results and discussion
is a stacked bar chart that categorizes the total funding raised from 2017 to the first quarter of 2023 by stage. Bridge financing and other similar types of financing have been excluded for clarity. It is evident at a glance that the amount of investment significantly decreased across all stages from 2021 to 2022.
Figure 1. Total amount of start-ups investment by stage.
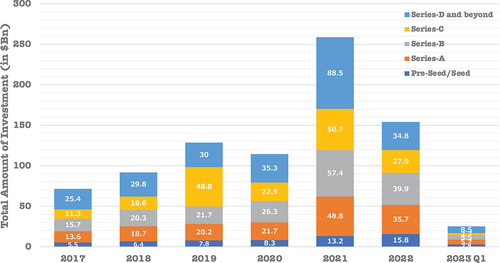
In the United States, series B rounds are said to be “a barometer of the confidence in the entire start-ups ecosystem” (Entertainment Funda). This is because series B is the midway stage for start-ups funding. Companies raising funds at this point usually have proven technology or product and are on the cusp of more pronounced scaling. However, an exit is still likely years away, making factors like a shuttered IPO market or sluggish mergers and acquisitions (M&As) environment less of a concern. With those considerations, we focus on the series B round.
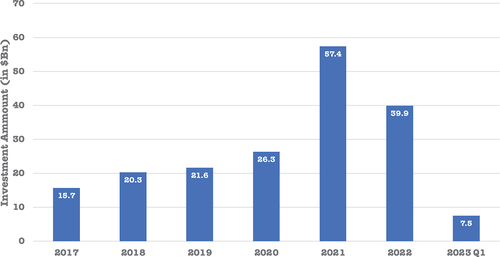
is a bar chart showing the trend of total investments in series B rounds from 2017 to Q1 2023. This is a steady increase from $15.7 billion in 2017 and jumps all the way to $57.4 billion in 2021. It was $39.9 billion in 2022. Despite the slowdown in 2022, it still increased by $3.6 billion compared to $26.3 billion in 2020, indicating the strong momentum of start-up investments.
Figure 2. Annual changes of series B investment.
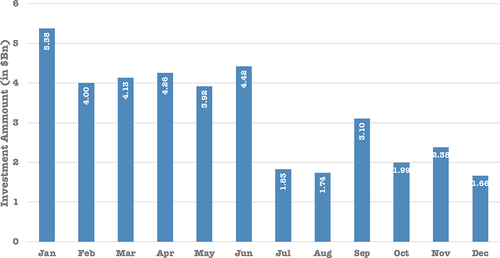
shows the monthly change of the series B investment in 2022. In January, it continued the previous year’s momentum at $5.38 billion, and then remained around $4 billion. However, by July, when investors began taking their summer vacations, it was dropped significantly to $1.8 billion. In September, with the summer holidays over, it recovered a bit, but not enough to return to the situation in which it had been prior to July.
Figure 3. Monthly changes of series B investment in 2022.
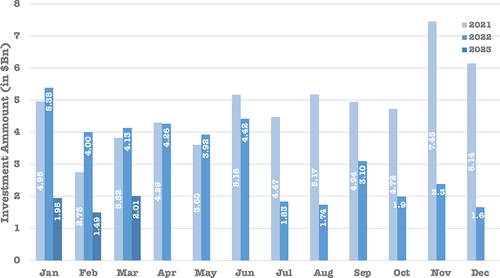
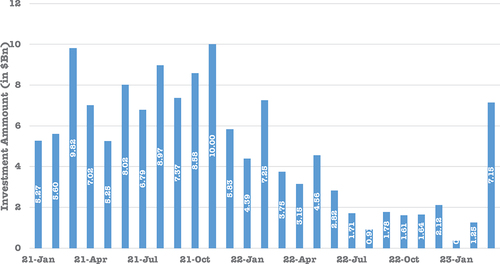
A comparison of the monthly investment amount in series B rounds from 2021 to Q1 2023 is shown in . It can be seen that investment activity was active even in July and August 2021, and more active in the second half 2021 (H2 2021). In Q1 2023, the investment amount continues to be sluggish from H2 2022.
Figure 4. Monthly changes of series B investment in 2021, 2022, and Q1 2023.
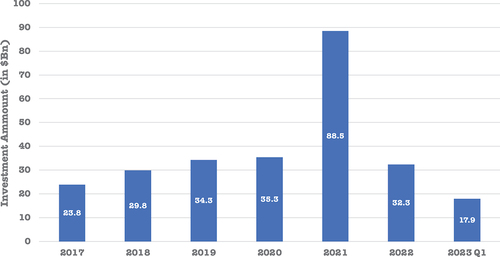
The investment amount decreased significantly in all stages from 2021 to 2022. Among them, the decrease was particularly significant in the series D and later rounds. Therefore, we analyzed the series D and later rounds and present the trend of investment amounts in for the period from 2017 to Q1 2023. The investment gradually increased from $23.8 billion USD in 2017, peaked at $88.5 billion USD in 2021, up from $35.3 billion USD in 2020. However, it significantly decreased to $32.3 billion USD in 2022, which is less than half the amount in 2021. Nevertheless, the investment amounts in series D and later rounds in 2022 are nearly at the same level as in 2019 and 2020.
Figure 5. Annual investment amount of series D and beyond.
is a graph illustrating the monthly trend of total investments in series D rounds and beyond in 2022. In the series D round and beyond, the trend is almost a steady decline, indicating a significant reduction in investment. shows the monthly change in total investments in the series D round and beyond from 2021 to Q1 2023. Compared to 2021, where a certain amount of money was invested each month, it is easy to see how sluggish is 2022. In particular, from July to September 2022, it was extremely sluggish, with monthly investment amounts not reaching $2 billion.
Figure 6. Monthly changes of investment amount of series D and beyond in 2022.
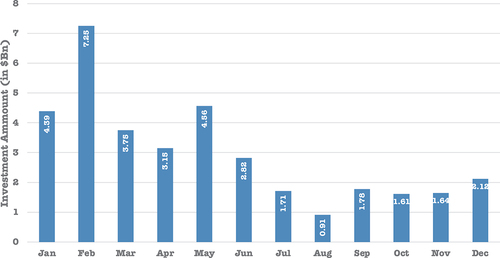
Figure 7. Monthly changes of investment amount of series D and beyond in 2021, 2022, and Q1 2023.
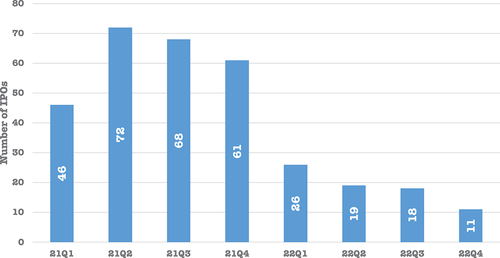
To see if this weakness in series D and beyond in 2022 could be attributed to the weakness in EXITs, where the startups go public via Initial Public Offering (IPO) or acquired by another company, we examined the number of IPOs and the number of M&As. shows the quarterly change in the number of IPOs in 2021 and 2022. We can see over 50 IPOs on every quarter in 2021, but it dropped sharply in 2022. Especially Q4 2022 saw 11 IPOs, down approximately 80 percent year-on-year, a rare dropping in recent years.
Figure 8. Quarterly changes of the number of IPOs.
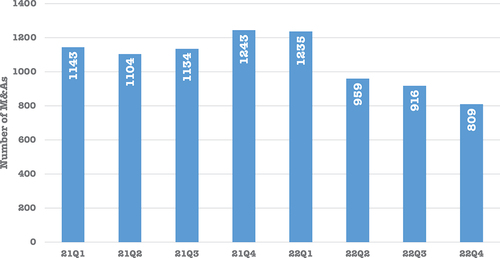
shows the quarterly change of the number of M&As in 2021 and 2022. Although not as much as IPOs, M&A activity is declining in 2022. clearly show that the EXIT environment for start-ups is significantly stagnating. The stagnation in the EXIT environment resulted in a decrease in exit opportunities for later-stage start-ups. Moreover, the investment capital that was previously flowing into the later-stage start-ups shifted toward low-risk savings accounts and other types of funds in response to higher policy interest rates. It is believed that these factors contributed to the decline in investments in series D and beyond.
Figure 9. Quarterly changes of number of M&As.
Conclusion
Throughout the research, we closely examined the funding situation of start-ups in the United States, analyzing it on a round-by-round basis. By using commercial databases, such as CB Insights and Crunchbase Pro, our research has yielded valuable insights into the recent funding landscape of U.S. start-ups. Notably, we observed that the extent of funding decline varies across different rounds, with the series B round experiencing less significant reduction in investment compared to other stages. This is likely due to the fact that start-ups securing series B funding are typically in a more advanced stage, having successfully achieved product–market fit, and still are several years away from potential exits. Consequently, they may not be as susceptible to external factors, such as stagnation in the M&A environment and downturns in the IPO market. As a consequence of the reduced exit opportunities in later stages in the current economic climate, we have also observed a shift in investment funds from later-stage to mid-stage start-ups.
Based on these findings, we propose that venture capital funds and companies should consider a more sustained approach to investing in start-ups, adapting their strategies to the specific characteristics of each funding round.
Building on our findings, we think it is now more relevant to expand the research focus beyond just the United States to worldwide. According to the “State of Venture Q2 2023” (CB Insights, Citation2023b), start-ups have raised approximately 130 billion USD in fundraising worldwide. Of this amount, 74 billion USD was raised in the United States, accounting for 56.9 percent. On the other hand, fundings in regions such as India and Africa are also increasing rapidly. Considering global trends and taking those factors into account to the future research, we believe it will provide valuable insight to deepen our understanding of specific characteristics of start-ups’ fundraising at each round.
Furthermore, we also believe contemplating the economic situation would be necessary and intriguing for future research. For instance, since the Federal Reserve Board (FRB) decided to lift its zero-interest-rate policy at the March 2022 Federal Open Market Committee (FOMC) meeting, the FRB has raised interest rates a total of 11 times until the July 2023 FOMC meeting, with the rate hike range reaching 5.25 percent during this period. Tighter monetary policy could curb investment in venture funds by institutional investors and others, or even result in a major change in investment strategy.
While prior research primarily focused on the significant factors in the financing process, our research sheds light on the value of adopting a sustained investment strategy, with the potential to significantly enhance the performance of venture funds. The optimization of their investment approaches across various funding rounds now emerges as one of the key factors for achieving investment success.
Disclosure statement
No potential conflict of interest was reported by the authors.
References
- Ang, J. S., Cole, R. A., & Lawson, D. (2010). The role of owner in capital structure decisions: An analysis of single-owner corporations. Journal of Entrepreneurial Finance, 14(1), 1–36.
- Bachher, J. S., Diaz de Leon, E., & Guild, P. D. (1999). Decision criteria used by investors to screen technology-based ventures. In D. F. Kocaoglu (Ed.), 99: Portland international conference on management of engineering and technology. Proceedings vol-1: Book of summaries: Technology and innovation (pp. 269–273). PICMET. https://doi.org/10.1109/PICMET.1999.787815
- CB Insights. (2023a). State of Venture 2022 Report [PDF file]. Retrieved April 28, 2023, from https://app.cbinsights.com/research/report/venture-trends–20
- CB Insights. (2023b). State of Venture Q2 2023 Report [PDF file]. Retrieved October 20, 2023, from https://app.cbinsights.com/research/report/venture-trends2023
- Clarysse, B., Wright, M., Lockett, A., Van de Velde, E., & Vohora, A. (2005). Spinning out new ventures: A typology of incubation strategies from European research institutions. Journal of Business Venturing, 20(2), 183–216.
- Cohen, L., Frazzini, A., & Malloy, C. (2008). The small world of investing: Board connections and mutual fund returns. Journal of Political Economy, 116(5), 951–979.
- Cumming, D., Fleming, G., & Suchard, J.-A. (2005). Venture capitalist value-added activities, fundraising and drawdowns. Journal of Banking & Finance, 29(2), 295–331.
- Franke, N., Gruber, M., Harhoff, D., & Henkel, J. (2006). What you are is what you like—Similarity biases in venture capitalists’ evaluations of start-up teams. Journal of Business Venturing, 21(6), 802–826.
- Gastaud, C., Carniel, T., & Dalle, J.-M. (2019). The varying importance of extrinsic factors in the success of startup fundraising: Competition at early-stage and networks at growth-stage. arXiv preprint arXiv:1906.03210. Retrieved October 25, 2023, from https://arxiv.org/abs/1906.03210
- Oshima, Y. (2022, April 13). U.S. private equity investment declines for the first time in two years in January-March due to easing money contraction (in Japanese). NIKKEI. Retrieved May 13, 2023, from https://www.nikkei.com/article/DGXZQOGN010F50R00C
- Primack, D. (2023, March 16). Payments giant stripe raises $6.5 billion at a $50 billion valuation. Axios. Retrieved March 18, 2023, from https://www.axios.com/2023/03/15/stripe-50-billion
- Roeder, J., Rodríguez, C. D., Palmer, M., Werth, O., Muntermann, J., & Breitner, M. H. (2018). Make or break: Business model determinants of FinTech venture success. In P. Drews (Ed.), Multikonferenz Wirtschaftsinformatik (MKWI) 2018 (pp. 1221–1232). Leuphana University of Lüneburg.
- Rooney, Kate. (2022, May 25). Andreessen Horowitz raises $4.5 billion crypto fund to take advantage of bargains in down market. CNBC. Retrieved April 28, 2023, from https://www.cnbc.com/2022/05/25/andreessen-horowitz-raises-4point5-billion-crypto-fund-in-down-market.html
- Shelters, D. (2013). Start-up guide for the technopreneur: Financial planning, decision making, and negotiating from incubation to exit. Wiley.
- Zacharakis, A., & Shepherd, D. A. (2005). A non-additive decision-aid for venture capitalists’ investment decisions. European Journal of Operational Research, 162(3), 673–689.