
Abstract
The aim of the study is to investigate the association of fasting plasma glucose (FPG) with the prevalence and severity of coronary artery disease (CAD) in different ethnic groups without diabetes history in Xinjiang. Patients without diabetes history, who had undergone coronary angiography, were obtained. The levels of FPG in different ethnics were analyzed. The Gensini score was explored to evaluate the degree of coronary artery stenosis, and the logistic regression analysis was adopted to explore the risk factors of the prevalence of CAD. A total of 1500 cases (men 71.2%; mean age 57.6 ± 10.6 years; 1095 cases of CAD) were included. The incidence rates of CAD were 76.8% in Han, 72.5% in Uyghur and 68.1% in Kazakh group, respectively (P = .009), while the Gensini scores in Kazahk group (36.63 ± 33.88) were lower than the other ethnic populations (P = .003). The FPG levels in patients with CAD were significant higher than that without in all the ethnic groups (P < .01). Furthermore, it was indicated that the FPG levels (OR = 1.22, 95%CI 1.07–1.39, P = .003), as well as the age, sex, smoking or hypertension history, were associated with the CAD risk. FPG level was an independent risk factor of the prevalence and severity of CAD in population in Xinjiang.
Introduction
Coronary artery disease (CAD) is a growing health concern in the world as the first killer, with the increasing number of reported cases and mortality rate in China per year (Collaborators Citation2015). It is widely accepted that diabetes is one of the major risk factors of CAD, and the CAD often presents a severer outcome in patients with type 2 diabetes (Boussageon et al. Citation2011; Gao et al. Citation2011). But, the correlation between the diabetes-related indicators in population without diabetes and cardiovascular disease (CD) is not well clarified. A large amount of studies have indicated that the blood glucose levels in pre-diabetes patients are higher than the normal threshold, which is suggested to a higher risk of developing diabetes (Davidson Citation2003; Tuso Citation2014). It is reported that more than 400 million people will be affected by the pre-diabetes in the world in 2030 (Tabak et al. Citation2012). A J-type association between the diabetes indicators in a large population without diabetes and CD was confirmed in a recent prospective study (Di Angelantonio et al. Citation2014), and it is demonstrated that the impaired glucose tolerance (IGT) is associated with an increased risk of CD (Faerch et al. Citation2014; Buysschaert et al. Citation2015). Recently, the role of impaired fasting glucose (IFG) in the development of CD in patients with pre-diabetes has been followed with interest in several literatures (De Caterina and Madonna Citation2010). However, the association between fasting plasma glucose (FPG) in population without diabetes and the severity of CAD is still controversial. Besides, racial factor should be considered to research the relationship between FPG and CAD (Meadows et al. Citation2011). Here, a cross-sectional study was undertaken in our hospital to explore the association of FPG with the prevalence and severity of CAD in different ethnic population without diabetes history.
Materials and methods
Study setting and participants
A cross-sectional study of indigenous adults, without diabetes history, aged ≥18 years, presenting suspected CAD and undergoing coronary angiography, was undertaken in our hospital in Xinjiang, northwest China between January 2016 and September 2016. The ethnic population was classified as Han, Uyghur and Kazakh. CAD was defined as ≥50% reduction of lumen diameter in at least one major coronary artery or its main branches, as shown in the coronary angiography. Patients, presenting with severe hepatic or gallbladder disease, acute renal failure, cardiac insufficiency, acute myocardial infarction within 2 weeks, hemolytic anemia, malignant tumor and participants with incomplete data, and the patients who take types of drugs that affect CAD, such as ARB or ACE, beta blocker, CCB, statin, ASAP, anti-PLT agents, and others, were excluded. The demographic data, including age, diabetes history, history of hypertension, smoking history and family history etc., were collected.
Coronary angiography
A typical Judkins method was carried out to perform the coronary angiography. Briefly, all of the study subjects underwent a right radial artery puncture, were followed by the multi-position projection, and diagnosed through at least two interventional physicians. The degree of coronary artery stenosis, which is defined as the reduced diameter compared with the normal diameter of adjacent artery, was evaluated using a Gensini score according to the criteria of American Heart Association (AHA) (Gensini Citation1983). Typically, the degree of stenosis was quantitatively diagnosed with the following options: ≤25% (1 score), 26–50% (2 scores), 51–75% (4 scores), 76–90% (8 scores), 91–99% (16 scores), 100% (32 scores), and was multiplied by the corresponding coefficient. The coefficients in different branches of the coronary artery were suggested score × 5 in left main lesion; score × 2.5, 1.5 and 1 in the proximal, middle piece and distal of left anterior descending artery lesion, respectively; score × 2.5, 1 and 1 in the proximal, middle piece and distal of left circumflex branch lesion, respectively; score × 1 in right coronary artery lesion; and score × 0.5 in other branch diseases.
Diagnosis of diabetes
All of the study populations fasted for 12 h followed a FGP determination using a blood glucose monitor (Accu-Chek, Roche, Basel, Switzerland) in the next morning. The diabetes was diagnosed according to the guide published by American Diabetes Association (ADA) in 2014 (Association Citation2014). In this study, the patients were divided into 4 groups according to the FPG levels as follows: FPG < 5.6 mM, 5.6 ≤ FPG < 6.1 mM, 6.1 ≤ FPG < 7.0 mM and FPG≥ 7.0 mM.
Laboratory tests
Blood was collected by a venous puncture for immediate processing. Serum was separated and stored at −20°C until analyzed. The levels of glycosylated hemoglobin (HbA1c), urea, total bilirubin (TBIL), triglyceride (TG), total cholesterol (TC), high density lipoprotein cholesterol (HDL-C) and low density lipoprotein cholesterol (LDL-C) in serum were performed using a blood biochemical analyzer (DXC800, Beckman Coulter, Inc. USA) analyzer.
Statistical analysis
The statistical analysis was performed using the SPSS 21.0 software (IBM SPSS Statistics, New York, USA). The chi-square test was used to compare the categorical variables. The continuous variables were presented by mean ± SD, and the independent samples t-test or ANOVA was performed to analyze the significance of different groups. The independent risk factors of CAD were analyzed by multivariate logistic regression. A P-value < .05 was considered significant.
Ethics
This study has been approved by the Ethics Committee of the First Affiliated Hospital of Xinjiang Medical University. All study participants provided written informed consent before participating in the study.
Results
Demography of study population
A total of 1500 cases, presenting suspected CAD without diabetes history and undergoing coronary angiography, were included during the study period, with the average age 57.6 ± 10.6 (range 30–80) years old and 71.2% of male. Han, Uyghur and Kazakh live differently and have different lifestyles due to genetic, language, cultural and social diversity. Of these, 1095 cases (73.0%) were diagnosed CAD according to the coronary angiography. Besides, for the ethnic classification, 587 cases (39.1%) were Han, 502 cases (33.5%) were Uyghur and 411 cases (27.4) were Kazakh. As shown in Table , the incidence rates of CAD were gradually decreased in Han (76.8%), Uyghur (72.5%) and Kazakh (68.1%) group (P = .009). The average age in patients with CAD was significant older than that without in all of the three ethnic groups (P < .001), as well as the percentages of male patients, smoking and hypertension proportion (P < .05). It was suggested that the males, who had older age, with a smoking or hypertension history, were more likely to have CAD regardless of the kind of ethnic group in China.
Table 1. The demography and clinical indexes in different ethnic populations with or without CAD.
Clinical indexes
The clinical biochemical indicator in the study population with or without CAD in different ethnic groups was also evaluated. As shown in Table , the prevalence and severity of CAD was reflected by the Gensini scores, which were highest in the Uyghur group (45.87 ± 40.51) and lowest in the Kazahk group (36.63 ± 33.88, P = .003). Besides, the Gensini scores were significant higher in CAD patients compared to those without CAD in the study population (P < .001). The serum HbAlc levels in patients with CAD were slightly higher than those without in the Uyghur group (P = .024), but not in Han and Kazahk population (P > .05). Besides, the TC levels in cases with CAD were significant than those without in Uyghur (P < .001) and Kazahk groups (P = .040), but not in Han population (P > .05). Whereas the LDL-C levels in CAD patients were lower in Han (P = .042) and Uyghur (P = .002) groups, but not in Kazahk groups (P > .05). Furthermore, the HDL-C levels in CAD patients were lower than those without in all of the three ethnic populations (P < .05). Interestingly, the FPG levels in CAD patients were much higher than those without in all the ethnic population (P < .001), suggesting a more susceptibility of CAD in people with higher FPG level regardless of the ethnic group. There were no significant differences in TBIL, urea and TG levels between the population with or without CAD in different ethnic groups (P > .05).
Serum FPG is positively correlated to the Gensini scores
To investigate the correlation between FPG and CAD or other biochemical indicators, the cases were classified according to the serum FPG levels as <5.6, 5.6–6.0, 6.1–7.0 and >7.0 mM. As shown in Table , the gradual elevation of the FPG levels was accompanied with the significant increase of the levels of HbA1c and TG (P < .05), while the HDL-C levels were decreased with the rise of the FPG levels in all of the study ethnic groups (P < .01). There was no obvious trend of variation in the levels of TBIL, urea, LDL-C and TG accompanied with the elevation of FPG (P > .05). It was suggested that the serum levels of HbA1c, TG and HDL-C might be affected by the FPG.
Table 2. The clinical indexes in different ethnic populations classified by the serum FPG levels.
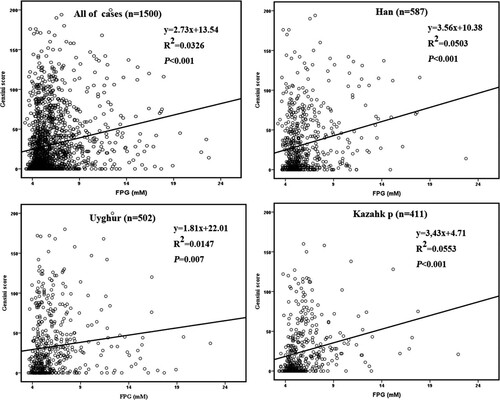
The relationship between serum FPG and Gensini scores was also studied. It seemed that the average Gensini scores in Kazakh individuals were slightly lower than the Han and Uyghur groups in population with the FPG levels below 5.6 or above 7.0 mM (P < .05, Figure ). As expected, the Gensini scores were gradually increased with the elevation of FPG levels in all of the three ethnic groups (P < .05), except for a slight decrease in Kazakh individuals at the FGP levels above 7.0 mM (Figure ). Besides, the Pearson correlation analysis demonstrated that there was a positive correlation between serum FPG and Gensini scores in all of the ethnic groups (R > 0, P < .01, Figure ). It was indicated that the higher FPG levels might lead to a more severe CAD regardless of the race.
Figure 1. The Gensini scores in different ethnic groups classified by the serum FPG. P < .001 compared to normal individuals (FPG < 5.6 mmol/L).
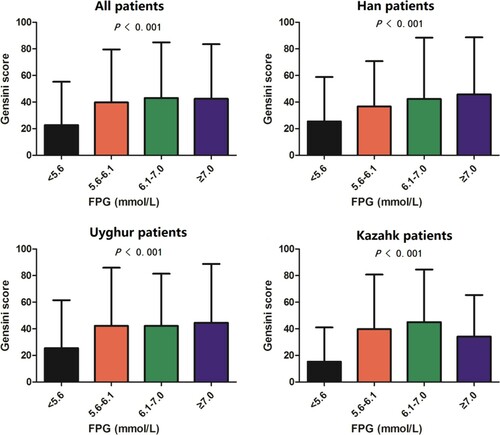
Figure 2. The correlation between serum FPG and Gensini scores in different ethnic groups estimated by Pearson analysis.
Serum FPG is the independent risk factor of CAD
To investigate the risk factors of the prevalence of CAD, a logistic regression analysis was performed. As shown in Table , the sex was a risk factor of CAD (OR = 0.48, 95% CI = 0.27–0.86, P = .013) and male would increase the risk of the disease in Uyghur population, but not in Han and Kazahk groups (P > .05). However, people, who were older, or with smoking or hypertension history, would increase the risk of prevalence of CAD in all of the ethnic groups (OR > 1, P < .05). As expected, the risk of CAD was significantly increased in population with higher levels of FPG in all of the ethnic groups (OR > 1, P < .01), it indicated that the serum FPG is an independent risk factor of the disease.
Table 3. Logistic regression analysis the risk of CAD.
Discussion
As all of us know, the diabetes is a ‘coronary heart disease equivalent’ expounded by the National Cholesterol Education Program (NCEP) (Lorbeer et al. Citation2011). Recently, it is demonstrated that the pre-diabetes, which are defined as patients without diabetes but in the stage of impaired glucose tolerance or fasting glucose, will increase the risk of CD (Hu et al. Citation2002; Capaldo et al. Citation2013). Kurihara et al. (Citation2013) reported that the vulnerability of plaque and the risk of development of coronary atherosclerosis (CA) were increased in patients with pre-diabetes, and the elevated levels of blood glucose or glycosylated hemoglobin are positively correlated with development of atherosclerosis (Lorbeer et al. Citation2011). Besides, Ok et al. (Citation2012) showed that the elevated blood glucose was an independent risk factor of coronary artery calcification in peritoneal dialysis patients without diabetes. Herein, the relationship between the FPG levels in different ethnic population without diabetes history and CAD was studied. In the study, the Kazahk populations presented a lowest incidence rate of CAD and Gensini score. Interestingly, the incidence rate of CAD in Han population was higher, but the Gensini score was slightly lower than that in Uyghur group (41.82 ± 38.31 vs. 45.87 ± 40.51, P > .05) (Li et al. Citation2012). However, coincident with the previous reports (Bartnik et al. Citation2004; Muntner et al. Citation2004; Oliveira et al. Citation2007; Schinner et al. Citation2011), we found that the Gensini scores were increased along with the elevation of FPG levels regardless of the race. We also found that the levels of FPG were positively correlated to the Gensini scores, and was an independent risk factor of CAD, which indicated that more severe impaired fasting glucose would result in more serious CAD.
The FPG level is significantly correlated with the metabolic syndrome, and the elevated FPG often results in higher BMI, waist–hip ratio, blood pressure, and aggravated dyslipidemia, which are the major risk factors of CD (Dong et al. Citation2008; Yan et al. Citation2009). In this study, the dyslipidemia was intensified gradually with the elevation of FPG levels regardless of the race, as indicated by serum TG, HDL-C and TC, which are associated with insulin resistance and insulin levels, and are independent predictors of CAD (Miller and Miller Citation1975; Hokanson and Austin Citation1996). It is indicated that the elevation of FPG will accompany with the insulin resistance in the IFG stage, which may directly or indirectly promote the occurrence and development of atherosclerosis.
Considering for blood glucose, simply diagnosis of diabetes is not enough for the assessment of glucose metabolism in patients with high risk of CD, a systematic evaluation of blood glucose level in the cardiovascular risk is needed (Coutinho et al. Citation1999). In this study, the severity of CAD was significantly increased with the elevated FPG even in pre-diabetes patients whose serum FPG levels were lower than 7.0 mM. It was suggested that a special attention should be paid to FPG in CD patients without diabetes history, and customized intervention programs should be developed to manage the risk factors and minimize the morbidity of CAD.
Acknowledgements
This study was supported by Department of Cardiology, the First Affiliated Hospital of Xinjiang Medical University.
Disclosure statement
No potential conflict of interest was reported by the author(s).
Data availability statement
Due to the nature of this research, participants of this study did not agree for their data to be shared publicly, so supporting data is not available.
Additional information
Funding
References
- Association AD. 2014. Diagnosis and classification of diabetes mellitus. Diabetes Care. 37(Suppl 1):S81–S90.
- Bartnik M, Rydén L, Ferrari R, Malmberg K, Pyörälä K, Simoons M, Standl E, Soler-Soler J, Öhrvik J. 2004. The prevalence of abnormal glucose regulation in patients with coronary artery disease across Europe: the Euro heart survey on diabetes and the heart. Eur Heart J. 25(21):1880–1890.
- Boussageon R, Bejan-Angoulvant T, Saadatian-Elahi M, Lafont S, Bergeonneau C, Kassai B, Erpeldinger S, Wright JM, Gueyffier F, Cornu C. 2011. Effect of intensive glucose lowering treatment on all cause mortality, cardiovascular death, and microvascular events in type 2 diabetes: meta-analysis of randomised controlled trials. Br Med J. 343:d4169.
- Buysschaert M, Medina JL, Bergman M, Shah A, Lonier J. 2015. Prediabetes and associated disorders. Endocrine. 48(2):371–393.
- Capaldo B, Di Bonito P, Iaccarino M, Roman MJ, Lee ET, Devereux RB, Riccardi G, Howard BV, De Simone G. 2013. Cardiovascular characteristics in subjects with increasing levels of abnormal glucose regulation: the strong heart study. Diabetes Care. 36(4):992–997.
- Collaborators GMaCoD. 2015. Global, regional, and national age-sex specific all-cause and cause-specific mortality for 240 causes of death, 1990–2013: a systematic analysis for the Global Burden of disease study 2013. Lancet. 385(9963):117–171.
- Coutinho M, Gerstein HC, Wang Y, Yusuf S. 1999. The relationship between glucose and incident cardiovascular events. A metaregression analysis of published data from 20 studies of 95,783 individuals followed for 12.4 years. Diabetes Care. 22(2):233–240.
- Davidson MB. 2003. Metabolic syndrome/insulin resistance syndrome/pre-diabetes: new section in diabetes care. Diabetes Care. 26(11):3179.
- De Caterina R, Madonna R. 2010. Impaired fasting plasma glucose and long-term cardiovascular risk: still a foggy relationship. Eur Heart J. 31(10):1159–1162.
- Di Angelantonio E, Gao P, Khan H, Butterworth AS, Wormser D, Kaptoge S, Kondapally Seshasai SR, Thompson A, Sarwar N, Willeit P, et al. 2014. Glycated hemoglobin measurement and prediction of cardiovascular disease. Jama. 311(12):1225–1233.
- Dong X, Zhou L, Zhai Y, Lu B, Wang D, Shi H, Luo X, Fan W, Hu R. 2008. Impaired fasting glucose and the prevalence and severity of angiographic coronary artery disease in high-risk Chinese patients. Metabolism. 57(1):24–29.
- Faerch K, Vistisen D, Johansen NB, Jorgensen ME. 2014. Cardiovascular risk stratification and management in pre-diabetes. Curr Diab Rep. 14(6):493.
- Gao Y, Lu B, Sun ML, Hou ZH, Yu FF, Cao HL, Chen Y, Yang YJ, Jiang SL, Budoff MJ. 2011. Comparison of atherosclerotic plaque by computed tomography angiography in patients with and without diabetes mellitus and with known or suspected coronary artery disease. Am J Cardiol. 108(6):809–813.
- Gensini GG. 1983. A more meaningful scoring system for determining the severity of coronary heart disease. Am J Cardiol. 51(3):606.
- Hokanson JE, Austin MA. 1996. Plasma triglyceride level is a risk factor for cardiovascular disease independent of high-density lipoprotein cholesterol level: a metaanalysis of population-based prospective studies. J Cardiovasc Risk. 3(2):213–219.
- Hu FB, Stampfer MJ, Haffner SM, Solomon CG, Willett WC, Manson JE. 2002. Elevated risk of cardiovascular disease prior to clinical diagnosis of type 2 diabetes. Diabetes Care. 25(7):1129–1134.
- Kurihara O, Takano M, Yamamoto M, Shirakabe A, Kimata N, Inami T, Kobayashi N, Munakata R, Murakami D, Inami S, et al. 2013. Impact of prediabetic status on coronary atherosclerosis: a multivessel angioscopic study. Diabetes Care. 36(3):729–733.
- Li N, Wang H, Yan Z, Yao X, Hong J, Zhou L. 2012. Ethnic disparities in the clustering of risk factors for cardiovascular disease among the Kazakh, Uygur, Mongolian and Han populations of Xinjiang: a cross-sectional study. BMC Public Health. 12:499.
- Lorbeer R, Empen K, Dörr M, Arndt M, Schipf S, Nauck M, Wallaschofski H, Felix SB, Völzke H. 2011. Association between glycosylated haemoglobin A1c and endothelial function in an adult non-diabetic population. Atherosclerosis. 217(2):358–363.
- Meadows TA, Bhatt DL, Cannon CP, Gersh BJ, Röther J, Goto S, Liau CS, Wilson PW, Salette G, Smith SC, et al. 2011. Ethnic differences in cardiovascular risks and mortality in atherothrombotic disease: insights from the reduction of atherothrombosis for continued health (REACH) registry. Mayo Clin Proc. 86(10):960–967.
- Miller G, Miller N. 1975. Plasma-high-density-lipoprotein concentration and development of ischaemic heart-disease. Lancet. 305(7897):16–19.
- Muntner P, He J, Chen J, Fonseca V, Whelton PK. 2004. Prevalence of non-traditional cardiovascular disease risk factors among persons with impaired fasting glucose, impaired glucose tolerance, diabetes, and the metabolic syndrome: analysis of the Third National Health and Nutrition Examination Survey (NHANES III). Ann Epidemiol. 14(9):686–695.
- Ok ES, Asci G, Kircelli F, Duman S, Dheir H, Demirci MS, Ozkahya M, Toz H, Ok E. 2012. Relationship between glucose exposure via peritoneal dialysis solutions and coronary artery calcification in non-diabetic peritoneal dialysis patients. Int Urol Nephrol. 44(6):1847–1853.
- Oliveira DS, Tannus LR, Matheus AS, Correa FH, Cobas R, Cunha EF, Gomes MB. 2007. Evaluation of cardiovascular risk according to Framingham criteria in patients with type 2 diabetes. Arq Bras Endocrinol Metabol. 51(2):268–274. Portuguese.
- Schinner S, Füth R, Kempf K, Martin S, Willenberg HS, Schott M, Dinh W, Scherbaum WA, Lankisch M. 2011. A progressive increase in cardiovascular risk assessed by coronary angiography in non-diabetic patients at sub-diabetic glucose levels. Cardiovasc Diabetol. 10(1):56.
- Tabak AG, Herder C, Rathmann W, Brunner EJ, Kivimaki M. 2012. Prediabetes: a high-risk state for diabetes development. Lancet. 379(9833):2279–2290.
- Tuso P. 2014. Prediabetes and lifestyle modification: time to prevent a preventable disease. Perm J. 18(3):88–93.
- Yan Q, Gu WQ, Hong J, Zhang YF, Su YX, Gui MH, Zhang Y, Chi ZN, Zhang YW, Li XY. 2009. Coronary angiographic studies of impaired glucose regulation and coronary artery disease in Chinese nondiabetic subjects. Endocrine. 36(3):457–463.