
Abstract
Dexamethasone administered by autologous red blood cells (RBCs) is used in clinical trials and as compassionate therapy to alleviate ataxia telangiectasia (AT) symptoms, providing long-term delivery of low doses of the drug. In the present paper, we report a dexamethasone-induced variation in gene expression that differed between healthy and AT primary fibroblasts simulating patient conditions. Gene expression levels were analysed by a microarray platform. The obtained gene-set data were used for biological pathway analysis by Reactome functional network clustering. Over 3000 probes were differentially modulated by dexamethasone in wild-type (WT) and AT fibroblasts. Consequently, the biological pathways induced by dexamethasone treatment also differed between the two samples. Some of the pathways were the same as those normally altered in AT compared to WT cells. Our results were consistent with earlier studies on HDAC4 and DDIT4 dynamics. The 30-day low dose dexamethasone treatment induced differential gene expression in AT and WT cells, leading to the partial recovery of genes that are usually dysregulated in AT. This is probably due to glucocorticoid receptor diversity in AT, which is likely genetically imprinted in AT, thus accounting for the differential response of AT cells to dexamethasone treatment.
Introduction
Ataxia telangiectasia (AT) is a rare severe genetic disease caused by the biallelic mutation of the ATM (ataxia telangiectasia mutated) gene, which codes for a large protein called ATM, a member of the PI3 kinase-like kinase (PIKK) family (Gatti et al. Citation1988; Abraham Citation2004). First discovered as a protein with nuclear functions, because it is activated after DNA damage (Bakkenist and Kastan Citation2003; Kozlov et al. Citation2006) modulating cell-cycle-checkpoint signaling (Abraham Citation2001), ATM also has defined functions as well as several other functions that are still under investigation in the cytoplasm (Yang and Kastan Citation2000; Alexander, Cai, et al. Citation2010; Alexander, Kim et al. Citation2010; Cam et al. Citation2010; Guo et al. Citation2010; Sharma et al. Citation2014; Zheng et al. Citation2019; Guo et al. Citation2020; Sarkar et al. Citation2020).
Subjects with AT are wheelchair dependent by the age of ten and show a varied phenotype, characterized by ataxia, oculocutaneous telangiectasias, immunodeficiency, proneness to cancer and respiratory infections (Gilad et al. Citation1998; Chun and Gatti Citation2004; Biton et al. Citation2008; Lavin Citation2008; van Os et al. Citation2017). No definitive cure is available for the pathology and supporting therapies are administered to care for patients. Nevertheless, several studies and clinical trials have shown that glucocorticoid administration in AT patients can improve their clinical outcome and quality of life (Buoni et al. Citation2006; Broccoletti et al. Citation2008; Zannolli et al. Citation2012; Chessa et al. Citation2014; Leuzzi et al. Citation2015). However, the mechanism of action of glucocorticoids in AT patients has only been partially elucidated; therefore, we have focused our research on investigating the effects of dexamethasone (dex) in both cellular models (Menotta et al. Citation2012; Menotta, Biagiotti, Bartolini, et al. Citation2017; Menotta, Orazi, et al. Citation2018; Ricci et al. Citation2020) and patients (Menotta, Biagiotti, Spapperi, et al. Citation2017; Leuzzi et al. Citation2018; Menotta, Biagiotti, et al. Citation2018). We had the opportunity to test whole blood gene expression variation in patients treated with autologous dexamethasone loaded RBCs (Chessa et al. Citation2014). Using this method, the loaded dexamethasone is slowly released into the bloodstream at a therapeutic dose, thus avoiding the glucocorticoid side-effects. The pharmacokinetic study on dexamethasone RBC administration release (Coker et al. Citation2018) was then assessed, showing that the circulating drug concentration ranged from approximately 3nM (one day after the infusion) to 50pM (three weeks after the infusion). In light of these findings, we decided to investigate whether a low dexamethasone concentration administered over a long period was able to alter gene expression in AT fibroblasts. In the present study, we investigated the genes that were altered by the treatment and their role in the cells using biological network analysis.
Materials and methods
Cell cultures
Primary fibroblasts WT AG09429, GM02673 (ATM+/+) and AT GM00648, AG04405, AG03058 (ATM -/-) from the Coriell Institute (Camden, NJ, USA) were used as cellular models. Cells were grown in MEM (Eagle formulation) supplemented with 2 mmol/l L-glutamine, 100 U/mL penicillin and 0.1 mg/mL streptomycin (Sigma-Aldrich), 10% or 15% of fetal bovine serum (depending on cell line, Thermo Fisher Scientific) and 5 mM glucose. All cells were incubated at 37°C with 5% CO2 and treated with 1nM dexamethasone every medium change (twice a week) for 30 days prior to RNA extraction. Two technical replicates were assessed for each cell line. Dimethylsulfoxide (DMSO) was used as the drug vehicle and thus was administered in untreated cells as a control.
Microarray analysis
Total RNA was extracted from all the investigated cell lines using the RNeasy kit plus (QIAGEN). Quality control of RNA was assayed by Nanodrop and Agilent Bioanalyzer-Tape Station (RIN >8). The labeling procedure was performed using the Affymetrix GeneChip WT Pico kit. Two ng of RNA was assessed, and the labeling was achieved as recommended by the manufacturer. Human Clariom D array chips from Affymetrix were used, and the procedures were carried out according to the manufacturer’s instructions. The GeneChip Scanner 3000 7G platform was used for data acquisition. The data analysis, after pre-processing at the probe level (CEL files), was performed by RMA background adjustment, using the quantile method for normalization and median polish for summarization. DEGs (differentially expressed genes) were selected by the Affymetrix TAC console for functional annotation using an FDR p-value ≤0.05 (Limma Bioconductor package).
Quantitative PCR
Some of the genes that were found to be modulated by dexamethasone were further investigated by qPCR. For this purpose, 500 ng of RNA were employed in each experiment to obtain cDNA by PrimeScript™ RT Master Mix (Takara). One ng of cDNA was employed in each TaqMan Gene Expression Assay (Thermo Fisher Scientific) for the FKBP5, HDAC4 and DDIT4 genes according to the manufacturer’s instructions. PPIC and PPIA gene expressions were used as housekeeping genes, averaging their expression by geometric mean (Vandesompele et al. Citation2002). Amplification plots were analysed using the ABI PRISM 7500 sequence detection system (Applied Biosystems) and the relative expression data were calculated by the ΔΔCt method (Winer et al. Citation1999; Pfaffl Citation2001) and represented as 1/2ΔCt.
Data analysis and functional networks
Statistical analyses and graph plotting were performed by GraphPad Prism. Statistical tests were chosen according to the sample size and variance homogeneity (parametric or non-parametric tests). The gene symbol lists resulting from the gene selection procedure and the matching gene expression values were used to compute functional networks by using the Reactome FI Functional Interaction Network plugin for Cytoscape (Wu et al. Citation2010). Biological processes (BP) and pathway enrichment of moduli were assessed by FDR p-value ≤0.01, while the whole network functions were computed using FDR ≤0.1.
Results
Basal differences between AT and WT cells
We have previously reported the effects of dexamethasone on whole blood gene expression in AT patients observing a basal difference between healthy and AT subjects. In the present investigation, we first assessed whether differences were also observable between untreated AT and WT fibroblasts. After the array analyses, 5995 probe sets (3835 gene symbols) were found to be differentially expressed between AT and WT fibroblasts. The gene symbol list and the matching fold changes are reported in Material S1a. WT cells showed 4137 upregulated and 1858 downregulated probe sets (2371 upregulated and 1464 downregulated gene symbols), compared to AT fibroblasts. In order to define their biological functions, Reactome FI clustering was performed. The functional network that was obtained is illustrated in Figure and all coupled biological processes, pathway enrichments of moduli and the whole network pathway enrichment are reported in Material S2.
Figure 1. Reactome FI network from gene symbols achieved comparing WT and AT fibroblasts in basal conditions. Numbers indicate the matching moduli order from the Reactome clustering procedure reported in Material S2. Red perimeters of the nodes indicate upregulated genes, while the green ones indicate downregulated genes.
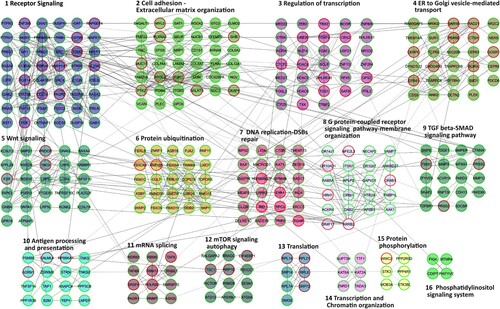
Sixteen pathways were found to be altered in AT fibroblasts compared to WT samples, including the DNA replication-DSB repair cluster and the mTOR signaling- autophagy cluster, two pathways that are known to be altered in AT cells and patients (Bakkenist and Kastan Citation2003; Kozlov et al. Citation2006; Alexander, Kim, et al. Citation2010; D’Assante et al. Citation2017; Choy and Watters Citation2018; Zheng et al. Citation2019), thus making our model biologically relevant. The other highlighted pathways were receptors and cell signaling; mRNA metabolism; phosphorylation; protein catabolism and chromatin dynamics.
Dexamethasone differentially alters gene expression in AT and WT cells
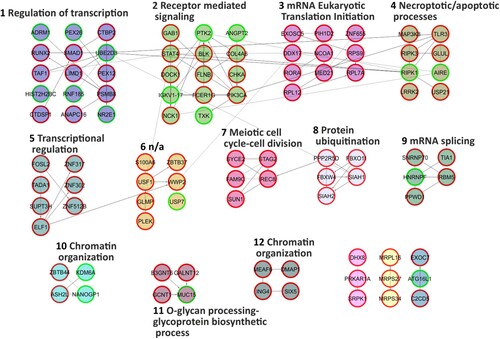
The 30-day low-dose dexamethasone treatment was able to alter the behaviour of the primary AT and WT fibroblasts used in the present study. As regards the AT samples, dexamethasone was able to alter the expression of 3021 probes after one month of treatment (Material S1b). There were 1215 upregulated and 703 downregulated genes. The effects of the dexamethasone were assessed by analysing the expression of the gene that is usually altered by the drug, namely FKBP5 (Menotta, Biagiotti, et al. Citation2018; Menotta, Orazi, et al. Citation2018). FKBP5 is one of the useful reporters and, in the analysed gene set it was also upregulated (F/C 3.15). FKBP5 expression was also validated by qPCR (Figure ). Two additional reporter genes that are used to gage the effects of dexamethasone are DUSP1 and TSC22D3, but in the current investigation they were not altered (data not shown). In WT treated samples, dexamethasone increased the expression of 1160 gene symbols, while 1308 genes were downregulated (Material S1c), and the reporter gene FKBP5 was congruently overexpressed (about 5 F/C in the array gene set) and was confirmed by qPCR (Figure ). The biological functions of the two gene sets were extrapolated using the Reactome FI clustering procedure. The obtained plotted functional networks are reported in Figures and respectively, while the biological processes and pathways of moduli with the whole network pathway enrichments are described in Material S3 and S4, respectively. Nine principal biological processes were controlled by dexamethasone in AT, while 12 processes were defined in WT. Of these processes, pathways involved in transcription, splicing, translation, receptor signaling and chromatin organization were controlled in both AT and WT. Signaling mediated by neurotransmitter, cytoskeleton and vesicle transport were exclusive pathways in AT treated samples, whereas processes involved in cell cycle, necrosis/apoptosis, glycoprotein and ubiquitination appeared to be WT specific pathways.
Figure 2. FKBP5 expression in AT and WT samples treated or not with dexamethasone. As illustrated, the drug was able to improve the gene expression in both samples (p < 0.05, Wilcoxon test).
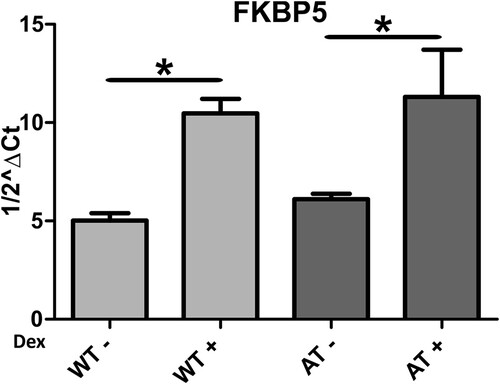
Figure 3. Reactome FI network from gene symbols achieved comparing AT-dex vs AT fibroblasts. Numbers indicate the matching moduli order from the Reactome clustering procedure reported in Material S3. Red perimeters of the nodes indicate upregulated genes, while the green ones indicate downregulated genes.
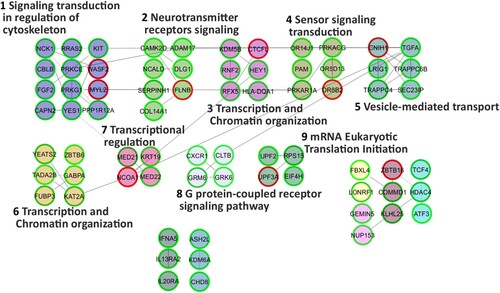
Figure 4. Reactome FI network from gene symbols achieved comparing WT-dex vs WT cells. Numbers indicate the matching moduli order from the Reactome clustering procedure reported in Material S4. Red perimeters of the nodes indicate upregulated genes, while the green ones indicate downregulated genes.
Gene-set and biological pathway comparisons
The comparisons of the three gene sets were subsequently carried out. Figure (a) shows the Venn diagram obtained by comparing all the gene symbols of the three samples. The output lists from the matching processes are reported in Material S5. A total of 3787 gene symbols were found to be differentially expressed between WT and AT fibroblasts, and 404 of those were modulated by dexamethasone in AT fibroblasts. Dexamethasone effects influenced the gene expression of both treated AT and WT cells (1898 and 2432 gene symbols respectively), but 1747 gene symbols in AT and 2281 in WT were specifically modulated, and only 151 gene symbols were mutually modified. These results show that dexamethasone alters gene expression according to cell genotype.
Figure 5. Venn diagram of data inferred from the three sample comparisons. In (a), the cross comparison of the three gene symbol datasets. The corresponding gene symbol lists are reported in Material S5. In (b), the cross comparison of the pathway enrichments of the moduli inferred from three data sets. The corresponding lists are reported in Material S6. In (c), the cross comparison of the pathway enrichments of the whole networks. The corresponding lists are reported in Material S7.
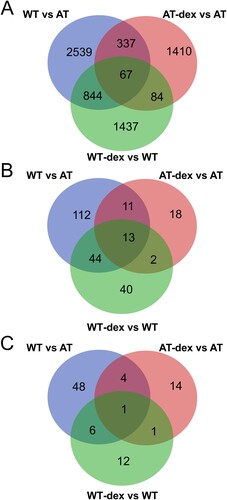
In addition, the functional pathways in moduli were compared in the investigated dataset. The intersection is illustrated in Figure (b) in a Venn diagram, while the detailed lists are reported in Material S6. Dexamethasone controlled 24 pathways in moduli out of the 180 that were altered in WT and AT fibroblasts. Furthermore, dexamethasone treatment induced different cellular responses because only 15 pathways in moduli were common to both treated WT and AT fibroblasts, and 29 pathways were specifically modulated by dexamethasone only in AT (Material S6). The latter are involved in biological processes, such as cytoskeleton modelling and vesicles, organelle transport, and cellular signaling, involving DAG-IP3 and P38-P53 axis.
Comparisons among the whole network pathway enrichments were also made. The resulting output is illustrated in a Venn diagram in Figure (c) and as lists in Material S7. Reflecting the gene symbols and pathways in moduli, the pathways in networks were also found to be dissimilar as basal behaviour between WT and AT fibroblasts. In fact, 59 pathways were altered, and dexamethasone action in AT fibroblasts specifically influenced four of them (extracellular matrix organization, pathways in cancer, proteoglycans in cancer, thromboxane A2 receptor signaling), while one pathway was also found in the WT-dex vs WT dataset (ErbB signaling pathway).
As mentioned above, the action of dexamethasone was likely dependent on genotype and therefore the retrieved pathways were also probably genotype dependent. Only two biological pathways were common to both dexamethasone treated groups, Chromatin organization and ErbB signaling pathway, two well-known dexamethasone modulated pathways in several cell lines (Dammann et al. Citation2006; Scheving et al. Citation2007).
HDAC4 is also overexpressed at low drug concentration
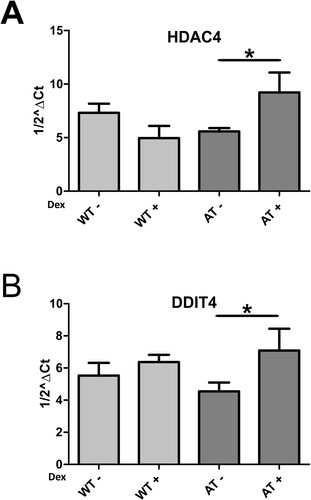
We recently reported a dexamethasone induced DDIT4 transcription mechanism mediated by HDAC4 in AT fibroblasts treated with 100nM dexamethasone. Furthermore, in all treated AT patients, HDAC4 expression was upregulated as it was in cells, while DDIT4 was upregulated only in some patients (Ricci et al. Citation2020). We investigated if these two target genes behaved in the same way in the experimental setup described herein. Using microarray analysis, we found that HDAC4 was upregulated after 30 days of low dose dexamethasone treatment, as previously demonstrated in AT fibroblasts treated with higher dexamethasone concentrations, while DDIT4 overexpression was not statistically significant. On the contrary, using qPCR assay, DDIT4 was found to be slightly overexpressed in AT samples, while the HDAC4 result was confirmed (Figure , p < 0.05 Wilcoxon test).
Figure 6. HDAC4 and DDIT4 gene expression assayed by qPCR in AT and WT samples treated or not with dexamethasone. As illustrated, the drug was able to increase the gene expression of the two targets in both samples (p < 0.05, Wilcoxon test).
Discussion
We have been investigating the effects of dexamethasone in AT patients and cells since glucocorticoid administration has been shown to have a positive impact on the quality of life of AT patients (Buoni et al. Citation2006; Broccoletti et al. Citation2008; Zannolli et al. Citation2012; Chessa et al. Citation2014; Leuzzi et al. Citation2015). The pharmacokinetics of dexamethasone administrated by autologous RBCs results, in a three to four weeks treatment, in the nano/pico molar range; hence, we decided to simulate these conditions in human primary WT and AT fibroblasts. Using microarray analysis, we found that 30 days of low dose dexamethasone treatment was also able to modulate gene expression in fibroblasts in vitro. As in our previous studies (Menotta, Biagiotti, et al. Citation2018; Menotta, Orazi, et al. Citation2018), a gene expression variation between untreated WT and AT was also found in the present report. Apparently, some differences stem from genetic variability, but others, such as the biological function ‘DSB repair processes’, which are well-known to be altered in AT (Bakkenist and Kastan Citation2003), depend on the lack of ATM, and we found that these processes differed between WT and AT samples that also showed differences in autophagy signaling, one of the compromised pathways in AT (D’Assante et al. Citation2017; Guo et al. Citation2020).
The administration of dexamethasone in cell cultures concomitant to medium change led to an oscillation of the drug concentration in the nano-pico molar range (due to dexamethasone availability by FBS scavenger effect and dexamethasone half-life) for 30 days in both WT and AT fibroblasts. The modification of gene expression was greater than expected. More than 3000 probes were altered in both models by dexamethasone, but in different ways. In fact, of the approximately 2000 gene symbols in each group, only 152 were found in both groups. The distinct molecular action of dexamethasone is presumably dependent on the genomic arrangement of the testers, which in turn, is dependent on ATM activity. Importantly, some of the deficient biological functions found in AT were dexamethasone regulated, and 11 of these functions were specifically modulated only in AT and not by the overall effect of the drug in cells. Vesicle transport, G-protein signaling and transcription are biological pathways that appeared to be dexamethasone recovered or regulated. The involvement of vesicle transport has been already described as glucocorticoid regulated by IL7 receptor recycling in AT patients (Prencipe et al. Citation2020). Moreover, we previously reported the effects of glucocorticoid on FKBP5 and DUSP1 gene expression in AT (Menotta, Biagiotti, Spapperi, et al. Citation2017; Menotta, Biagiotti, et al. Citation2018). Surprisingly, only FKBP5 expression was affected by the applied drug administration. The dexamethasone concentration was likely too low to induce the classical DUSP1 anti-inflammatory response, but high enough to induce the expression of the stress related gene FKBP5. This finding reinforces the hypothesis that glucocorticoid administration has multiple impacts on cells and organisms, with a range of biological outcomes that depend on glucocorticoid concentrations.
It is interesting to note that the ’Neurotransmitter signaling‘ pathway is specifically modulated in AT. The constituents of this modulus might help to explain the relationship between dexamethasone administration and the neurological improvements observed in AT patients. Clearly, the results reported herein only concern gene expression variation and linking those variations to biological pathway outcomes is certainly partially speculative. In fact, in the last few years it has been ascertained that the overall matching between mRNA and protein levels is less than expected (Schwanhausser et al. Citation2011; Wilhelm et al. Citation2014; Buccitelli and Selbach Citation2020; Freen-van Heeren et al. Citation2020). The main findings to emerge from the gene expression data are the differential outcomes of glucocorticoid treatment in the two tested cell lines and the possible effects on biochemical pathways.
The specificity of gene regulation in AT by dexamethasone can rely only on the lack of ATM and it is likely that the response depends on the plethora of ATM influenced pathways and signaling. The link between ATM signaling and glucocorticoid receptors is probably more complex than once thought (Yan et al. Citation2007). The effects of a low dose of dexamethasone for 30 days can probably trigger different events. Early on, direct dexamethasone action on glucocorticoid receptors or on other unknown mechanisms directly regulates gene expression. Further along in the treatment, effects may consist in genome re-arrangement induced by long term dexamethasone action on proteins involved in chromatin remodeling, thus regulating the accessibility of transcription factors by relaxing or not relaxing DNA scaffolds (Mitre-Aguilar et al. Citation2015; Grbesa and Hakim Citation2017). The genome re-arrangement in turn may depend on glucocorticoid receptor activity and organization (Paakinaho et al. Citation2019) leading to a combinatory puzzling outcome in regulating gene expression. All of the above-mentioned circumstances might contribute to the dexamethasone induced AT outcome described herein.
We have previously investigated short-term dexamethasone stimulation and the differential response of WT and AT cells to dexamethasone has already been observed (Menotta, Biagiotti, Bartolini, et al. Citation2017; Menotta, Orazi, et al. Citation2018; Ricci et al. Citation2020), and probably only the differential glucocorticoid receptor-ATM balance could trigger the outcome observed in the long-term glucocorticoid treated cells. Based on the findings reported herein, we can speculate that similar dexamethasone early–late modulation might also take place in vivo. It would be worthwhile to verify this hypothesis by monitoring patients during glucocorticoid treatment.
Among the short-term dexamethasone effects, the role of HDAC4-DDIT4 in autophagy has recently been described (Ricci et al. Citation2020); they were capable of inducing a slight autophagy flux improvement in AT fibroblasts. The examination of the expression of these two genes in the 30-day stimulated model revealed that they behaved in the same manner as mentioned above. Hence, the dexamethasone induced expression of some genes appears to be likely, even if different mechanisms of action on gene regulation coexist. The observation regarding the HDAC4-DDIT4 axis is important, and the reported findings reinforce the notion that dexamethasone can modulate this signaling even when it is administered at low concentrations for a long period, emulating the patient’s conditions during the EryDex administration where both genes behaved in the same way.
In conclusion, the treatment of the AT cellular model and WT cells with low concentrations of dexamethasone for 30 days is able to modulate gene expression and the variation between AT and WT fibroblasts was found to be distinguishable, thus providing further support for the concept of a specific dexamethasone function in AT fibroblasts. Direct and indirect mechanisms of action are probably triggered thanks to early and late dexamethasone treatment responses. Further studies performing whole proteomic investigations and integrating all types of data, transcriptomic and proteomic, may reveal exciting glucocorticoid biological action and could help to shed light on the molecular mechanisms of action of glucocorticoids in the AT pathology.
Supplemental Material
Download Zip (754.8 KB)Disclosure statement
Mauro Magnani holds stock ownership in EryDel S.p.A. None of the other authors have competing interests.
Data availability statement
All data and materials supporting the results presented in this paper are freely available in https://doi.org/10.17632/chywxb7wb7.1. Microarray raw data are under investigation for splicing analysis at the time of paper submission.
Additional information
Funding
Related Research Data
References
- Abraham RT. 2001. Cell cycle checkpoint signaling through the atm and atr kinases. Genes Dev. 15:2177–2196.
- Abraham RT. 2004. Pi 3-kinase related kinases: ‘big’ players in stress-induced signaling pathways. DNA Repair. 3:883–887.
- Alexander A, Cai SL, Kim J, Nanez A, Sahin M, MacLean KH, Inoki K, Guan KL, Shen J, Person MD, et al. 2010. Atm signals to tsc2 in the cytoplasm to regulate mtorc1 in response to ros. Proc Natl Acad Sci USA. 107:4153–4158.
- Alexander A, Kim J, Walker CL. 2010. Atm engages the tsc2/mtorc1 signaling node to regulate autophagy. Autophagy. 6:672–673.
- Bakkenist CJ, Kastan MB. 2003. DNA damage activates atm through intermolecular autophosphorylation and dimer dissociation. Nature. 421:499–506.
- Biton S, Barzilai A, Shiloh Y. 2008. The neurological phenotype of ataxia-telangiectasia: solving a persistent puzzle. DNA Repair. 7:1028–1038.
- Broccoletti T, Del Giudice E, Amorosi S, Russo I, Di Bonito M, Imperati F, Romano A, Pignata C. 2008. Steroid-induced improvement of neurological signs in ataxia-telangiectasia patients. Eur J Neurol. 15:223–228.
- Buccitelli C, Selbach M. 2020. Mrnas, proteins and the emerging principles of gene expression control. Nat Rev Genet. 21:630–644.
- Buoni S, Zannolli R, Sorrentino L, Fois A. 2006. Betamethasone and improvement of neurological symptoms in ataxia-telangiectasia. Arch Neurol. 63:1479–1482.
- Cam H, Easton JB, High A, Houghton PJ. 2010. Mtorc1 signaling under hypoxic conditions is controlled by atm-dependent phosphorylation of hif-1alpha. Mol Cell. 40:509–520.
- Chessa L, Leuzzi V, Plebani A, Soresina A, Micheli R, D’Agnano D, Venturi T, Molinaro A, Fazzi E, Marini M, et al. 2014. Intra-erythrocyte infusion of dexamethasone reduces neurological symptoms in ataxia teleangiectasia patients: results of a phase 2 trial. Orphanet. J. Rare. Dis. 9:5. doi: 10.1186/1750-1172-9-5.
- Choy KR, Watters DJ. 2018. Neurodegeneration in ataxia-telangiectasia: multiple roles of atm kinase in cellular homeostasis. Dev Dyn. 247:33–46.
- Chun HH, Gatti RA. 2004. Ataxia-telangiectasia, an evolving phenotype. DNA Repair. 3:1187–1196.
- Coker SA, Szczepiorkowski ZM, Siegel AH, Ferrari A, Mambrini G, Anand R, Hartman RD, Benatti L, Dumont LJ. 2018. A study of the pharmacokinetic properties and the in vivo kinetics of erythrocytes loaded with dexamethasone sodium phosphate in healthy volunteers. Transfus Med Rev. 32:102–110.
- Dammann CE, Nassimi N, Liu W, Nielsen HC. 2006. Erbb receptor regulation by dexamethasone in mouse type ii epithelial cells. Eur Respir J. 28:1117–1123.
- D’Assante R, Fusco A, Palamaro L, Polishchuk E, Polishchuk R, Bianchino G, Grieco V, Prencipe MR, Ballabio A, Pignata C. 2017. Abnormal cell-clearance and accumulation of autophagic vesicles in lymphocytes from patients affected with ataxia-teleangiectasia. Clin Immunol. 175:16–25.
- Freen-van Heeren JJ, Nicolet BP, Wolkers MC. 2020. Combined single-cell measurement of cytokine mrna and protein in immune cells. Methods Mol Biol. 2108:259–271.
- Gatti RA, Berkel I, Boder E, Braedt G, Charmley P, Concannon P, Ersoy F, Foroud T, Jaspers NG, Lange K, et al. 1988. Localization of an ataxia-telangiectasia gene to chromosome 11q22-23. Nature. 336:577–580.
- Gilad S, Chessa L, Khosravi R, Russell P, Galanty Y, Piane M, Gatti RA, Jorgensen TJ, Shiloh Y, Bar-Shira A. 1998. Genotype-phenotype relationships in ataxia-telangiectasia and variants. Am J Hum Genet. 62:551–561.
- Grbesa I, Hakim O. 2017. Genomic effects of glucocorticoids. Protoplasma. 254:1175–1185.
- Guo Z, Kozlov S, Lavin MF, Person MD, Paull TT. 2010. Atm activation by oxidative stress. Science. 330:517–521.
- Guo QQ, Wang SS, Zhang SS, Xu HD, Li XM, Guan Y, Yi F, Zhou TT, Jiang B, Bai N, et al. 2020. Atm-chk2-beclin 1 axis promotes autophagy to maintain ros homeostasis under oxidative stress. EMBO J. 39(10):e103111. doi:10.15252/embj.2019103111.
- Kozlov SV, Graham ME, Peng C, Chen P, Robinson PJ, Lavin MF. 2006. Involvement of novel autophosphorylation sites in atm activation. EMBO J. 25:3504–3514.
- Lavin MF. 2008. Ataxia-telangiectasia: from a rare disorder to a paradigm for cell signalling and cancer. Nat Rev Mol Cell Biol. 9:759–769.
- Leuzzi V, D’Agnano D, Menotta M, Caputi C, Chessa L, Magnani M. 2018. Ataxia-telangiectasia: A new remitting form with a peculiar transcriptome signature. Neurol Genet. 4(2):e228. doi: 10.1212/NXG.0000000000000228.
- Leuzzi V, Micheli R, D’Agnano D, Molinaro A, Venturi T, Plebani A, Soresina A, Marini M, Ferremi Leali P, Quinti I, et al. 2015. Positive effect of erythrocyte-delivered dexamethasone in ataxia-telangiectasia. Neurol – Neuroimmunol Neuroinflammation. 2(3):e98. doi: 10.1212/NXI.0000000000000098.
- Menotta M, Biagiotti S, Bartolini G, Marzia B, Orazi S, Germani A, Chessa L, Magnani M. 2017. Nano-mechanical characterization of ataxia telangiectasia cells treated with dexamethasone. Cell Biochem Biophys. 75:95–102.
- Menotta M, Biagiotti S, Bianchi M, Chessa L, Magnani M. 2012. Dexamethasone partially rescues ataxia telangiectasia-mutated (atm) deficiency in ataxia telangiectasia by promoting a shortened protein variant retaining kinase activity. J Biol Chem. 287:41352–41363.
- Menotta M, Biagiotti S, Orazi S, Rossi L, Chessa L, Leuzzi V, D’Agnano D, Plebani A, Soresina A, Magnani M. 2018. In vivo effects of dexamethasone on blood gene expression in ataxia telangiectasia. Mol Cell Biochem. 438:153–166.
- Menotta M, Biagiotti S, Spapperi C, Orazi S, Rossi L, Chessa L, Leuzzi V, D’Agnano D, Soresina A, Micheli R, et al. 2017. Atm splicing variants as biomarkers for low dose dexamethasone treatment of a-t. Orphanet J Rare Dis. 12(1):126. doi: 10.1186/s13023-017-0669-2.
- Menotta M, Orazi S, Gioacchini AM, Spapperi C, Ricci A, Chessa L, Magnani M. 2018. Proteomics and transcriptomics analyses of ataxia telangiectasia cells treated with dexamethasone. PloS One. 13(4):e0195388. doi: 10.1371/journal.pone.0195388.
- Mitre-Aguilar IB, Cabrera-Quintero AJ, Zentella-Dehesa A. 2015. Genomic and non-genomic effects of glucocorticoids: implications for breast cancer. Int J Clin Exp Pathol. 8:1–10.
- Paakinaho V, Johnson TA, Presman DM, Hager GL. 2019. Glucocorticoid receptor quaternary structure drives chromatin occupancy and transcriptional outcome. Genome Res. 29:1223–1234.
- Pfaffl MW. 2001. A new mathematical model for relative quantification in real-time rt-pcr. Nucleic Acids Res. 29(9):e45. doi: 10.1093/nar/29.9.e45.
- Prencipe R, Cirillo E, Giardino G, Gallo V, Menotta M, Magnani M, Barone MV, Palamaro L, Scalia G, Del Vecchio L, et al. 2020. In ataxia-telangiectasia, oral betamethasone administration ameliorates lymphocytes functionality through modulation of the il-7/il-7ralpha axis paralleling the neurological behavior: A comparative report of two cases. Immunol Investig. 50(2-3):295–303.
- Ricci A, Galluzzi L, Magnani M, Menotta M. 2020. Ddit4 gene expression is switched on by a new hdac4 function in ataxia telangiectasia. FASEB J. 34:1802–1818.
- Sarkar A, Stellrecht CM, Vangapandu HV, Ayres M, Kaipparettu BA, Park JH, Balakrishnan K, Burks JK, Pandita TK, Hittelman WN, et al. 2020. Ataxia telangiectasia mutated interacts with parkin and induces mitophagy independent of kinase activity. evidence from mantle cell lymphoma. Haematologica. 106(2):495–512.
- Scheving LA, Buchanan R, Krause MA, Zhang X, Stevenson MC, Russell WE. 2007. Dexamethasone modulates erbb tyrosine kinase expression and signaling through multiple and redundant mechanisms in cultured rat hepatocytes. Am J Physiol-Gastrointestinal Liver Physiol. 293:G552–G559.
- Schwanhausser B, Busse D, Li N, Dittmar G, Schuchhardt J, Wolf J, Chen W, Selbach M. 2011. Global quantification of mammalian gene expression control. Nature. 473:337–342.
- Sharma NK, Lebedeva M, Thomas T, Kovalenko OA, Stumpf JD, Shadel GS, Santos JH. 2014. Intrinsic mitochondrial DNA repair defects in ataxia telangiectasia. DNA Repair. 13:22–31.
- Vandesompele J, De Preter K, Pattyn F, Poppe B, Van Roy N, De Paepe A, Speleman F. 2002. Accurate normalization of real-time quantitative rt-pcr data by geometric averaging of multiple internal control genes. Genome Biol. 3(7):0034.1–0034.11. doi: 10.1186/gb-2002-3-7-research0034.
- van Os NJH, Jansen AFM, van Deuren M, Haraldsson A, van Driel NTM, Etzioni A, van der Flier M, Haaxma CA, Morio T, Rawat A, et al. 2017. Ataxia-telangiectasia: immunodeficiency and survival. Clin Immunol. 178:45–55.
- Wilhelm M, Schlegl J, Hahne H, Gholami AM, Lieberenz M, Savitski MM, Ziegler E, Butzmann L, Gessulat S, Marx H, et al. 2014. Mass-spectrometry-based draft of the human proteome. Nature. 509:582–587.
- Winer J, Jung CK, Shackel I, Williams PM. 1999. Development and validation of real-time quantitative reverse transcriptase-polymerase chain reaction for monitoring gene expression in cardiac myocytes in vitro. Anal.Biochem. 270:41–49.
- Wu G, Feng X, Stein L. 2010. A human functional protein interaction network and its application to cancer data analysis. Genome Biol. 11(5):R53. doi: 10.1186/gb-2010-11-5-r53.
- Yan M, Kuang X, Scofield VL, Shen J, Lynn WS, Wong PK. 2007. The glucocorticoid receptor is increased in atm-/- thymocytes and in atm-/- thymic lymphoma cells, and its nuclear translocation counteracts c-myc expression. Steroids. 72:415–421.
- Yang DQ, Kastan MB. 2000. Participation of atm in insulin signalling through phosphorylation of eif-4e-binding protein 1. Nat Cell Biol. 2:893–898.
- Zannolli R, Buoni S, Betti G, Salvucci S, Plebani A, Soresina A, Pietrogrande MC, Martino S, Leuzzi V, Finocchi A, et al. 2012. A randomized trial of oral betamethasone to reduce ataxia symptoms in ataxia telangiectasia. Mov Disord. 27:1312–1316.
- Zheng C, Zhou Y, Huang Y, Chen B, Wu M, Xie Y, Chen X, Sun M, Liu Y, Chen C, et al. 2019. Effect of atm on inflammatory response and autophagy in renal tubular epithelial cells in lps-induced septic aki. Exp Ther Med. 18:4707–4717.