
Abstract
A communal disease of the breast is breast cancer which happens mainly in women. Breast cancer is the most common cancer in women in both the developed and less developed world. The potential biological aggressiveness and behavior of breast neoplasm are of prognostic significance in tumor pathology and this can be assessed by measuring the tumor proliferative activity and malignant transformation. One of such markers is AgNOR (Argyrophilic Nuclear Organizer Region). A search of database sites such as PUBMED, Google Scholar, and Web of Science, as well as, other sources of literature available across public libraries was conducted to obtain information related to the topic. This review has presented a critical discussion on histologically assessing the proliferative activity of various grades and types of breast carcinoma using AgNOR expression and its prognostic significance. This exposé is anticipated to enlighten research scientists on specific management and assessing targets of tumors, which may merit prospective research into developing an appropriate mechanism for assessing the proliferative activity of breast cancer to help solve medical issues relating to cancers.
Introduction
Background
Papers by the Canadian Cancer Society, Centers for Disease Control and Prevention (CDC) and Shier et al. (Citation2012) records that breast is found in both men and women but women have more breast tissues than men and each breast lie over a muscle of the chest called pectoral major muscle. The breast extends from the second rib or collar bone to the sixth rib or armpit respectively and from the sternum to the axillae (Shier et al. Citation2012).
A common disease of the breast is breast cancer which occurs mainly in women but Zografos et al. published in 2004 a study which states, that male breast carcinomas do exist although it is an uncommon disease. Other researchers have also concluded that male breast cancers display distinct immunophenotypic differences from female breast carcinoma implying different pathogenesis in the evaluation and progression of the disease. These researchers hold the belief that the differences may play keys roles in therapeutic management, warranting different treatment strategies in comparison to female carcinoma.
Literature published by Ferlay, in 2010 accounts that 50% of breast cancer cases and 58% of deaths due to breast cancer occurs in the less developed countries although breast cancer is thought to be a disease of the developed world.
The etiology of human breast cancer remains largely unknown, however, risk factors to the development of breast cancer can be grouped into three broad determinants: family history (hereditary factors), hormonal and reproductive factors, and environmental (including lifestyle) factors. A recent epidemiologic analysis concludes that 73% of breast cancers are attributable to environmental factors (Lichtensteinet al. Citation2000).
The potential biological aggressiveness and behavior of breast neoplasm are of prognostic significance in tumor pathology and this can be assessed by measuring the tumor proliferative activity and malignant transformation. Because the tumor mass growth rate is one of the most important factors influencing the clinical outcome of cancer and faster growth is suggested to explain the worse prognosis of cancers (Derenzini et al. Citation1990), several proliferative markers have been developed to access proliferative index and for that matter aggressiveness and grade of the tumor as well as the survival chances of breast cancer patients. One of such markers is AgNOR (Argyrophilic Nuclear Organizer Region) introduced into the tumor pathology in 1986 by Ploton et al., who noted that AgNORs were more abundant in malignant cells than in benign neoplastic cells and was also used initially as a parameter for the diagnosis of malignancy. This technique involves silver staining of a peculiar group of highly argyrophilic acidic proteins present in Nuclear Organizer Regions (NORs), thus allowing NORs to be clearly and selectively visualized at the light microscopic level by specific silver nitrate staining procedure (Derenzini and Ploton Citation1991).
This procedure has been the most preferred and is used by many pathologists because it can be applied to both formalin-fixed, paraffin-embedded tissue and cytological specimens thus have a potential advantage over immunohistochemical techniques like Ki67 where frozen or specially stored tissues are needed (Rüschoff et al. Citation1990). Immunohistochemistry techniques, for example, are restricted in usage due to their high cost (transportation involved in AgNOR method, is cheaper compared to other techniques) and the difficulties associated with obtaining, importing, and storing the antibodies needed for use in less developed countries. In addition, a technique like the thymidine labelling index and others have a methodologically complex process. The technique requires metabolically viable and active (fresh) tissues, so archival tissue blocks could not be used. As a result, AgNOR has been suggested as an alternative tumor proliferation metric (Khan et al. Citation2006). Also, the NOR-associated proteins have a longer half-life than other nuclear markers such as PCNA and Ki-67 (Ploton et al. Citation1986). There are several others such as Mitotic Activity Index, Positron emission tomography, and Thymidine Labeling Index which are of limited application due to certain challenges associated with their use in less developed countries.
Assessing the proliferative index of breast cancer using the AgNOR staining technique as an alternative to other proliferative index markers that have limited application in less developed countries and correlate the proliferative activity to a grade of different breast cancer types.
There are numerous proliferative index markers for breast cancer however their application in less developed countries is limited due to several challenges associated with their use. For example, immunohistochemistry techniques are of limited use due to the expensive nature of this method and the difficulties that are associated with obtaining, importing, and storing the antibodies necessary for use (Wojnar et al. Citation2010) in less developed countries. Also considering a technique like a thymidine labeling index comparatively has a methodologically cumbersome procedure requiring metabolically viable and active (fresh). Again, due to the use of radioisotopes which is poisonous and hazardous, it poses a certain degree of risk to the histopathologist. A limitation of mitotic activity index another technique is the difficulty in identification of mitotic cells due to confusion with apoptosis or nuclear pyknosis (where there is irreversible condensation of chromatin in the nucleus of a cell undergoing necrosis) (Beresford et al. Citation2006). The above-stated challenges make it expedient to employ an alternative procedure that is free of such challenges and cost-effective as detailed above to assess the proliferative activity of breast cancer. AgNOR quantity strictly correlates with the proliferative activity of breast carcinoma and can therefore be used to predict the behavior of breast cancers. This research hoped to focus on the review on histologically assessing the proliferative activity of various grades and types of breast carcinoma using AgNOR expression and its prognostic significance.
Overview of breast cancer
The anatomy of breast
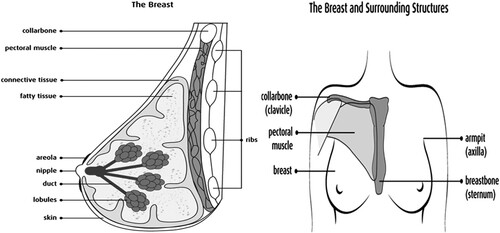
Papers by Centers for Disease Control and Prevention (Citation2013) and Shier et al. (Citation2012) records that breast is found in both men and women but women have more breast tissues than men and each breast lies over a muscle of the chest called pectoral major muscle. The breast extends from the second rib or collar bone to the sixth rib or armpit respectively and from the sternum to the axillae (Shier et al. Citation2012). The breast is made up of a nipple at the center of the areola (a pink or brown, circular area that contains small sweat glands that secret or release moisture as lubricants during breastfeeding). The areola is located near the tip of each breast at about the level of the fourth intercostal space (Figure ). It is from the nipple that milk comes out. Other structures include lobules – glands that produce milk, ducts – tubes that carry milk from lobules to the nipple, fatty tissues, and connective tissue which also surrounds and protect ducts and lobules and gives shape to the breast (Figure ).
Figure 1. Schematic diagram showing the anatomy of the breast.
Breast cancer
According to CDC, Citation2013 cancer is a disease in which cells of the body grow out of control. Cancerous cells can grow in any part of the body including the colon or the large intestine of the gastrointestinal tract, prostate gland of the male reproductive, lungs, or the urinary bladder. When cancers start in the breast, it is called breast cancer, (CDC Citation2013). Breast cancer occurs mainly in women but Zografos et al. (Citation2004) published a work which states that; male breast carcinomas do exist although it is an uncommon disease. Other researchers like Coles et al. (Citation1992) have also concluded that; male breast cancers display distinct immunophenotypic differences from female breast carcinoma implying different pathogenesis in the evaluation and progression of the disease. These researchers hold the belief that the differences may play keys roles in therapeutic management, warranting different treatment strategies in comparison to female carcinoma.
The very first clinical presentations or manifestations of breast cancer are a lump in the breast as recorded by the Canadian Cancer Society (Citation2009). This lump is present at all times, does not get smaller or disappear during menstruation. It also feels like it is attached to the skin and appears to be hard, irregular in shape, and very different from the rest of the breast tissue. Other changes occur in the skin and nipples. These changes associated with breast cancer include thickening and dimpling of the skin are referred to as orange peel skin or peau d’orange. Redness, swelling, and increased warmth may be a sign of inflammatory breast cancer. Some individual’s nipples are always pointed inward or invented (de Azambuja et al. Citation2007).
Epidemiology/incidence of breast cancer
The most common cancer in women in both the developed and less developed world is breast cancer. Research conducted by Soerjomataram shows that in 2012 alone over 508,000 died of breast cancer worldwide (Soerjomataram et al. Citation2012). Literature published by Ferlay et al., in 2010 accounts that 50% of breast cancer cases and 58% of deaths due to breast cancer occurs in the less developed countries although breast cancer is thought to be a disease of the developedworld.
The incidence and survival rates of breast cancer vary greatly worldwide. This variation is from 19.3 per 100,000 women in Eastern Africa to 89.7 per 100,000 women in Western Europe, (Ferlay et al. Citation2010). The breast cancer incidence appears to be significantly lower in Eastern Africa with approximately 18,000 new cases and a corresponding 1000 deaths during the same year compared to Western Europe where the incidence is five times higher than that in West Africa (Ferlay et al. Citation2010). In most of the developing regions or countries, the incidence rates are below 40 per 100,000 (Ferlay et al. Citation2010). Breast cancer survival rates range from below 40% in low-income countries, about 60% in middle-income countries to 80% or more in North America, Sweden, and Japan (Coleman et al. Citation2008). The key thing is breast cancer is the major type of cancer in women worldwide and is increasing particularly in developing countries where the majority of cases are diagnosed in latestages.
The mean age at presentation of breast cancer varies between Africa and Europe. Research conducted in two countries, Nigeria and Tanzania, revealed that the mean age is 48 years in Africa and approximately two-thirds are premenopausal. On the contrary, the presentation of breast cancer in the majority of women in Europe is during post-menopause (Lichtenstein et al. Citation2000). A study conducted by Clegg-Lamptey and Hodasi in 2007 at Korle Bu Teaching Hospital shows that breast cancer affects a relatively young population in Ghana with the majority of the affected individuals in the fifth decade (40–49 years). This study confirms the works of the above-mentioned researchers that the occurrence of breast cancer in Ghana and for that matter, Africa is about a decade earlier than in Caucasians (Clegg-Lamptey and Hodasi Citation2007).
Breast cancer genes (BRCA1 and BRCA2)
Breast cancer susceptibility genes 1 and 2 are tumor suppressor genes, and their mutation is associated with an increased risk of developing breast cancer (Petrucelli et al. Citation2013). Research has suggested that the age of onset of breast cancer tends to be younger in BRCA1 mutation carriers than BRCA2 mutation carriers (Coles et al. Citation1992). Together, mutations of BRCA 1 and 2 account for 20–25% of hereditary breast cancer (Largillier et al. Citation2008) and 10–15% of all breast cancer (Goldman and Hatch Citation2000). Both BRCA1 and BRCA2 are found on chromosome numbers 17 and 13 respectively.
Clinical relevance of cell proliferation assessment in breast pathology
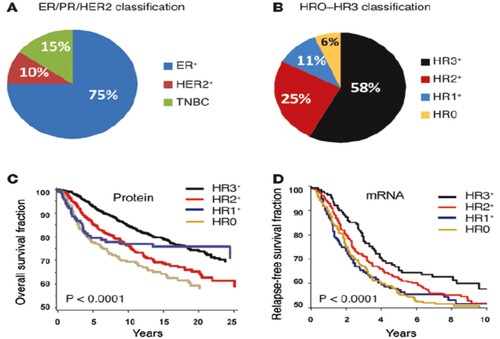
Breast cancer can be mainly classified into traditional and molecular forms. The molecular forms are the HER 2, Basal, claudin-low, luminal A, and Luminal B types. In balancing between classic morphology and molecular classification there is no morphology against molecular but personalized medicine is based on a combined morphological molecular pathology report including classical morphology and diverse molecular analyses (Kennecke et al. Citation2010). ER, PR, and HER2 status are the major drivers of clinical decision-making regarding the type of systemic therapy (Kennecke et al. Citation2010). These 3 biomarkers in conjunction with histologic grade/mitotic count could be used to infer luminal, HER2, and TN subtypes. Clinicians are increasingly thinking about breast cancers by their molecular subtype (Largillier et al.Citation2008).
Gene expression profile classification revealed a heterogeneous group of breast malignancies. These include basal-like (EGFR and/or CK5/6 and /or CK14 and/or PCad); claudin-low (low/absent expression of adhesion molecules); molecular apocrine; and other intrinsic molecular subtypes.
Examination of 3,157 human breast tumors (Figure ) also revealed that these HR subtypes were distinct from the current classification scheme, which is based on ER, PR, and HER2 (Santagata et al. Citation2014). Patient outcomes were best when tumors expressed all three hormone receptors (HR3) and worst when they expressed none (HR0).
Figure 2. HR subtypes being distinct from the current classification scheme, which is based on ER, PR, and HER2. Reproduced with permission from Santagata et al. Citation2014. Copyright 2014.
The progressive breast cancer (ABC) with luminal is usually considered by a favorable outcome, though the general prognosis seems currently unpredictable, reflecting the biological heterogeneity of such disease (Lobbezoo et al. Citation2013; Ades et al. Citation2014; Bonotto et al. Citation2014; Cardoso et al. Citation2014). Therefore, the identification of prognostic factors for luminal ABC represents a relevant aspect of clinical practice to select appropriate treatment strategies. Hormonal therapy signifies the treatment breakthrough for luminal ABC, while hormonal maintenance is considered one of the opportunities most commonly adopted in the context of clinical practice, although the absence of reliable evidence not establishing the magnitude of such approach in terms of patients’ benefit (Kloke et al. Citation1999; Montemurro et al. Citation2002; Dufresne et al.Citation2008).
Basic AgNOR principles
The NORs (nucleolus organizer regions) are nuclear components; AgNORs are a group of argyrophilic proteins that have been selectively dyed with silver staining and can be easily recognized as dark brown or black spots in the nuclear field. These regions correspond to DNA loops that contain genes responsible for ribosome RNA transcription and signal the end of mitosis, thereby estimating the rate of cell growth (Harmelin et al. Citation1995; Trerè Citation2000).
Several studies have found a connection between mean AgNOR score, and DNA ploidy (content), tumor grade, and the SPF on flow cytometry (Mourad et al. Citation1992), as well as Ki-67 staining and PCNA, and has thus been proposed as an alternative measure of tumor multiplication.
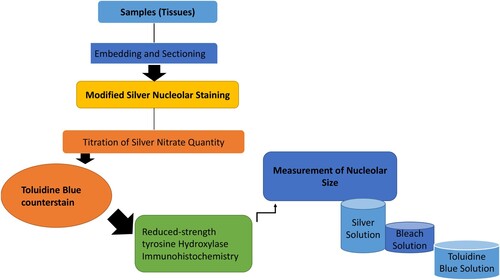
The argyrophilic proteins (AgNOR) staining protocol is mostly modified to stain nucleoli in thick sections prepared for stereological evaluation of tissue. Nucleoli appeared as black dots against a pale amber background. Tissue sections are usually counterstained with Toluidine Blue, or reduced-strength Tyrosine Hydroxylase immunohistochemistry to facilitate visualization of basic cellular morphology and regional nucleus identification. Here, we presented a modified method for nucleolar staining in free-floating thick sections of tissue embedded in a gelatin matrix. The procedure includes incubation in HCl to denature the DNA, a bleaching step to reduce non-specific background silver staining, and counterstaining with Toluidine Blue or reduced-strength tyrosine hydroxylase immunohistochemistry (see Figure ). Haematoxylin and eosin (H&E) staining of nuclei by oxidized haematoxylin (haematin) by mordant (chelate) bonds of metals such as aluminum, accompanied by counter-staining with eosin dye, which colors the different tissue fibres and cytoplasm in varying shades during the evaluation of various breast carcinoma using AgNOR method (Darkwah et al.Citation2018).
Figure 3. Schematic diagram demonstrating the basic principles of AgNOR method.
AgNOR as a measure of proliferative of breast cancer
Within the nucleus specifically, nucleoli of proliferating cells are certain nucleolar proteins that have a high affinity for silver (argyrophilic) and therefore can selectively be stained by silver methods. These nucleolar components containing a set of argyrophilic proteins are collectively termed as Nucleolar Organizer Regions (NORs) (Trerè Citation2000). NORs are also described in certain papers as loops of DNA that are responsible for ribosomal RNA (rRNA) transcription. They are located in the nucleoli of cells and the chromosomes 13–15 and 21, 22 in association with proteins, (Sivridis and Sims Citation1990). During the interphase of the cell cycle, NORs are located in both fibrillar centers and the closely associated dense fibrillar components of the nucleolus (Bourgeois et al. Citation1979; Hernandez-Verdun et al. Citation1980). These structures contain all the necessary components of rRNA synthesis and are the site where the transcription of ribosomal genes occurs (Derenzini et al. Citation1990).
As rRNA molecules are the main sites of protein synthesis, it follows that the number of NORs in each cell nucleus reflects cellular activity (Crocker et al. Citation1988). A peculiar group of highly argyrophilic acidic proteins is present in NORs, thus allowing NORs to be clearly and selectively visualized at the light microscopic level by a specific silver nitrate staining procedure (Derenzini and Ploton Citation1991).
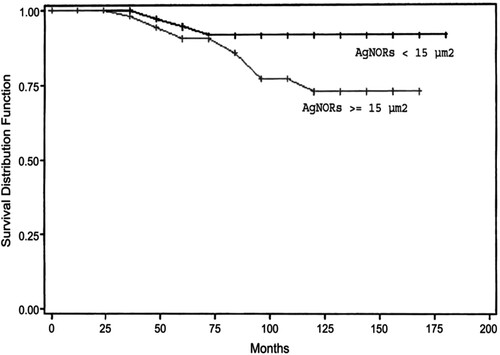
When the NORs are silver-stained, the NORs can easily be detected or identified as black dots exclusively localized throughout the nucleolar area and are also called Argyrophilic nucleolar organizer regions,(AgNORs) (Trerè Citation2000). The number and size of AgNORs can be assessed following staining of tissues or cells with silver stains (Beresford et al. Citation2006). The quantity of the silver-stained nucleolar proteins (AgNOR proteins) measured in cytohistologic preparations is related to the rapidity of cell proliferation (Derenzini and Ploton Citation1991). AgNORs are correlated with the proliferative activity of neoplasms. Increased AgNOR counts may reflect the increased proliferative activity of cells (Mourad et al. Citation1992; Dasgupta et al. Citation1997). Recent research on AgNOR analysis (Figure ) justifies that there is a strict correlation between AgNOR quantity and tumor cell doubling or proliferation AgNOR (Pich et al. Citation1995). It is also known that AgNOR counts in cancer cells are higher than in normal or hyperplastic cells (Ogura et al. Citation1992; Ploton et al. Citation1992). Black dot can be identified with argyrophilic proteins associated with AgNOR. When different cases were reviewed by different researchers, it was observed that breast neoplasm had a higher number of black dots than the normal breast, where only one or two black dots were obtained.
Figure 4. Overall survival and global AgNORs (cutoff 15 m2). Reproduced with permission from Abboud et al. Citation2008. Copyright 2008. Mosby, Inc.
AgNOR as a measure of proliferative of other cancers
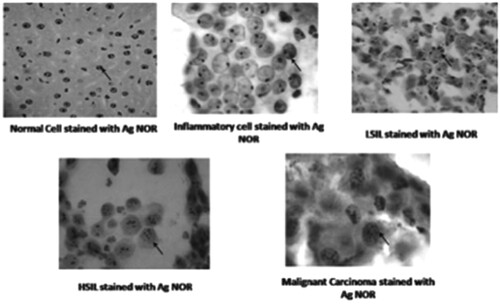
The transmissible venereal tumor (TVT) is a naturally occurring infectious neoplasm that has been identified in dogs (Das and Das Citation2000; Nak et al. Citation2005; Albanese et al. Citation2006; Gangul et al. Citation2013). The TVT is spread by implanting viable tumor cells in injured mucosal tissue, and the clinical expression is determined by the host’s immune status (Albanese et al. Citation2006). Reis Filho and colleagues (Reis Filho et al. Citation2020) used the cytochemical AgNOR method to assess cell proliferation rates and chemotherapy response, which were associated with the cytomorphological classification of TVT. The results of the 22 cases in the study revealed that TVT was found more commonly in female, adult, and mixed-breed dogs. Plasmocytoid tumors needed more vincristine sulfate sessions, had higher cell proliferation, and were the most chemotherapy resistant, necessitating additional doxorubicin treatment. Furthermore, increased NOR counts are linked to plasmocytoid cells, implying faster proliferation. Gastrointestinal tumors (Lakshmi et al. Citation1993; Srivastava et al. Citation2013; Lavenir et al. Citation2019), renal carcinoma (Suresh et al. Citation1990), urothelial carcinoma, lung carcinoma, central nervous system tumors, and salivary tumors have all been studied using AgNOR staining techniques (Yang et al. Citation1990; Kinoshita et al. Citation2012; Ahmad et al. Citation2019). Mohanty and Padhy Citation2020 used AgNOR in the diagnosis of cervical carcinoma, and investigated the relationship between AgNOR counts, and the incidence and prognosis of cervical lesions. The number of AgNOR cells in single dots increased with the severity of the disease in this study. The mean cell counts of single dots increased with the severity of the disease in mild, inflammatory, LSIL, HSIL, and invasive cases (see Figure ; Mohanty and Padhy Citation2020).
Figure 5. Different cell types stained with AgNOR. Reproduced with permission from Mohanty and Padhy Citation2020, Springer.
Breast cancer grade and AgNOR counts
Various studies have positively correlated meanAgNOR counts with higher histological grading (Sharma et al. Citation2011). Research conducted by Sharma et al in 2011 using 40 specimens of breast cancer out of which 12 cases were Grade II and 28 cases were of Grade III revealed that mean AgNOR counts increase with an increase in grade of breast cancer or carcinoma. From the research, it was found that the mean AgNOR count for grade II tumor was 3.39 ± 0.79 and the mean AgNOR count for grade III tumor was 4.28 ± 01.07. It could therefore be concluded from the results that, there is a significant positive correlation between AgNOR count and the histological grade of breast cancer. A similar study conducted by Khan et al in 2006 also correlated tumor grade and AgNOR count. Table below shows the results of the study conducted by Khan et al. (Citation2006) From the table, one could infer that grade II tumor had a mean ± SD AgNOR count of 8.16 ± 2.50 and grade III tumor had a mean ± SD AgNOR count of 10.06 ± 1.39. This study also confirms that high tumor grade is positively correlated with AgNOR count.
Table 1. Comparison of the grades of tumors with AgNOR count (Khan et al. Citation2006).
Prognostic value of AgNOR analysis in breast cancer
The tumor proliferative activity is considered to be a good prognosis factor, and it is necessary to determine this because it reflects the potential biological aggressiveness and behavior of the neoplasm (Ogura et al. Citation1992). Some studies have demonstrated that quantitative analysis of AgNORs yields a prognostic factor in breast cancer (Rzymowska, Citation1997). In vitro and in vivo studies shows that AgNORs are directly related to the ribosome biogenesis rate, which in proliferating cells is tightly related to the length of the cell cycle. The shorter the cell cycle, the greater the synthesis of rRNA for each time unit and, therefore, the number of AgNORs present in the nucleolus. Thus, the AgNOR value was thought to be a measure of the rate of cell proliferation (Derenzini et al. Citation1990). Because the tumor mass growth rate is one of the most important factors influencing the clinical outcome of cancer, faster growth was suggested to explain the worse prognosis of cancers with high AgNOR values compared with cancers with low AgNOR values (Derenzini et al. Citation1990). AgNOR is increasingly applied in histopathology research following suggestions that there may be a possible association between high AgNOR counts and malignant transformation (Ploton et al. Citation1986; Fallowfield et al. Citation1988). It is interesting to hypothesize, therefore, that the numbers, the shape, and the distribution of AgNORs within the nucleus might be of potential use in predicting behavior in breast carcinomas. The importance of the prognosis significance has been the subject of only a few studies (Crocker et al. Citation1988; Sinn et al. Citation1989; Rüschoff et al. Citation1990), two of which AgNOR and breast cancer demonstrated the influence on survival in human tumors; but recently Crocker et al. (Citation1988) and Trerè and Pession (Citation1989) demonstrated that the number of AgNOR dots in one cell is an excellent index for the measurement of cell proliferation. In the same way, NOR staining with silver could also potentially appear as a prognosis index.
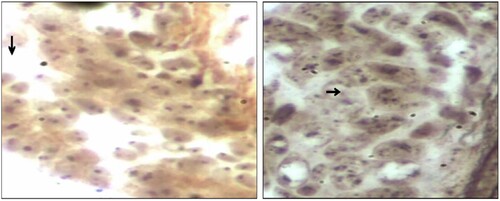
Abboud and coworkers designed an experiment to evaluate a cell proliferation marker, including the percentage of cycling cells (MIB1), and the duration of the cell cycle (assessed by argyrophilic nucleolar organizer regions proteins [AgNORs] measurement). According to Abboud et al. (Citation2008) proliferation index (PI) was correlated to overall survival (OS). For disease-free survival (DFS), it conserved its high prognostic value only in univariate analysis. The global amount of AgNORs was more discriminative for DFS. PI and AgNOR quantification supplied additional prognosis information in node-negative patients, and Abboud and the group proposed to integrate them in further studies (Abboud et al. Citation2008). Also, Darkwah et al. (Citation2018) assessed the proliferative index in different grades of invasive ductal carcinoma (IDC) by using AgNOR as a marker (Figure ). Darkwah et al. (Citation2018) concluded that the mean AgNOR count (mAgNOR) and proliferative index, (pAgNOR, percentage of cells with ≥5 AgNOR dots per nucleus), significantly increased with increasing grade of IDC. The mAgNOR and pAgNOR were low in normal breast, (at p-value less than 0.05). There was no significant difference in the mAgNOR and pAgNOR score for counting 50 and 100 cells (at a p-value of 0.01). mAgNOR and pAgNOR increase with an increase in grade of IDC and hence can be used to assess the proliferative index of IDC (Darkwah et al. Citation2018).
Figure 6. Photomicrographs of breast tissues stained with silver nitrate showing AgNOR dots for AgNOR dots for Normal breast tissue with most cells showing single AgNOR dots and Grade 3 IDC with most cells having 5 or more AgNOR dots. (Arrow). (Images were taken under × 40 objective lens with Nikon Eclipse E2000 microscope). Reproduced with permission from Darkwah et al. Citation2018. Copyright 2018. Elsevier.
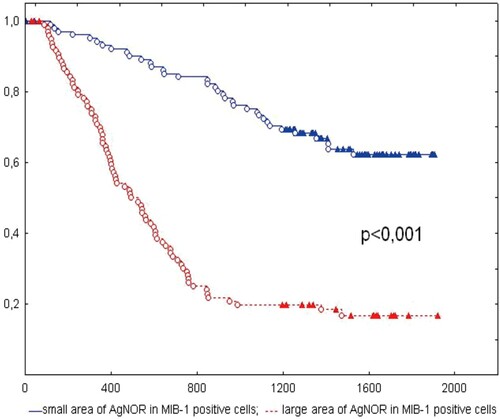
Accordingly, Kobylakov and the research team (Kobylakov et al. Citation2014) evaluated the relationship between argyrophilic nucleolar organizer region(AgNOR)-associated proteins and clinicopathological parameters and survival in non-small-cell lung cancer (NSCLC) (Figure ). In conclusion, the AgNOR area in MIB-1-positive cells is related to clinicopathological parameters and survival in NSCLC (Figure ). Argyrophilic nucleolar organizer region (AgNOR); MIB-1; survival; non-small cell lung cancer (NSCLC) (Kobylakov et al. Citation2014). Winzer et al. (Citation2013) also researched on a long-term analysis was carried out regarding overall survival employing automated microscopic image analysis of the nucleolar organizer regions (AgNORs) to objectify tumor grading in the case of breast carcinoma. In this experiment, it was revealed that there is a strong correlation between survival and selected AgNOR parameters. These could replace the conventional grading as the standard measure for the mitosis rate together with the pleomorphism level. Instead of the time-consuming AMBA/R system originally used, a new implementation of AgNOR quantification with modern VM systems could be applied (Öfner et al. Citation1996; Krüger et al. Citation2000; Winzer et al. Citation2013).
Figure 7. Kaplan-Meier curve of patients with NSCLC with small and large AgNOR areas in MIB-1-positive cells. The X-axis shows the time of life (in days); Y-axis shows the proportion of surviving patients. NSCLC, non-small-cell lung cancer; AgNOR, argyrophilic nucleolar organizer region. Reproduced with permission from Kobylakov et al. Citation2014. Copyright 2014. Cancer Biology & Medicine.
Other proliferative markers
Various methods are available for the measurement of proliferation rates in breast cancers, including mitotic counts, estimation of the fraction of cells in the S-phase of the cell cycle, and immunohistochemistry of proliferation-associated antigens. However, AgNOR is the method of choice for this study due to several limitations associated with the aforementioned technique. The principles, advantages, and limitations of the aforementioned techniques are briefly discussed.
Mitotic activity index
There are several published articles on this technique as a measure of the proliferative activity of breast cancer. This is a simple technique that is based upon the principle of the cell cycle. Cellular proliferation involves several defined phases and the characteristic appearance of the chromosome during the M-phase allows mitotic figures to be distinguished. Chromosome aggregations during any of the stages of mitosis (mitotic figures) are used to detect which fractions of cells are in mitosis at any given time. Proliferation was first measured by counting mitotic bodies on paraffin-embedded tumor specimens stained using hematoxylin–eosin and viewed by microscopy. The standard way of expressing the mitotic activity has been the number of mitotic bodies or figures per high power field of view (HPF). Traditionally, mitotic activity index (Table ) is scored on glass slides using light microscopy where mitotic figures or mitosis is counted in 10 high power fields (40× magnification) or per unit area (2 mm) in the most active part of the tumor (Lehr et al. Citation1999). The quantification of mitotic figures in a histopathologic specimen is an indirect measure of cell proliferation and is easier to perform than AgNOR and Ki-67 assessment, which both require additional staining techniques and may necessitate the use of automated image analysis that is not currently widely available (Kuntz et al. Citation1997; Biesterfeld and Reitmaier Citation2001; Sarli et al. Citation2002; Volante et al. Citation2004).
Table 2. Summary of some selected proliferative markers of breast cancer.
One problem with this method is that it can be difficult to identify mitotic cells due to confusion with apoptosis or nuclear pyknosis (where there is irreversible condensation of chromatin in the nucleus of a cell undergoing necrosis) (Beresford et al. Citation2006). A further criticism of mitotic index as a measure of proliferation is that the duration of the mitotic phase of the cell cycle is variable, and hence the correlation of the number of mitoses and proliferation rate is not necessarily linear (van Diest et al. Citation2004).
S-phase
The measurement of the fraction of cells engaged in chromosomal DNA synthesis the S-phase fraction (SPF) has become one of the standard methods of assessing proliferation (Table ). This method required the use of a metabolically viable specimen (fresh tissue) that has been incubated with the DNA precursor, usually under high-pressure oxygen conditions (to improve penetration to the tissue fragments) in an in vitro culture system. The initial method of measuring SPF was by measuring the tritiated thymidine (3HTdR) labeling index (LI) (Largillier et al. Citation2008).
Briefly, this technique involves mincing the breast tumor into fragments, the minced fragments are then placed in 2 ml of 199 medium containing 20% fetal calf serum, streptomycin 100 U/ml, penicillin 100 U/ml, and 6 micro Ci/ml H3- thymidine with specific activity 5 Ci/mol. They are incubated for 1 h at 37°C in a shaker water bath. After the incubation period, the tumor fragments are washed 3 times in phosphate-buffered solution and fixed in buffered 10% formalin solution dehydrated in alcohol and embedded in paraffin. Paraffin sections are obtained at 5 microns. Slides are coated with emulsion film in a dark room and exposed at 4°C for 3–5 days. Autoradiography is then performed on the slides, usually several weeks after incorporation, and cells with overlying grains caused by the isotopic emission of 3H are scored (DeBruin and Josephy Citation2002).
A tumor cell is considered labeled with thymidine when it contains at least 20 grains overlying the nucleus. A total of 1000–3000 cells are counted to determine the ratio of labeled cells. Thymidine labeling index is estimated as the percentage of epithelial cells labeled with thymidine. Values less than 3% are considered as low TLI, whereas values equal to or more than 3% are considered high TLI based on previous studies (DeBruin and Josephy Citation2002).
The thymidine labeling index tends to be much higher than the mitotic count because cells spend longer in S-phase than M-phase (approximately 7–24 h as opposed to less than half an hour) (Beresford et al. Citation2006). This method allows accurate determination of proliferation rates even if proliferation is very slow and does not have the problem of difficulty in identifying mitotic cells that are often encountered in mitotic index measurements. Largillier and colleagues found the method to be reliable and reproducible with different observers scoring the radiographs and also found a good correlation between primary tumors and their axillary metastases or recurrences. Correlation within and between laboratories is also good.
Measurement of the proliferative index of breast cancer does, however, have limitations that limit its worldwide use especially in our part of the world; limitations are attributable to the difficulties in the methodological procedure to determine H3-TLI, it requires fresh tissue, it needs autoradiography which is time-consuming, and it requires the handling of a radioisotope which is poisonous.
Flow cytometry measurement is believed to be one of the most clinically validated methods for measuring proliferation. This technique also measures the fraction of cells engaged in chromosomal DNA synthesis. In this method, Cells are mechanically dispersed, stained with propidium iodide, and passed through a flow cytometer, which produces a DNA histogram with distributions corresponding to phases in the cell cycle. The major peak corresponds to the G1/G0 phase. DNA content (ploidy) and proliferation can be assessed. If there is a second major peak, the tumor is considered aneuploid, otherwise, it is considered diploid. The SPF can be calculated using a simple algorithm. Flow cytometry measurements of SPF have been shown to correlate with mitotic counts, histological grades, and 3HTdR LIs (Meyer and Province Citation1988; Lee and Oguma Citation2006). Its advantage is that it can be used on a wide variety of tissue preparations, including fresh surgical samples, frozen biopsy specimens, and archival paraffin blocks (Meyer and Province Citation1988). However, there have been concerns over the standardization of both tissue preparation and analysis variability between laboratories. Another limitation of this technique is that samples contain varying contributions from normal stromal tissue and so the DNA histograms do not solely reflect the malignant component.
Immunohistochemistry techniques to detect proliferative-associated antigens
Rather than identifying cells engaged in particular phases of the growth cycle, an alternative method of assessing proliferation is to detect antigens that are closely associated with proliferation using immunohistochemistry. The principle of immunohistochemistry is to localize antigens in tissue sections by the use of labeled antibodies as specific reagents through antigen–antibody interactions that are visualized by a marker such as fluorescent dye, enzyme, a radioactive element, or colloidal gold. One of such antigens is the Ki-67 nuclear antigen. Ki-67 is a protein expressed in the nucleus during the cell cycle (Gerdes et al. Citation1984). Cells express the antigen during G1, S, G2, and M-phases, but not during G0. The Ki-67 labeling index is currently widely used as the measure of proliferation and the original antibodies raised against Ki-67 antigen required fresh or frozen tumor specimens; however, newer antibodies such as MIB-1 have been developed and have the advantage of being effective in fixed, archival specimens following microwave irradiation. After immunohistochemical staining is performed, cells that showed specific nuclear staining were scored as positive and the Ki-67 labeling index was expressed as the percentage of the total number of tumor cells that stain positive; this equates to the growth fraction of the tumor. Higher grade cancers have higher Ki-67 indices – one study found mean scores of 9% in grade I tumors, 14% in grade II, and 26% in grade III (Sullivan et al. Citation1993). Other nuclear antigens, such as proliferating cell nuclear antigen (PCNA), have been investigated, but appear to correlate poorly with Ki-67 and mitotic count so may be of more limited use in assessing proliferation (Sullivan et al. Citation1993).
In 1984, Gerdes described the use of an immunohistochemical method that allows measurement of cells in the DNA synthesis stage of the cell cycle (S-phase fraction) without the need for autoradiography or radioisotopes and has been shown to give similar results to tritiated thymidine labeling. Monoclonal antibodies specific for 5-bromodeoxyuridine (BrdU) is used in the detection of cells engaged in DNA replication. Meyer and colleagues found BrdU labeling of breast cancer specimens to correlate with S-phase measured by tritiated thymidine labeling and flow cytometry (Meyer and Province Citation1988). BrdU labeling has better resolution than tritiated thymidinelabeling.
They also have the advantage of applying to cytological material from breast aspirates and need less tissue than some other methods. Although in theory, these methods appear to be quicker, cheaper, and easier to use than flow cytometry and autoradiography and more reliable and reproducible than mitotic figure counting, there are certain limitations associated with the use of these nuclear antigens in our study of the proliferative index of breast cancer in our part of the world. For example, immunohistochemistry requires specific antibodies that are not readily available and hence expensive making it an expensive technique. Scoring can be time-consuming and variability in fixation can affect staining.
Positron emission tomography
Literature published by Beresford et al. in 2006 accounts that thymidine has shown some potential as a tracer for use in positron emission tomography (PET) scanning and early studies in humans have shown a correlation of 2-[11C]- thymidine uptake with tumor activity (Shields et al. Citation1998). However, the short half-life (20 min) of 11C and the catabolism of thymidine made the tracer impractical for routine clinical use. An analogue of thymidine, 3-Deoxy-3-fluorothymidine (FLT) that was initially developed for the treatment of HIV, but was found to cause myelosuppression, peripheral neuropathy, and nausea at therapeutic doses. However, when used in tracer doses with a [18F] label it is both non-toxic and has the advantage of a longer half-life (110 min) than 11C labeled thymidine. Shields and colleagues then introduced the use of FLT in PET scanning for the assessment of tumor proliferative activity. Thymidine is rapidly transported into the cell from the extracellular fluid using non-energy-dependent nucleoside transporters and active, Na+-dependent carriers. After entering the cell, FLT is converted to a monophosphate by the enzyme thymidine kinase (TK 1) that is involved in the phosphorylation of deoxythymidine during DNA synthesis. TK1 is present in the cytoplasm and activated at the late G1 phase of the cell cycle. TK1 activity is high in proliferating and malignant cells but is low or absent in quiescent cells (Beresford et al. Citation2006). The monophosphate lacks a hydroxyl group, thus preventing its incorporation into DNA and trapping it within the cell. As mentioned above, the activity of the TK1 enzyme increases dramatically during DNA synthesis. The uptake of FLT is related to TK1 activity, and so is linked to proliferation in cancer including breast cancer. Limited applications of this method stem from the fact that it is yet to be verified as an accurate measure of cellular proliferation, patients are also exposed to radiation, it is an expensive method and finally, a supply of radio-tracer is limited (Beresfordet al. Citation2006).
Advantages of AgNOR as a marker for proliferative index over other markers
Several studies conducted have shown a positive correlation between mean AgNOR score and DNA ploidy (content), tumor grade, and the SPF on flow cytometry (Mourad et al. Citation1992), with Ki-67 staining and with PCNA and has, therefore, been proposed as an alternative measure of tumor proliferation. AgNOR staining techniques is therefore the most preferred choice for this study because of several limitations and technical difficulties associated with the aforementioned techniques. For example, the use of the thymidine labeling index as a measure of the proliferative index is associated with some difficulties attributable to the methodological procedure for the determination of tritiated thymidine which is used as labels for the breast tissues. Because this procedure requires metabolically viable (fresh) specimens and also thymidylate synthase needs to be blocked to enhance the incorporation of the label rather than endogenous thymidylate making the whole process cumbersome and problem-prone. Thymidine labeling technique deals with radioisotopes which are poisonous and hazardous thereby making it relatively unsafe compared with AgNOR staining technique which is a simple procedure for measuring the cellular proliferative activity and uses light microscopy for visualizing. Again, in our study, archival samples would be used, however, thymidine labeling requires fresh specimen which makes AgNOR staining the method of choice because it works perfectly on an archival specimen.
Immunohistochemical techniques are known to be an expensive technique compared with AgNOR which is a cheaper technique. Comparatively the silver nitrate reagent used for the staining in AgNOR is readily available in our part of the world compared to the antibodies needed for the immunohistochemical techniques such as KI-67 labeling index and PCNA. The use of AgNOR has the advantage that it can be used with the material that we obtained for routine process in a histological laboratory and we did not need special fixation, which Ki-67 needs, and the NOR-associated proteins have a longer half-life than other nuclear markers such as PCNA and Ki-67 (Ploton et al. Citation1986).
Comparing AgNOR count and mitotic count as a measure of the proliferative index there are several limitations which again justifies why AgNOR is chosen for this study. it can be difficult to identify mitotic cells due to confusion with apoptosis or nuclear pyknosis (where there is irreversible condensation of chromatin in the nucleus of a cell undergoing necrosis), however, identification is not a problem in the case of AgNOR. A further criticism of mitotic index as a measure of proliferation is that the duration of the mitotic phase of the cell cycle is variable, and hence the correlation of the number of mitoses and proliferation rate is not necessarily linear (van Diest et al. Citation2004).
Conclusions
The NORs (nucleolus organizer regions) are defined as nuclear components; a group of arginophilic proteins selectively dyed by silver staining that can be easily identified as dark brown or black spots in the nuclear area, known as AgNORs. From the discussion, AgNOR staining techniques have been applied to study various cancers such as tumors of the stomach (Lakshmi et al. Citation1993; Srivastava et al. Citation2013; Lavenir et al. Citation2019), renal carcinoma (Suresh et al. Citation1990), urothelial carcinoma, lung carcinoma, central nervous system tumors and salivary tumors (Yang et al. Citation1990; Kinoshita et al. Citation2012; Ahmad et al. Citation2019). Cytomorphological classification and detections of tumors can be a direct influence on response to chemotherapy. Additionally, increased NOR count is associated with plasmocytoid cells, which suggests faster proliferation.
This review has added to the knowledge available on the mechanisms used in measuring the tumor proliferative activity and malignant transformation, which ultimately would help research scientists to identify more treatment targets and develop alternative cancer-therapy interventions. It is expected to serve as a valuable source of information for scientists that would enlighten them in understanding the need to adhere to practices and to employ an alternative procedure that is free of such challenges, this is no difficulties associated with obtaining, importing, and storing the antibodies needed for use in less developed countries, and other advanced countries in general, to assess proliferative activity of breast cancer, and other related carcinoma levels.
Disclosure statement
No potential conflict of interest was reported by the author(s).
Additional information
Funding
References
- Abboud P, Lorenzato M, Joly D, Quereux C, Birembaut P, Ploton D. 2008. Prognostic value of a proliferation index including MIB1 and argyrophilic nucleolar organizer regions proteins in node-negative breast cancer. Am J Obstet Gynecol. 199(2):146.e1–146.e7. doi:10.1016/j.ajog.2008.02.025.
- Ades F, Zardavas D, Bozovic-Spasojevic I, Pugliano L, Fumagalli D, de Azambuja E. 2014. Luminal B breast cancer: molecular characterization, clinical management, and future perspectives. J Clin Oncol. 32(25):2794–2803. doi:10.1200/JCO.2013.54.1870.
- Ahmad SO, Baun J, Tipton B, Tate Y, Switzer RC. 2019. Modification of AgNOR staining to reveal the nucleolus in thick sections specified for stereological and pathological assessments of brain tissue. Heliyon. 5:e03047. doi:10.1016/j.heliyon.2019.e03047.
- Albanese F, Salerni FL, Giordano S, Marconato L. 2006. Extragenital transmissible venereal tumour associated with circulating neoplastic cells in an immunologically compromised dog. Vet Comp Oncol. 4:57–62.
- Beresford MJ, Wilson GD, Makris A. 2006. Measuring proliferation in breast cancer: practicalities and applications. Breast Cancer Res. 8(6):216. doi:10.1186/bcr1618.
- Biesterfeld S, Reitmaier M. 2001. Re-evaluation of prognostic mitotic figure counting in breast cancer: results of a prospective clinical follow-up study. Anticancer Res. 21(1B):589–594.
- Bonotto M, Gerratana L, Poletto E, Driol P, Giangreco M, Russo S, et al. 2014. Measures of outcome in metastatic breast cancer: insights from a real-world scenario. Oncologist. 19(6):608–615. doi:10.1634/theoncologist.2014-0002.
- Bourgeois CA, Hernandez-Verdun D, Hubert J, Bouteille M. 1979. Silver staining of NORs in electron microscopy. Exp Cells Res. 123(2):449–452. doi:10.1016/0014-4827(79)-90498-1.
- Canadian Cancer Society. 2009. Canadian cancer statistics at a glance: cancer in children. Can Med Assoc J. 180:422–424. 10.1503/cmaj.081155: Canada.
- Cardoso F, Costa A, Norton L, Senkus E, Aapro M, André F. 2014. ESO-ESMO 2nd international consensus guidelines for advanced breast cancer (ABC2). Breast. 23(5):489–502. doi:10.1016/j.breast.2014.08.009.
- Centers for Disease Control and Prevention (CDC). 2013. Cervical cancer screening among women aged 18–30 years – United States, 2000–2010. MMWR Morb Mortal Wkly Rep. 61(51-52):1038–1042.
- Clegg-Lamptey JNA, Hodasi WM. 2007. A study of breast cancer in Korle Bu teaching hospital: assessing the impact of health education. Ghana Med J. 41(2):72–77.
- Coleman MP, Quaresma M, Berrino F, Lutz JM, De Angelis R, Capocaccia R. 2008. Cancer survival in five continents: a worldwide population-based study (CONCORD). Lance Oncol. 9(8):730–756. doi:10.1016/S1470-2045(08)70179-7.
- Coles C, Condie A, Chetty U, Steel CM, Evans HJ, Prosser J. 1992. P53 mutations in breast cancer. Cancer Res. 52:5291–5298.
- Crocker J, Macartney JC, Smith JP. 1988. Correlation between DNA flow cytometric and nucleolar organizer region data in non-Hodgkin’s lymphoma. J Pathol. 154(2):151–156. DOI: 10.1002/path.1711540207.
- Darkwah WK, Aidoo G, Ao Y, Danquah KO, Adjei E, Adankwah E, Kadri A. 2018. Assessment of proliferative index in different grades of breast cancers using AGNOR (Argyrophilic Nuclear Organizer Region) expression. Beni-Suef Univ J Basic Appl Sci. 7(4):587–592. doi:10.1016/j.bjbas.2018.06.011.
- Das U, Das AK. 2000. Review of canine transmissible venereal sarcoma. Vet Res Commun. 27:545–556.
- Dasgupta A, Ghosh RN, Sarkar R, Laha RN, Ghosh TK, Mukherjee C. 1997. Argyrophilic nucleolar organiserregions (AgNORs) in breast lesions. J Indian Med Assoc. 95(9):492–494.
- de Azambuja E, Cardoso F, Jr dCG, Colozza M, Mano MS, Durbecq V. 2007. Ki-67 as a prognostic marker in early breast cancer: meta-analysis of published studies involving 12,155 patients. Br J Cancer. 96(10):1504–1513. DOI: 10.1038/sj.bjc.6603756.
- DeBruin LS, Josephy PD. 2002. Perspective on the chemical etiology of breast cancer. Environ Health Perspect. 110(Suppl. 1):119–128. doi:10.1289/ehp.02110s1119.
- Derenzini M, Ploton D. 1991. Interphase nucleolar organizer region in cancer cell. Int Rev EXP Pathol. 32:149–192.
- Derenzini M, Thiry M, Gessens G. 1990. Ultrastructural cytochemistry of the mammalian cell nucleolus. J Histochem Cytochem. 38:1237–1256. doi:10.1177/38.9.2201735.
- Dufresne A, Pivot X, Tournigand C, Facchini T, Alweeg T, Chaigneau L. 2008. Maintenance hormonal treatment improves progression free survival after a first-line chemo-therapy in patients with metastatic breast cancer. Int J Med Sci. 5(2):100–105.
- Fallowfield ME, Dodson AR, Cook MG. 1988. Nucleolar organizer regions in melanocytic dysplasia and melanoma. Histopathology. 13(1):95–99. DOI: 10.1111/j.1365-2559.1988.tb02007.x.
- Ferlay J, Shin H-R, Bray F, Forman D, Mathers C, Parkin DM. 2010. Estimates of worldwide burden of cancer in 2008: GLOBOCAN 2008. Int J Cancer. 127(12):2893–2917. doi:10.1002/ijc.25516.
- Gangul YB, Das U, Das AK. 2013. Canine transmissible venereal tumour- a review. Vet Comp Oncol. 14(1):1–12.
- Gerdes J, Lemke H, Baisch H, Wacker HH, Schwab U, Stein H. 1984. Cell cycle analysis of a cell proliferation-associated human nuclear antigen defined by the monoclonal antibody Ki-67. J Immunol. 133(4):1710–1715.
- Goldman MB, Hatch MC. 2000. Breast cancer epidemology, treatment, and prevention. In: Ursin G, Spicer D, editor. Women and health. London: Academic Press; p. 871–883.
- Harmelin A, Zuckerman A, Nyska A. 1995. Correlation of AgNOR protein measurements with prognosis in canine transmissible venereal tumour. J Comp Pathol. 112:429–433.
- Hernandez-Verdun D, Hubert J, Bourgeois CA, Bouteille M. 1980. Ultra-structural localization of Ag-NORs stained proteins in nucleolus during the cell cycle and in other nucleolar structures. Chromosoma. 79(3):349–362.
- Kennecke H, Yerushalmi R, Woods R, Cheang MC, Voduc D, Speers CH. 2010. Metastatic behavior of breast cancer subtypes. J Clin Oncol. 28(20):3271–3277. doi:10.1200/JCO.2009.25.9820.
- Khan SA, Chaudhry NA, Khalid AW, Akhtar GN, Ibne-Rasa SN. 2006. Patterns of argyrophilic nucleolar organiser regions in pleural and peritoneal effusion. J Coll Physicians Surg Pak. 16(6):412–415. 6.2006/JCPSP.412415.
- Kinoshita Y, Dohi M, Mizutoni N, et al. 2012. Effects of preoperative radiation and chemotherapy on AgNOR counts in oral squamous cell carcinoma. J Oral Maxillofac Surg. 54:304–307.
- Kloke O, Klaassen U, Oberhoff C, Hartwich G, Szanto J, Wolf E. 1999. Maintenance treatment with medroxyprogesterone acetate in patients with advanced breast cancer responding to chemotherapy: results of a randomized trial. Essen Breast Cancer Study Group. Breast Cancer Res Treat. 55(1):51–59.
- Kobylakov DS, Avdalyan AM, Lazarev AF, Lushnikova EL, Nepomnyashchikh LM. 2014. Argyrophilic nucleolar organizer region in MIB-1 positive cells in non-small cell lung cancer: clinicopathological significance and survival. Cancer Biol Med. 11(4):264–269. doi:10.7497/j.issn.2095-3941.2014.04.005.
- Krüger S, Stahlhut M, Müller H. 2000. Cell cycle dependent AgNOR analysis in invasive breast cancer. Anal Quant Cytol Histol. 22(5):358–563.
- Kuntz CA, Dernell WS, Powers BE, Devitt C, Straw RC, Withrow SJ. 1997. Prognostic factors for surgical treatment of soft-tissue sarcomas in dogs: 75 cases (1986–1996). J Am Vet Med Assoc. 211(9):1147–1151.
- Lakshmi S, Nair SA, Jayashree R. 1993. Argyrophilic nucleolar organizer region (AgNOR) in inflammatory, premalignant and malignant lesions of the uterine cervix. Cancer Lett. 71:197–201.
- Largillier R, Ferrero JM, Doyen J, Barriere J, Namer M, Mari V. 2008. Prognostic factors in 1038 women with metastatic breast cancer. Ann Oncol. 19(12):2012–2019. doi:10.1093/annonc/mdn424.
- Lavenir I, Passarella D, Masuda-Suzukake M, Curry A, Holton JL, Ghetti B, Goedert M. 2019. Silver staining (Campbell-Switzer) of neuronal α-synuclein assemblies induced by multiple system atrophy and Parkinson’s disease brain extracts in transgenic mice. Acta Neuropathol Commun. 7(1):148.
- Lee I, Oguma Y. 2006. Physical activity. In: Schottenfeld D, Fraumeni JF, editor. Cancer epidemiology and prevention. New York: Oxford University Press. doi:10.1093/acprof:oso/9780195149616.001.0001
- Lehr HA, Hansen DA, Kussick S, Li M, Hwang H, Krummenauer F. 1999. Assessment of proliferative activity in breast cancer: MIB-1 immunohistochemistry. Hum Pathol. 30(11):1314–1320. doi:10.1016/S0046-8177(99)90062-X.
- Lichtenstein P, Holm NV, Verkasalo PK, Iliadou A, Kaprio J, Koskenvuo M. 2000. Environmental and heritable factors in the causation of cancer – analyses of cohorts of twins from Sweden, Denmark, and Finland. N Engl J Med. 343(2):78–85. doi:10.1056/NEJM200007133430201.
- Lobbezoo DJ, van Kampen RJ, Voogd AC, Dercksen MW, van den Berkmortel F, Smilde TJ. 2013. Prognosis of metastatic breast cancer subtypes: the hormone receptor/HER2-positive subtype is associated with the most favorable outcome. Breast Cancer Res Treat. 141(3):507–514. doi:10.1007/s10549-013-2711-y.
- Meyer JS, Province M. 1988. Proliferative index of breast carcinoma by thymidine labelling: prognostic power independent of stage, estrogen and progesterone receptors. Breast Cancer Res Treat. 12(2):191–204.
- Mohanty G, Padhy K. 2020. Diagnostic and prognostic importance of AgNOR pleomorphism in cervical carcinoma. Indian J Gynecol Oncol. 18:94. doi:10.1007/s40944-020-00441-4(0123).
- Montemurro F, Rondon G, Ueno NT, Munsell M, Gajewski JL, Champlin RE. 2002. Factors affecting progression-free survival in hormone-dependent metastatic breast cancer patients receiving high-dose chemotherapy and hematopoietic progenitor cell transplantation: role of maintenance endocrine therapy. Bone Marrow Transpl. 29(10):861–866. doi:10.1038/sj.bmt.1703555.
- Mourad WA, Erkman-Balis B, Livingston S, Shoukri M, Cox CE, Nicosia SV. 1992. Argyrophilic nucleolar organizer regions in breast carcinoma. Correlation with DNA flow cytometry, histopathology, and lymph node status. Cancer. 69(7):1739–1744. doi:10.1002/1097-0142(19920401)69:7<1739::AID-CNCR2820690715>3.0.CO;2-9.
- Nak D, Nak Y, Cangul IT, Tun B. 2005. A clinico-pathological study on the effect of vincristine on transmissible venereal tumour in dogs. J Vet Med. 52:366–370.
- Öfner D, Bier B, Heinrichs S, Berghorn M, Dünser M, Hagemann H-A. 1996. Demonstration of silver-stained nucleolar organizer region associated proteins (AgNORs) after wet autoclave pretreatment in breast carcinoma: correlation to tumor stage and long term survival. Breast Cancer Res Treat. 39(2):165–176.
- Ogura S, Abe S, Sukoh N, Kunikane H, Nkajima I. 1992. Correlation between nucleolar organizer regions visualized by silver staining and the growth rate in lung adenocarcinoma. Cancer. 70(1):63–68. doi:10.1002/1097-0142(19920701)70:1<63::AID-CNCR2820700111>3.0.CO;2-V.
- Petrucelli N, Daly BM, Feldman GL. 2013. BRCA1 and BRCA2 hereditary breast and ovarian cancer. 210-234 In: Adam MP, Ardinger HH, Pagon RA, Wallace SE, Bean LJH, Stephens K, editor. Genereviewes®. Seattle: University of Washington.
- Pich A, Chiusa L, Margaria E. 1995. Role of argyrophilic nuclear organizer regions in tumour detection and prognosis. Cancer Detect Prev. 19(3):282–291.
- Ploton D, Menager M, Jeannesson P, Himber G, Pigeon F, Adnet JJ. 1986. Improvement in the staining and in the visualization of the argyrophilic proteins of the nucleolar organizer region at the optical level. Histochem J. 18(1):5–14.
- Ploton D, Visseaux-Coletto B, Canellas JC, Bourzat C, Adnet JJ, Lechki C, Bonnet N. 1992. Semiautomatic quantification of silver-stained nucleolar organizer regions in tissue sections and cellular smears. Anal Quant Cytol Histol. 14(1):14–23.
- Reis Filho NP, Torres AAA, Silva MPC. 2020. Transmissible venereal tumor: cell proliferation (Agnor) and response of chemotherapy correlated with cytomorphological classification. ARS VETERINARIA. Jaboticabal. 36(2):140–147. doi:10.15361/2175-0106.2020v36n2p140-147.
- Rüschoff J, Neumann K, Contractor H, Plate K, Thomas C. 1990. Assessment of nucleolar organizer regions by automatic image analysis in breast cancer correlation with DNA content, proliferation rate, receptor status and histopathological grading. J Cancer Res Clin Oncol. 116(5):480–485.
- Rzymowska J. 1997. AgNOR counts and their combination with flow cytometric analyses and clinical parameters as a prognostic indicator in breast carcinoma. Tumori. 83(6):938–942. doi:10.1177/030089169708300613.
- Santagata S, Thakkar A, Ergonul A, Wang B, Woo T, Hu R. 2014. Taxonomy of breast cancer based on normal cell phenotype predicts outcome. J Clin Invest. 124(2):859–870. doi:10.1172/JCI70941.
- Sarli G, Preziosi R, Benazzi C, Castellani G, Marcato PS. 2002. Prognostic value of histologic stage and proliferative activity in canine malignant mammary tumors. J Vet Diagn Invest. 14(1):25–34. doi:10.1177/104063870201400106.
- Sharma M, Manjari M, Kahlon SK. 2011. Proliferative indices, Ki-67 immunostaining and nucleolar organizer region associated protein and their association with various grades of breast carcinomas. J Clin Diagn Res. 5(7):1371–1374.
- Shields AF, Mankoff DA, Link JM, Graham MM, Eary JF, Kozawa SM. 1998. Carbon-11-thymidine and FDG to measure therapy response. J Nucl Med. 39(10):1757–1762.
- Shier D, Jackie B, Ricki L. 2012. Hole’s essentials of human anatomy and physiology. New York: McGraw-Hill.
- Sinn HP, Lehnert T, Kandetzki C, Waldherr R. 1989. Nucleolar organizer regions in myogenic stromal tumours of the stomach. Virchows Arch A Pathol Anat Histopathol. 415(4):317–321.
- Sivridis E, Sims B. 1990. Nucleolar organiser regions: new prognostic variable in breast carcinomas. J Clin Pathol. 43(5):390–392. doi:10.1136/jcp.43.5.390.
- Soerjomataram I, Lortet-Tieulent J, Parkin DM, Ferlay J, Mathers C, Forman D, Bray F. 2012. Global burden of cancer in 2008: a systematic analysis of disability-adjusted life-years in 12 world regions. Lancet. 380(9856):1840–1850. doi:10.1016/s0140-6736(12)60919-2.
- Srivastava AN, Srivastava S, Bansal C, Misra JS. 2013. Diagnostic importance of AgNOR pleomorphism in cervical carcinogenesis. Ecancer. 7:287. doi:10.3332/ecancer.2013.287.
- Sullivan RP, Mortimer G, Muircheartaigh IO. 1993. Cell proliferation in breast tumours: analysis of histological parameters Ki67 and PCNA expression. Ir J Med Sci. 162(9):343–347. doi:10.1007/BF02942162.
- Suresh UR, Chawner L, Buckley H. 1990. Do AgNOR counts reflect cellular ploidy or cellular proliferation? J Pathol. 160:213–215.
- Trerè D. 2000. AgNOR staining and quantification. Micron. 31(2):127–131. doi:10.1016/S0968-4328(99)00069-4.
- Trerè D, Pession A. 1989. The silver-stained proteins of interphasic nucleolar organizer regions as a parameter of cell duplication rate. Exp Cell Res. 184(1):131–137. doi:10.1016/0014-4827(89)90371-6.
- van Diest PJ, van der Wall E, Baak JP. 2004. Prognostic value of proliferation in invasive breast cancer: a review. J Clin Pathol. 57(7):675–681. doi:10.1136/jcp.2003.010777.
- Volante M, Cavallo GP, Papotti M. 2004. Prognostic factors of clinical interest in poorly differentiated carcinomas of the thyroid. Endocr Pathol. 15(4):313–317. doi:10.1385/EP:15:4:313.
- Winzer KJ, Bellach J, Hufnagl P. 2013. Long-term analysis to objectify the tumour grading by means of automated microscopic image analysis of the nucleolar organizer regions (AgNORs) in the case of breast carcinoma. Diagn Pathol. 8:56. doi:10.1186/1746-1596-8-56.
- Wojnar A, Kobierzycki C, Krolica A, Pula B, Podharska OM, Dziegeil P. 2010. Correlation of the Ki-67 and the MCM-2 proliferative markers with the grade of the histological malignancy (G) in ductal breast cancers. Folia Histochem Cytobiol. 48(3):442–446. doi:10.2478/v10042-010-0069-0.
- Yang P, Hang GS, Zhu XS. 1990. Role of nucleolar organizer regions in differentiating malignant from benign tumours of the colon. J Clin Pathol. 43:235–238.
- Zografos GC, Panou M, Panou N. 2004. Common risk factors of breast and ovarian cancer: recent review. Int J Gynecol Cancer. 14(5):721–740. doi:10.1111/j.1048-891X.2004.14503.x.