
Abstract
Bladder cancer (BCa) is the most common urological tumor, and most BCas are diagnosed at an advanced stage due to the lack of reliable diagnostic markers. In this study, transcriptomic and clinical data from BCa patients in the TCGA database were analyzed and all patients were randomly divided into a training group and a validation group. Univariate Cox regression analysis was performed to screen miRNAs significantly associated with BCa prognosis, followed by multivariate Cox regression analysis in the training group to establish a prognostic risk model for multiple miRNAs. The model was validated in the validation group and in the whole group and assessed using Norman plots. KEGG pathway and GO enrichment analyses were performed on possible target genes, and PPI networks were constructed. Finally, a prognostic model for 5-miRNA was successfully constructed. Multivariate Cox analysis showed that it had good predictive properties and could be used as a novel biomarker to predict prognosis and survival of BCa patients and may exert its biological function through IGF1.
Introduction
Bladder cancer (BCa) is the genitourinary system tumor with the highest incidence in China, and its recurrence rate and mortality rate remain high (Abdollah et al. Citation2013; Taylor et al. Citation2020). Although a variety of biomarkers have been found to predict prognosis, their reliability is still controversial (Shi et al. Citation2019). Therefore, there is an urgent need to screen new and reliable biomarkers or therapeutic targets for the diagnosis and prognosis of BCa.
MiRNA is a class of non-coding single-stranded RNA molecules encoded by endogenous genes with a length of about 22 nucleotides (Lou et al. Citation2019). It regulates the expression of protein-coding genes by inhibiting translation or cutting RNA transcripts. There is growing evidence that miRNA is associated with the occurrence, progression and metastasis of BCa (Ali Syeda et al. Citation2020; Taheri et al. Citation2020). At present, a single miRNA has been used to build a prognostic model of BCa miRNA, but there are still some shortcomings, such as inaccurate results and failure to distinguish the ‘-5p’ and ‘-3p’ ends of mature miRNA (Yin et al. Citation2019).
In this study, we constructed, validated and evaluated a novel 5-miRNA prognostic model through the TCGA database, distinguished the ‘-5p’ and ‘-3p’ ends of miRNA, predicted the survival of patients with BCa, and functional enrichment revealed potential biological functions and signaling pathways related to BCa, which enhanced our understanding of the molecular mechanism of the model.
Materials and methods
Data download and processing
Download miRNA, mRNA sequencing data and clinical data of BCa patients from the Cancer Genome Atlas (TCGA) detabase. The expression of miRNA and mRNA in the tumor group was compared with that in the normal group by using the edgeR package of R software (version 3.6.2), and the miRNA and mRNA with corrected p-values < 0.05 and |log2FC| > 1 were screened (Robinson et al. Citation2010). Perl software (version 5.31.9) was used to combine the clinical information of patients with survival time ≥ 30 days with differentially expressed miRNA expression profiles.
Construction of prognostic model
Using ‘caret’ package, the samples with complete survival information, survival time ≥ 30 days and differentially expressed miRNA expression profiles were randomly divided into two groups (training group and verification group). Univariate Cox regression analysis was used to screen prognosis-related miRNA in the training group. In order to reduce the number of miRNA with similar expression, multivariate Cox regression analysis of miRNA with p < 0.05was carried out by using packages ‘Coxph’ and ‘direction = both’ (Stel et al. Citation2011). From the Cox proportional hazard regression model, we use the following formula to calculate the risk score of each patient: miRNA risk score = βmiRNA1 × exp (miRNA1) + βmiRNA2 × exp (miRNA2) + … . +βmiRNAn × exp (miRNAn), where β is the regression coefficient derived from the multivariate Cox proportional hazard regression model, and exp () is the level of the expression miRNA (Sui et al. Citation2017). According to the median risk score, they are divided into high-risk and low-risk subgroups. Using the ‘survivalROC’ package to calculate the AUC of the 5-year dependent ROC curve to evaluate the predictive ability of the miRNA model (Heagerty et al. Citation2000). Kaplan–Meier curve and logarithmic rank test were used to evaluate the survival and prognosis of the patients in the training group, the verification group and the whole group.
Independent prognostic ability test of miRNA model
In the training group, the relationship between 5-miRNA model and overall survival was analyzed by univariate Cox regression and clinical variables (including age, sex and clinical stage). Further multivariate Cox regression analysis was conducted to determine whether it could be used as an independent prognostic factor. The independent prognostic factors in the results of multivariate Cox regression analysis were plotted by Norman diagram, and the 1-, 3- and 5-year survival rates were predicted, and the 5-year survival rates were analyzed by the calibration curve.
MiRNA target gene and its potential function
The miRNA prediction database was downloaded from three miRNA target gene prediction websites of miRTarBase (http://mirtarbase.mbc.nctu.edu.tw/), targetScan (http://www.targetscan.org) and miRDB (http://www.mirdb.org/). The target genes of at least two miRNA models covered in the database were found by using Perl language, and the relationship between miRNA and these target genes was drawn by Venn diagram and Cytoscape software (version 3.6.1). In order to determine whether these miRNA target genes may be involved in the progression of BCa, we established the intersection of these target genes and differentially expressed genes in BCa. All the crossover genes were analyzed by using the R software packages ‘clusterProfiler’ and ‘org.Hs.eg.db’, as well as KEGG signal pathway and GO enrichment analysis (Yu et al. Citation2012).
PPI network construction
The PPI network is constructed by mining the relationship between the target genes from the STRING database (https://string-db.org/). The reliability of the parameters set is 0.700 (Szklarczyk et al. Citation2017). The top 10 central genes were determined according to Cytoscape 3.6.1 and its plug-ins (cytoHubba ranking). At the same time, Kaplan–Meier method was used to test whether the cross gene was related to survival, and the logarithmic rank test was less than 0.001.
Results
Differentially expressed miRNA and mRNA in BCa
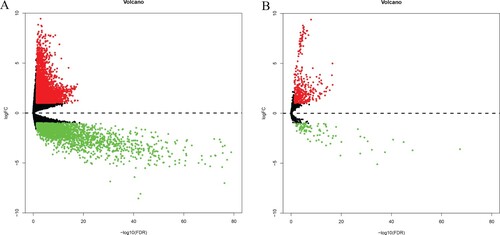
According to the screening conditions, a total of 473 differentially expressed miRNA were found, including 379 up-regulated and 94 down-regulated, and a total of 6850 differentially expressed mRNA, of which 4478 were up-regulated and 2372 down-regulated, were shown in the volcano plot (Figure ).
Figure 1. Volcano plot of DemRNAs (A). Volcano plot of DemiRNAs (B). Red dots represent up-regulation and green dots represent down-regulation.
Construction of 5-miRNA prognostic model
The whole group with miRNA mature expression profile (N = 160) was randomly divided into training group (N = 80) and verification group (N = 80). In the training group, univariate Cox regression analysis showed that a total of 19 miRNA were found to be related to the overall survival time of the patients (p < 0.05). Then the miRNA with similar expression was screened out by multivariate Cox regression analysis (Table ), and a predictive miRNA model was established according to the sum of the product of each miRNA expression and its coefficients in multivariate Cox regression. The model was established as follows: prognostic model risk score = (0.3665 × hsa-miR-338-5p) + (0.3917 × hsa-miR-218-1-3p) + (−0.5233× hsa-miR-17-3p) + (0.7595 × hsa-miR-6728-5p) +(−0.1777 × hsa-miR-10a-3p).
Table 1. 5-miRNA expression.
Survival prediction of training group, verification group and whole group
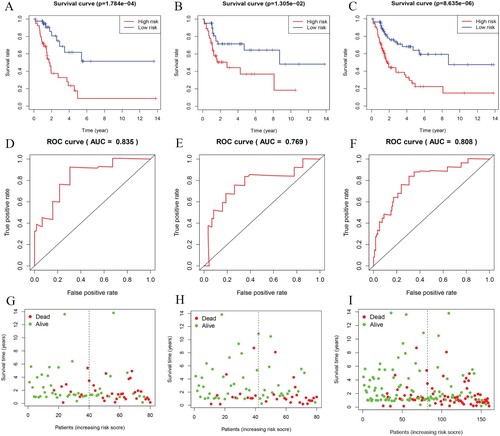
According to the median risk score of the training group, each group was divided into a high-risk and low-risk subgroups. Kaplan–Meier curve showed that the overall survival rate in the high-risk subgroup was significantly lower than that in the low-risk subgroup (Figure (A–C)). In the training group, the verification group and the whole group, the 5-year ROC-dependent AUC for 5-miRNA prognostic model reached 0.835, 0.769 and 0.808 respectively (Figure (D–F)). In addition, in the three groups, the mortality rate of patients with high-risk score was significantly higher than that of patients with low-risk score (Figure (G–I)).
Figure 2. Survival time, ROC and survival points of patients in training group, verification group and whole group. The Kaplan–Meier curve in the training group (A), verification group (B) and the whole group (C). The ROC curve in the training group (D), verification group (E) and the whole group (F). Patients survival in the training group (G), verification group (H) and the whole group (I).
Independence analysis of 5-miRNA prognostic model
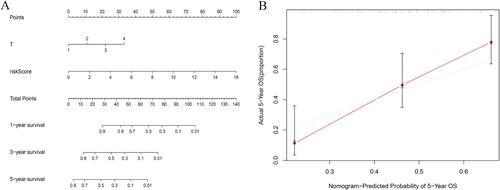
Univariate Cox regression analysis showed that the 5-miRNA prognostic risk score was significantly correlated with the overall survival rate (Figure (A)). Multivariate Cox regression analysis showed that 5-miRNA prognostic model was still associated with the overall survival rate considering other routine clinical factors, such as age, sex, clinical stage, T stage, lymph node status and distant metastasis (Figure (B)). In addition, the T stage is also an independent prognostic factor. The nomogram used to predict the OS of BCa patients is shown in Figure (A). Nomogram for predicting OS was based on the following two independent prognostic factors: T stage and 5-miRNA prognostic risk score. According to the sum of the distribution points of each factor in the nomogram, the higher the total score is, the worse the prognosis is.
Figure 3. Univariate and multivariate Cox regression analyses for the prognostication of overall survival in the training group. (A) univariate Cox analysis; (B) multivariate Cox analysis.
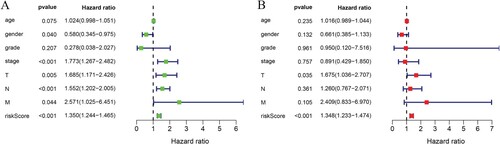
Figure 4. The nomogram used to predict the OS of BCa patients. (A) To estimate the 1-year, 3-year, and 5-year survival rate of BCa, the patient’s corresponding values were marked on each axis and the points of all variables were summed. Next, mark the sum on the total point axis and draw a straight line perpendicular to the probability axis. (B)The x-axis shows the predicted probability of 5-year survival rate of BCa, and the y-axis shows the observed actual 5-year survival rate of BCa.
Target gene of 5-miRNA prognostic model
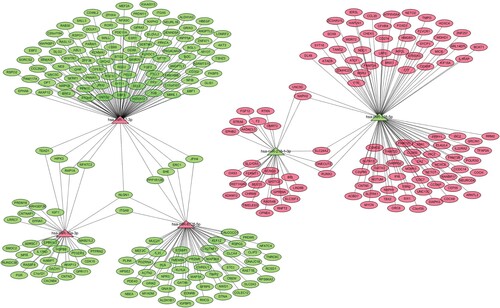
The target genes regulated by five kinds of miRNA were predicted in the three databases of miRDB, miRTarBase and TargetScan. The overlapping target genes were identified, and a total of 3094 target genes in 5 miRNA were predicted, which were shown by the Venn map (Figure ). In order to clarify whether the target genes of these miRNA may be involved in the progression of BCa, the mRNA predicted by the down-regulated miRNA (hsa-miR-17-3p, hsa-miR-10a-3p) in the database was interacted with the rising differentially expressed mRNA, and the mRNA predicted by the up-regulated miRNA (hsa-miR-338-5p, hsa-miR-218-1-3p, hsa-miR-6728-5p) was interacted with the down-regulated mRNA. A total of 307 target genes were included, including 134 up-regulated genes and 173 down-regulated genes. The subnetwork between 5 miRNA and its 307 target genes is shown in Figure .
Figure 5. Five Venn diagram of the target gene of miRNA. (A) hsa-miR-10a-3p (B) hsa-miR-338-5p (C) hsa-miR-17-3p (D) hsa-miR-218-1Mur3p and (E) hsa-miR-6728-5p.
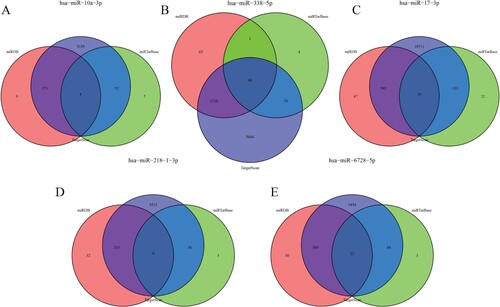
Figure 6. MiRNA adjusts the subnetwork diagram of mRNA. Triangles represent miRNA and the circle represents mRNA. Red indicates up-regulation and green means down-regulation.
Functional enrichment analysis of BCa-related target genes
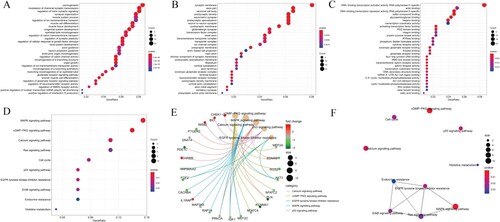
The result of GO annotation on BCa-related target genes was 979. The top 30 functions in GO results are shown in biological processes (BP), cellular components (CC) and molecular functions (MF) in the dot map (Figure (A–C)). The results of the KEGG pathway of target genes related to BCa are mainly concentrated in the cGMP-PKG signal pathway, and the ‘pathway-gene network’ and ‘pathway-pathway network’ are also shown in Figure (D–F).
Figure 7. Functional enrichment analysis of BCa-related target genes. The (A) BP, (B) CC, (C) MF, (D) KEGG signal pathway dot map shows the gene count dot map shows the gene count, (E) KEGG signal pathway cnetplot shows the ‘pathway-gene’ network the emapplot of the and (F) KEGG signal pathway shows the ‘pathway-pathway’ network.
PPI network and target genes related to survival
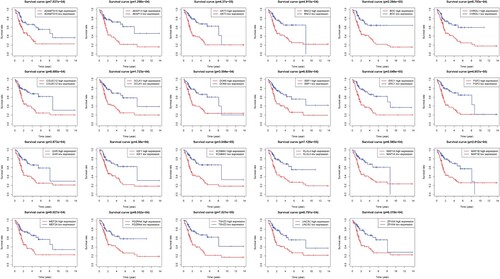
About 291 of the 307 target genes were filtered into the target gene PPI network, and 10 central genes (CHEK1,ESR1, CDCA8, MCM10, TTK, IGF1, WDHD1, ABL1, RRM2, CENPF) are filtered based on Cytoscape 3.6.1 and its plug-ins (cytoHubba ranking) respectively (Figure ). Kaplan–Meier method showed that the expression of 23 genes (ADAMTS15, AKAP13, AKT3, BNC2, BOC, CHRDL1, COLEC12, DCLK1, DOK6, EBF1, ERC1, FGF2, GHR, IGF1, KCNMA1, KLHL4, MAP1A, MAP1B, MEF2A, PDZRN4, TSHZ3, UNC5C, ZFHX4) was negatively correlated with survival (Figure ).
Figure 8. Protein–protein interaction network of target genes.
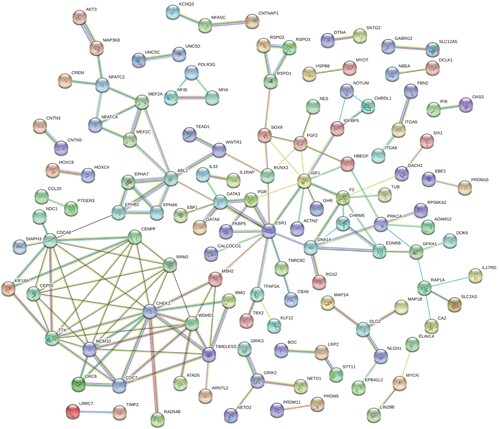
Figure 9. Kaplan–Meier method showed that the expression of 23 genes was negatively correlated with survival of BCa.
Discussion
BCa is the first disease of malignant tumor of the urinary system, which high recurrence rate and distant metastasis rate bring huge economic burden to patients and society (Leal et al. Citation2016). Therefore, there is an urgent need to develop new markers to reduce the burden of the disease on patients and the health care system. Current studies have shown that the expression of miRNA in urine and blood samples of patients with BCa is different from that of healthy people, which may be of diagnostic value (Blanca et al. Citation2017). There are several single miRNA can be used as potential prognostic indicators of BCa, such as miR-125a-5p, miR-199, miR-100 and so on (Motawi et al. Citation2016; Sakaguchi et al. Citation2018; Zhang et al. Citation2018). However, a large number of studies have shown that multiple miRNA models have greater advantages than a single miRNA. Prior to our study, we have established a number of prognostic models constructed by multi-miRNA, including BCa (Zhou et al. Citation2015; Inamoto et al. Citation2018). Compared with previous studies, our research updated the research methods and expanded the sample size. Most importantly, we used to distinguish between ‘-5p’ and ‘-3p’ side miRNA to verify the model.
In this study, we downloaded mature miRNA expression profiles and BC clinical information of corresponding patients from the TCGA database. All patients were randomly divided into a training group and verification group, and then five miRNA prognostic models were constructed by univariate Cox regression and stepwise multivariate Cox regression. At the same time, the 5-miRNA model is verified in the verification group and the whole group. Based on the median risk score, the Kaplan–Meier curve showed that the overall survival of the high-risk subgroup was significantly worse than that of the low-risk group. Evaluating the excessive survival of 5-miRNA signals in the three groups of patients by ROC curve showed better predictive ability. Univariate Cox regression and multivariate Cox regression analysis also indicated that the 5-miRNA model was associated with overall survival, taking into account other routine clinical factors in patients with BCa. Lu found that miR-17-3p regulates the proliferation and survival of colon cancer through targeted regulation of Par4 (Lu et al. Citation2018). Lazzarini found that miR-10a-3p was associated with uterine leiomyoma (Lazzarini et al. Citation2020). Zhou found that miR-338-5p can be used as a tumor marker of retinoblastoma and is associated with drug resistance in colorectal cancer (Xu et al. Citation2019; Zhou and Li Citation2019). Yu found that miR-218-1-3p was associated with lung adenocarcinoma (Yu et al. Citation2019). However, there is no report on the mechanism of miR-6728-5p in the tumor. Therefore, more experiments on miR-6728-5p are needed in the future, especiallyin BCa.
In order to further understand the regulatory mechanism of five miRNA models in BCa, the target genes of five miRNA in the model were predicted by three target gene prediction databases. At the same time, based on the study of BCa, we obtained the intersection of these miRNA target genes and differentially expressed genes from the TCGA database and analyzed the functional enrichment of these genes. GO annotation of target genes is mainly related to axonal development, axonogenesis and stem cell differentiation, synaptic membrane, postsynaptic membrane and neuronal body, metal ion transporter activity, transcriptional activator activity and DNA binding, ion channel binding. The signal pathway of the target gene is mainly concentrated in the cGMP-PKG signal pathway. Gong found that the activation of the GMP/PKG pathway contributes to the proliferation and invasion of cervical cancer cells (Gong et al. Citation2019). These signal pathways show their effects on the tumor in varying degrees, and these two signal pathways are only the tip of the iceberg of the target genes in the signal pathway, which suggests that the miRNA prognostic model we constructed may be involved in the regulation of tumor signalpathway.
In order to find the key nodes of the miRNA model regulating BCa, 10 hub genes (CHEK1, ESR1, CDCA8, MCM10, TTK, IGF1, WDHD1, ABL1, RRM2, CENPF) were screened according to Cytoscape 3.6.1 and its plug-ins. In addition, Kaplan–Meier method showed that 23 genes (ADAMTS15, AKAP13, AKT3, BNC2, BOC, CHRDL1, COLEC12, DCLK1, DOK6, EBF1, ERC1, FGF2, GHR, IGF1, KCNMA1, KLHL4, MAP1A, MAP1B, MEF2A, PDZRN4, TSHZ3, UNC5C, ZFHX4) were negatively correlated with survival and prognosis. Insulin-like growth factor 1 (IGF1) is not only a key gene in the PPI network but also related to the survival of patients. IGF1 is a peptide hormone that acts by binding and activating the IGF1 receptor, which is a widely distributed tyrosine kinase protein that promotes the balanced growth of circulating IGF1 among multiple tissues and organs (Maki Citation2010). The available verification data show that miRNA can target multiple molecules in the IGF1R pathway, including IGF1R, including miR-7, Let-7, miR-493, miR-155, miR-99, miR-145, etc. (Kumar et al. Citation2018). Therefore, miRNA signal may affect the survival and prognosis of patients with BCa and the progression of BCa by regulating IGF1.
The shortcoming of this study is that the model was constructed and validated using only data from the database, lacking validation from biological studies. However, the models and predictions we have developed have potential value for future research and require further validation and study.
Conclusions
To sum up, our study not only constructed a new prognostic model of the 5-miRNA model through miRNA mature expression profile but also verified and evaluated the predictive ability of the model by grouping. In addition, the potential function is inferred by predicting the target genes of the model, which deepens our understanding of the occurrence and development of the BCa. However, this study is only based on the use of bioinformatics TCGA database, lack of other databases and a large number of experiments to verify the feasibility of this prognostic model has some limitations, and further research is needed to verify this conclusion.
Data availability statement
The data that support the findings of this study are openly available in ‘figshare’ at https://doi.org/10.6084/m9.figshare.13622558.v1.
Disclosure statement
No potential conflict of interest was reported by the authors.
Additional information
Funding
References
- Abdollah F, Gandaglia G, Thuret R, Schmitges J, Tian Z, Jeldres C, Passoni NM, Briganti A, Shariat SF, Perrotte P, et al. 2013. Incidence, survival and mortality rates of stage-specific bladder cancer in United States: a trend analysis. Cancer Epidemiol. 37:219–225.
- Ali Syeda Z, Langden SSS, Munkhzul C, Lee M, Song SJ. 2020. Regulatory mechanism of MicroRNA expression in cancer. Int J Mol Sci. 21:1723.
- Blanca A, Cheng L, Montironi R, Moch H, Massari F, Fiorentino M, Raspollini MR, Scarpelli M, Lopez-Beltran A. 2017. Mirna expression in bladder cancer and their potential role in clinical practice. Curr Drug Metab. 18:712–722.
- Gong L, Lei Y, Tan X, Dong Y, Luo Z, Zhang D, Han S. 2019. Propranolol selectively inhibits cervical cancer cell growth by suppressing the cGMP/PKG pathway. Biomed Pharmacother. 111:1243–1248.
- Heagerty PJ, Lumley T, Pepe MS. 2000. Time-dependent ROC curves for censored survival data and a diagnostic marker. Biometrics. 56:337–344.
- Inamoto T, Uehara H, Akao Y, Ibuki N, Komura K, Takahara K, Takai T, Uchimoto T, Saito K, Tanda N, et al. 2018. A panel of MicroRNA signature as a tool for predicting survival of patients with urothelial carcinoma of the bladder. Dis Markers. 2018:5468672.
- Kumar AS, Rayala SK, Venkatraman G. 2018. Targeting IGF1R pathway in cancer with microRNAs: how close are we? RNA Biol. 15:320–326.
- Lazzarini R, Caffarini M, Delli Carpini G, Ciavattini A, Di Primio R, Orciani M. 2020. From 2646 to 15: differentially regulated microRNAs between progenitors from normal myometrium and leiomyoma. Am J Obstet Gynecol. 222:596.e1–596.e9.
- Leal J, Luengo-Fernandez R, Sullivan R, Witjes JA. 2016. Economic burden of bladder cancer across the European Union. Eur Urol. 69:438–447.
- Lou W, Ding B, Xu L, Fan W. 2019. Construction of potential glioblastoma multiforme-related miRNA-mRNA regulatory network. Front Mol Neurosci. 12:66.
- Lu D, Tang L, Zhuang Y, Zhao P. 2018. miR-17-3P regulates the proliferation and survival of colon cancer cells by targeting Par4. Mol Med Rep. 17:618–623.
- Maki RG. 2010. Small is beautiful: insulin-like growth factors and their role in growth, development, and cancer. J Clin Oncol. 28:4985–4995.
- Motawi TK, Rizk SM, Ibrahim TM, Ibrahim IA-R. 2016. Circulating microRNAs, miR-92a, miR-100 and miR-143, as non-invasive biomarkers for bladder cancer diagnosis. Cell Biochem Funct. 34:142–148.
- Robinson MD, McCarthy DJ, Smyth GK. 2010. Edger: a bioconductor package for differential expression analysis of digital gene expression data. Bioinformatics. 26:139–140.
- Sakaguchi T, Yoshino H, Yonemori M, Miyamoto K, Sugita S, Matsushita R, Itesako T, Tatarano S, Nakagawa M, Enokida H. 2018. Erratum: regulation of ITGA3 by the dual-stranded microRNA-199 family as a potential prognostic marker in bladder cancer. Br J Cancer. 118:e7.
- Shi Z, Kadeer A, Wang M, Wen B, Li M, Huang J, Gao Y, Liu E, Liu D, Jia D, et al. 2019. The deregulation of miR-133b is associated with poor prognosis in bladder cancer. Pathol Res Pract. 215:354–357.
- Stel VS, Dekker FW, Tripepi G, Zoccali C, Jager KJ. 2011. Survival analysis II: cox regression. Nephron Clin Pract. 119:c255–c260.
- Sui J, Xu S-Y, Han J, Yang S-R, Li C-Y, Yin L-H, Pu Y-P, Liang G-Y. 2017. Integrated analysis of competing endogenous RNA network revealing lncRNAs as potential prognostic biomarkers in human lung squamous cell carcinoma. Oncotarget. 8:65997–66018.
- Szklarczyk D, Morris JH, Cook H, Kuhn M, Wyder S, Simonovic M, Santos A, Doncheva NT, Roth A, Bork P, et al. 2017. The STRING database in 2017: quality-controlled protein-protein association networks, made broadly accessible. Nucleic Acids Res. 45:D362–D368.
- Taheri M, Shirvani-Farsani Z, Ghafouri-Fard S, Omrani MD. 2020. Expression profile of microRNAs in bladder cancer and their application as biomarkers. Biomed Pharmacother. 131:110703.
- Taylor J, Becher E, Steinberg GD. 2020. Update on the guideline of guidelines: non-muscle-invasive bladder cancer. BJU Int. 125:197–205.
- Xu K, Zhan Y, Yuan Z, Qiu Y, Wang H, Fan G, Wang J, Li W, Cao Y, Shen X, et al. 2019. Hypoxia induces drug resistance in colorectal cancer through the HIF-1α/miR-338-5p/IL-6 feedback loop. Mol Ther. 27:1810–1824.
- Yin X-H, Jin Y-H, Cao Y, Wong Y, Weng H, Sun C, Deng J-H, Zeng X-T. 2019. Development of a 21-miRNA signature associated with the prognosis of patients with bladder cancer. Front Oncol. 9:729.
- Yu G, Wang L-G, Han Y, He Q-Y. 2012. Clusterprofiler: an R package for comparing biological themes among gene clusters. OMICS. 16:284–287.
- Yu N, Yong S, Kim HK, Choi Y, Jung Y, Kim D, Seo J, Lee YE, Baek D, Lee J, et al. 2019. Identification of tumor suppressor miRNAs by integrative miRNA and mRNA sequencing of matched tumor–normal samples in lung adenocarcinoma. Mol Oncol. 13:1356–1368.
- Zhang Y, Zhang D, Lv J, Wang S, Zhang Q. 2018. MiR-125a-5p suppresses bladder cancer progression throughtargeting FUT4. Biomed Pharmacother. 108:1039–1047.
- Zhou H, Tang K, Xiao H, Zeng J, Guan W, Guo X, Xu H, Ye Z. 2015. A panel of eight-miRNA signature as a potential biomarker for predicting survival in bladder cancer. J Exp Clin Cancer Res. 34:53.
- Zhou P, Li X. 2019. Serum miR-338-5p has potential for use as a tumor marker for retinoblastoma. Oncol Lett. 18:307–313.