
Abstract
Several purple-leaf tea has been utilized around the world. Flavonoids accumulation is one of the reasons why purple-leaf tea has unique pharmacological value and flavor. Although abundant researches have focused on identification the key genes associated with flavonoids biosynthesis in purple-leaf tea cultivars, However, the accumulation pattern of flavonoids in purple-leaf tea is still worth investigation. Here, a group of local purple-leaf tea varieties (‘Baitangziyacha’, BTZY), which are derived from the natural mutant of green-leaf tea varieties (‘Baitangshancha’, BTSC), were found in China. To evaluate the available value of purple-leaf tea varieties, 11 ‘BTZY’ and 9 ‘BTSC’ varieties were used to analyze the accumulation of flavonoids by widely targeted metabolomic analyses. The results showed that 259 secondary metabolites were characterized, of which 250 metabolites were flavonoids. Principal component analysis (PCA) analysis indicated ‘BTZY’ and ‘BTSC’ varieties were not completely classified may be due to differences in the accumulation of a few metabolites. Furthermore, these results found that 6 types of anthocyanins 5 types of flavonols were significantly up-regulated in purple-leaf varieties. These metabolites potentially contributed to the unique color and flavor of purple-leaf tea. Our findings will be useful for the further breeding and processing of local purple-leaf tea varieties.
Introduction
The tea plant (Camellia sinensis L.) belongs to the Theaceae family and is a perennial woody shrub (Hayat et al. Citation2015; Kumari et al. Citation2019). Tea processed from the leaf is a popular beverage all over the word, especially in Japan and China (Saito et al. Citation2011). It is reported that tea contains beneficial bioactive components, including polyphenols, caffeine, theobromine, amino acid theanine, and inorganic salts and so on (Dwyer and Peterson Citation2013). As people become much more concerned about health, consumption of tea has been gained much attention in the light of both nutritional and therapeutic benefits. Flavonoids, which are phenolic compounds and contribute to bitterness and astringency, are the main cause of the distinctive flavors, colors and antioxidant of tea (Obst et al. Citation2013). Many investigations and epidemiological studies have suggested that flavonoids constituents of tea have positive beneficial effects on human health (Rashid et al. Citation2014a; Hayat et al. Citation2015). For example, (-)-Epigallocatechin-3-gallate in oolong tea can inhibits the proliferation of cancerous cells (Ng et al. Citation2018), (-)-Epicatechin gallate and (-)-epigallocatechin gallate in tea extracts improve cardiovascular health and reduce the risk of heart disease (Yang and Koo Citation1997). Previous studies indicated that flavonoids in green tea positively improve the level of total cholesterol and possess high antioxidant activity (Hu et al. Citation2009). Additionally, flavonoids play positive roles in cancer prevention (Ivey et al. Citation2017; Qadir Citation2017). Furthermore, flavonoids have also been proven to have antidiabetic (Zhang and Liu Citation2011), anti-inflammatory and antifatigue properties (Lee et al. Citation2013). Therefore, many researchers have been focused on plant flavonoids due to their notable healthcare ability (Wang et al. Citation2014).
Flavonoids are widely distributed in plants and approximately 7000 different categories have been chemically identified (Koes et al. Citation1994; Nabavi et al. Citation2020). Six subclasses of monomeric flavonoids, including flavonols, flavones, isoflavones, flavanones, flavan-3-ols, and anthocyanidins, have been classified in plants (Dwyer and Peterson Citation2013). Biosynthesis of flavonoids begins with an enzymatic reaction between one molecule of 4-coumaroyl-CoA and three molecules of malonyl-CoA, yielding chalcone, which is catalyzed by chalcone synthase. Next, chalcone is acted upon by a series of enzymes for the synthesis of flavonoids (Koes et al. Citation1994; Mamati et al. Citation2006; Saito et al. Citation2013; Zhang et al. Citation2014; Wu et al. Citation2019). Many studies have elucidated and confirmed the functional and regulatory genes involved in the biosynthesis pathway of flavonoids in plants (Mamati et al. Citation2006; Rothenberg et al. Citation2019; Nabavi et al. Citation2020). In plants, flavonoids serve as essential pigments that attract pollinators, absorb UV radiation, protect against pathogen infection, inhibit the cell cycle and act as signal messengers (Ferreyra et al. Citation2012; Long et al. Citation2019). In tea plant, abundant researches have focused on identifying the key or associated genes involved in flavonoids biosynthesis and metabolism. For example, a transcription factor module, CsbZIP1-CsMYB12, mediates the production of bitter-tasting flavonols in tea plants through a coordinated activator-repressor network (Zhao et al. Citation2021); A R2R3-MYB transcription factor and a glycosidase transferase gene promote flavonoid accumulation in purple-leaf tea (He et al. Citation2018). However, there are few studies which focused on the categories and contents of flavonoids in different color leaves in tea plants.
Purple-leaf tea, a natural variety of green-leaf tea, has been well developed due to its attractive, unique color and multiple health benefits (Kumari et al. Citation2019). Recently, some anthocyanin-rich purple-leaf tea cultivars have been used in several countries (Hayat et al. Citation2015; Rothenberg et al. Citation2019; Chen et al. Citation2020). The major constituents in the leaves of purple-leaf tea not only contain usual polyphenolic metabolites found in green tea, particularly, also have abundant anthocyanins, such as malvidin and cyanidin 3-O-galactoside (Hayat et al. Citation2015). The identified anthocyanins and anthocyanidins of purple-leaf tea extract surpassed by 135-fold and 3.5-fold than that of ordinary tea, respectively (Hsu et al. Citation2012). Further results show that the purple-leaf tea extract can inhibit the cancer proliferation by disturbing cell cycle progression and inducing apoptotic death, indicating that the purple-leaf tea potentially acts as beneficial dietary agent human health (Hsu et al. Citation2012). In addition, many studies suggested that physiological activities of purple-leaf tea include anti-trypanosome, cerebral antioxidant and anti-obesity effects (Rashid et al. Citation2014a; Rashid et al. Citation2014b; Hayat et al. Citation2015). Furthermore, compared with other varieties of Camellia sinensis L, purple-leaf tea contains relatively lower caffeine content, which decreases the risk of coronary heart disease (Kilel et al. Citation2013).
A number of chemical methods have been used to detect flavonoids level in plants (Butu et al. Citation2014). Metabolomic profiling is used as one of high throughput strategy to analyze the secondary metabolites at a molecular level, by coupling chromatography separation and mass spectrometry detection technologies (Lei et al. Citation2011). The primary differential metabolisms analysis tool used in this research was widely targeted metabolomics which is a novel metabolome detection technology that integrates the advantages of the ‘universality’ of the non-targeted metabolome and the ‘accuracy’ of the targeted metabolome detection technology. This technology was characterized by high throughput, ultra-sensitive, wide coverage, qualitative and quantitative accuracy (Sawada et al. Citation2009). Currently, a widely targeted metabolomic method has been widely used in the field of tea research to comprehensively analyze the non-volatile components in tea plant. Examples include analyzing dynamic changes in metabolites during green tea processing (Wang et al. Citation2021), and analysis of white peony teas with different storage time and association with sensory attributes (Fan et al. Citation2021). Therefore, the new technology can be applied to the comprehensive detection and analysis of flavonoids in tea plant.
A new mutant population, ‘Baitangziyacha’ (BTZY) varieties are discovered in the Baitang Mountains of Guangdong province, China (Rothenberg et al. Citation2019). They have young purple leaves and are derived from the natural mutant of ‘Baitangshancha’ (BTSC) which have young green leaves. Recently, several purple-leaf varieties have been shown to be rich in flavonoids (Saito et al. Citation2011; Joshi et al. Citation2015). Therefore, it is putative that ‘BTZY’ varieties may also be rich in flavonoids accumulation. In this study, a widely targeted metabolomic method was used to uncover differences in flavonoids accumulation between ‘BTZY’ and ‘BTSC’ varieties. Our results characterized the 259 polyphenol compounds that were accumulated, including 250 flavonoids, 7 tannins and 2 chalcones. Additionally, we found 34 metabolites differentially accumulated between ‘BTZY’ and ‘BTSC’ varieties, of which 21 were up-regulated and 13 were down-regulated. Our results found that anthocyanins and flavonols were significantly up-regulated in purple-leaf tea. These findings provide available information for improving the flavonoids accumulation of C. sinensis by genetic improvement and for processing of tea.
Materials and methods
Plant materials
Eleven purple-leaf ‘Baitangziyacha’ (BTZY) varieties and 9 green-leaf ‘Baitangshancha’ (BTSC) were used as materials to perform widely targeted metabolomic analyses. All local cultivars were planted in the Huizhou region [Guangdong, China (114°30′-114°53′E, 22°26′-22°32′N)] and detail sample information was presented in Table S1, of which Group 1 were collected from the ‘BTSC’ population, Group 2 were collected from the ‘BTZY’ population. All materials were grown under natural environmental conditions.
Sample collection and metabolite extraction
Young buds (300 g) with two leaves of every cultivar were collected and frozen in liquid nitrogen. All samples were stored at −80°C until metabolite extraction. Freeze-dried leaves were crushed using a mixer mill with a zirconia bead at 30 Hz for 1.5 min. For extraction, 100 mg of the powder was weighed and extracted overnight at 4°C with 1.0 mL of 70% aqueous methanol. Following centrifugation at 10,000 × g for 10 min, the extracts were absorbed on a CNWBOND Carbon-GCB SPE Cartridge (250 mg, 3 mL; ANPEL, Shanghai, China) and filtered (SCAA-104, 0.22 µm pore size; ANPEL, Shanghai, China) before LC–MS analysis (Zou et al. Citation2020).
Quality control measurements
Quality control (QC) was performed by mixing equal volumes of all samples to ensure reproducibility of the mass spectrometry (MS) results.
ESI-Q TRAP-MS/MS analyses
The sample extracts were analyzed by using an LC-ESI-MS/MS system (HPLC, Shim-pack UFLC SHIMADZU CBM30A system, www.shimadzu.com.cn/; MS, Applied Biosystems 4500 Q TRAP, http://www.appμliedbiosystems.com.cn/). The liquid chromatography analytical conditions were as follows: 5 µL of sample was injected into a Waters ACQUITY UPLC HSS T3 C18 (1.8 µm, 2.1 mm*100 mm). The HPLC mobile phase was 0.04% acetic acid in acetonitrile (solvent B) versus 0.04% acetic acid in Milli-Q water (solvent A). Separation was achieved with the following gradients: starting with 5% solvent B, raising to 95% B in 11 min, maintaining at 95% B for 1 min, dropped quickly to 5% B within 0.1 min and maintaining at 5% B for 3 min. The flow rate was 0.40 mL/min at a temperature of 40°C (Wang et al. Citation2018).
Linear ion trap (LIT) and triple quadrupole (QQQ) scans were acquired on a triple quadrupole-linear ion trap mass spectrometer (API 4500 Q TRAP LC/MS/MS System; Boston, USA) equipped with an ESI Turbo Ion Spray interface, operating in both positive and negative ion modes and controlled by Analyst 1.6.3 software (AB Sciex, Singapore). The ESI source operation parameters were as follows: ion source, turbo spray; source temperature, 550 °C; ion spray voltage (IS), 5500 V; and ion source gas I (GSI), gas II (GSII), curtain gas (CUR) set to 55, 60 and 25 psi, respectively. The collision activated dissociation (CAD) was set at ‘high’. Instrument tuning and mass calibration were performed with 10 and 100 µmol/L polypropylene glycol solutions in QQQ and LIT modes, respectively. QQQ scans were acquired via multiple reaction monitoring (MRM) experiments with collision gas (nitrogen) set to 5 psi. Declustering potential (DP) and collision energy (CE) were optimized for individual MRM transitions. A specific set of MRM transitions was monitored for each period according to the metabolites eluted within the period (Zou et al. Citation2020).
MS data and statistical analyses
MS data acquisition and processing were conducted as described previously (Chen et al. Citation2013). The analyses of the primary and secondary MS data were performed based on the self-built database MWDB (Metware Biotechnology Co., Ltd. Wuhan, China). Metabolite quantification was accomplished with data acquired in MRM mode by QQQ-MS (Wang et al. Citation2020). Principal component analysis (PCA) of sample pairs was conducted by the statistics function prcomp within R v3.5.0 (www.r-project.org). For better visualization and further analysis of the data, orthogonal projection to latent structures-discriminant analysis (OPLS-DA) was conducted by SIMCA v14.1 software. Metabolites with a fold change ≥2 or a fold change ≤0.5 were identified as up-regulated or down-regulated (Zou et al. Citation2020). Annotated metabolites were mapped to the Kyoto Encyclopedia of Genes and Genomes (KEGG) pathway database (http://www.kegg.jp/kegg/pathway.html) to determine pathway associations. Pathway enrichment analysis was performed on the web-based sever Metabolite Sets Enrichment Analysis (MSEA; http://www.msea.ca). Pathways with Bonferroni-corrected P-values ≤0.05 were considered significantly enriched.
Results
Comparison of morphological phenotypes between ‘BTSC’ and ‘BTZY’ varieties
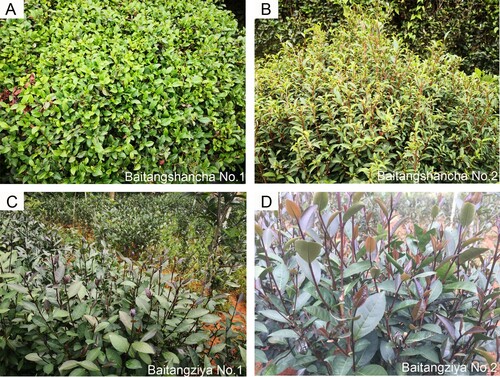
To effectively develop and utilize local tea plant resources, 9 green-leaf varieties derived from ‘BTSC’ population and 11 purple-leaf varieties derived from ‘BTZY’ population were selected to analyze the characteristics of flavonoids accumulation (Table S1). Significant morphological differences between ‘BTSC’ and ‘BTZY’ varieties were observed, especially focusing on the color of buds and leaves. Here, the ‘Baitangshancha NO.1’ and ‘Baitangshancha No.2’ varieties derived from the ‘BTSC’ group were typically presented, which exhibits green young leaves and rosiness in young stems (Figure (A,B)). In ‘BTZY’ group, ‘Baitangziya NO.1’ and ‘Baitangziya No.2’ varieties were presented. Compared with ‘BTSC’ group, their buds and young leaves were purple, however, the mature leaves on the lower part of the ‘BTZY’ varieties were green (Figure (C,D)).
Figure 1. The morphological phenotypes between ‘BTSC’ and ‘BTZY’ varieties. (A–B) the typical morphological phenotypes of ‘Baitangshancha No.1’ and ‘Baitangshancha No.2’ varieties derived from the ‘BTSC’ population. (C–D) the morphological phenotypes of ‘Baitangziya No.1’ and ‘Baitangziya No.2’ derived from the ‘BTZY’ population.
Metabolomics analyses and evaluation of MS data
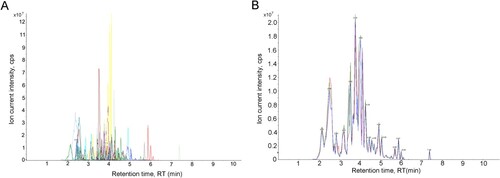
The MS data were analyzed by Analyst 1.6.3 software. The detection of metabolites was performed in MRM mode based on QQQ-MS, and the multiple peak detection plot of metabolites based on MRM mode is shown in Figure (A), which represents the ion current plot of multiple substances (the x-axis indicates retention time, and the y-axis indicates the ion current intensity). To evaluate the repeatability of the results for different samples, QC (quality control) was performed based on an equal mixture of all samples, where one QC sample was inserted after every 10 samples tested. The typical total ion current (TIC) plot represents a description of the total intensity of all ions in the mass spectrum at continuous time points. An overlay analysis was applied to the TIC plot of different QC samples to reveal technical repeatability. Figure (B) shows that the TIC plot of metabolites derived from different QC samples had consistent retention times and peak intensities. All these results indicated that the data of this study have good stability and reproducibility.
Figure 2. Analyses of stability and repeatability of the data detected in this study. (A) Multiple peak detection plot of metabolites by MRM mode; (B) Repeatability analyses by TIC overlapping of QC sample.
Metabolite identification and cluster analysis
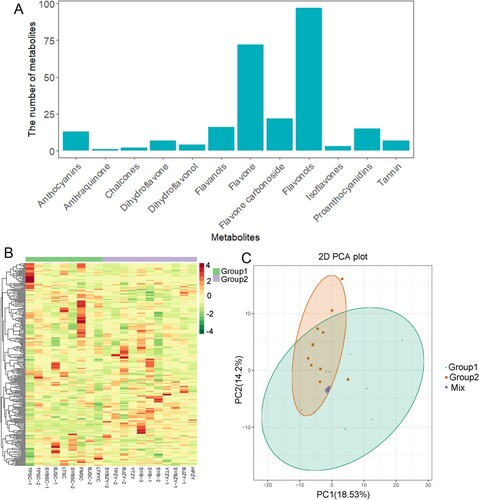
Metabolites were quantitatively counted based on gathering of secondary data by the MRM model. Based on the self-built database MWDB (Metware Biotechnology Co., Ltd. Wuhan, China), information about the content and structure of 259 metabolites found in ‘BTSC’ and ‘BTZY’ varieties was obtained (Table S2). According to the metabolome data, the metabolites identified include the following: 13 anthocyanins, 1 anthraquinone, 2 chalcones, 7 dihydroflavones, 4 dihydroflavonols, 16 flavanols, 72 flavones, 22 flavone carbonosides, 97 flavonols, 3 isoflavones, 15 proanthocyanidins and 7 tannins (Figure (A)). To avoid the effects of concentration on pattern recognition, the logarithm (log10) of the peak area matrix for each metabolite was used and, subsequently, hierarchical cluster analysis was performed. According to the results shown in Figure (B), ‘BTSC’ varieties and ‘BTZY’ varieties were not clearly divided into two categories, respectively. In addition, they were also not clearly separated in the PCA score plot between ‘BTSC’ and ‘BTZY’ metabolites (Figure (C)). These results indicated that there are minor differences in the content of flavonoids accumulation between ‘BTSC’ and ‘BTZY’ groups.
Figure 3. The metabolite identification and cluster analysis of ‘BTSC’ and ‘BTZY’ groups. (A) Profile of identified metabolites. (B) Cluster analysis between ‘BTSC’ and ‘BTZY’ groups based on the identified metabolites. (C) PCA plots of metabolites identified from ‘BTSC’ and ‘BTZY’ groups.
Differential flavonoids identification and functional enrichment
In the study, OPLS-DA was performed to facilitate the identification of differential metabolites between sample groups. The value of Q2 for ‘BTSC’ and ‘BTZY’ group was more than 0.8 (Figure (A)). Based on this algorithm, all the samples were placed within a confidence interval. All groups could be clearly separated according to this mode, indicating that the differential metabolites can be screened based on the variable importance in projection (VIP) obtained in OPLS-DA mode (Figure (A)). A measure combining the VIP value from OPLS-DA and fold change value was employed. We selected metabolites with a fold change ≥2 (up-regulated) or ≤0.5 (down-regulated), and these differential metabolites were filtered by the VIP value (VIP ≥1) from the OPLS-DA model. The results of differential flavonoids screening for each sample group were presented in a volcano plot and heatmap (Figure (B,C)). As result, there were 34 significantly different flavonoids in the ‘BTZY’ varieties compared to the ‘BTSC’ varieties (21 up-regulated, 13 down-regulated) (Figure (B,C), Table S3).
Figure 4. Differential flavonoids screening and functional enrichments between ‘BTSC’ and ‘BTZY’ group. (A) OPLS-DA score plots for pairwise comparison of flavonoids between ‘BTSC’ vs ‘BTZY’ groups. (B) Volcano plots presenting the differential flavonoid accumulation level between ‘BTSC’ vs ‘BTZY’ groups. (C) Accumulation patterns of flavonoids between ‘BTSC’ vs ‘BTZY’ groups. (D) KEGG enrichment of differential metabolites in the sample pool of ‘BTSC’ vs ‘BTZY’ groups.
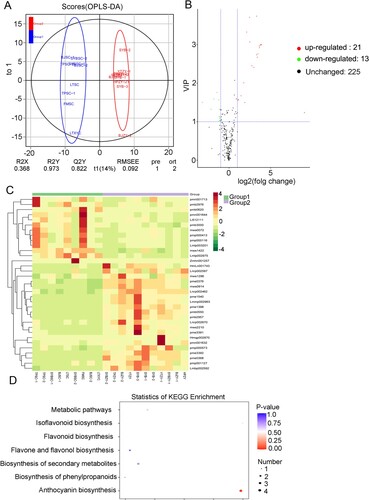
The KEGG metabolic pathway database is a powerful tool for performing metabolic network analysis, as it is a collection of manually drawn pathway maps representing our knowledge of the molecular network for metabolism. The results presented in Figure (D) were obtained using the KEGG metabolic pathway database, and shown that, in the sample pool of ‘BTSC’ vs ‘BTZY’ varieties, differential metabolites were mainly enriched into five KEGG pathways, including metabolic pathways, isoflavonoid biosynthesis, flavonoid biosynthesis, flavone and flavonol biosynthesis, biosynthesis of secondary metabolites, biosynthesis of phenylpropanoids and, particularly, anthocyanin biosynthesis (Figure (D)).
Bioactive components identified in purple-leaf tea
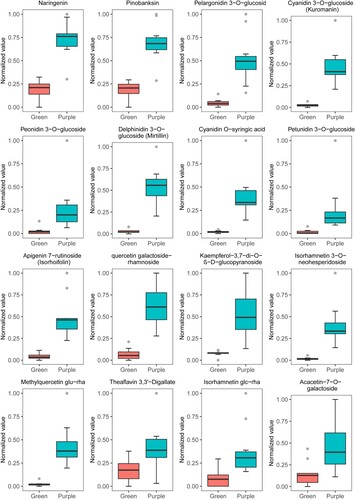
The quantitative data of mass spectrometry were standardized by range method, 16 significantly different flavonoids in purple- and green-leaf tea were selected for further analysis. The differences in accumulation are shown in Figure , including 1 dihydroflavone (naringenin), 1 dihydroflavonol (pinobanksin), 6 anthocyanins (pelargonidin 3-O-glucoside, cyanidin 3-O-glucoside, peonidin 3-O-glucoside, delphinidin 3-O-glucoside, cyanidin O-syringic acid and petunidin 3-O-glucoside), 2 flavones (apigenin 7-rutinoside and acacetin-7-O-galactoside), 5 flavonols (quercetin galactoside-rhamnoside, kaempferol-3,7-di-O-β-D-glucopyranoside, isorhamnetin 3-O-neohesperidoside, isorhamnetin glc-rha and methylquercetin glu-rha) and 1 tannin (tetragalloylglucose). Those results suggested that significant accumulation content of anthocyanins and flavonols in ‘BTZY’ varieties was detected compared to ‘BTSC’ varieties and show their availability for utilization and processing.
Figure 5. Differences in the contents of 16 flavonoids in purple- and green-leaf tea.
Discussion
Tea plants are significant economic species and are widely cultivated in tropical and subtropical regions worldwide (Chen et al. Citation2020). The unique leaf color of purple-leaf tea is caused by abundant anthocyanin accumulation and the pathways of biosynthesis and regulation of anthocyanin in tea plants have been well discussed (Kim et al. Citation2017; Kumari et al. Citation2019; Rothenberg et al. Citation2019; Wu et al. Citation2019; Chen et al. Citation2020; Zhu et al. Citation2020). In previous investigations, a group of naturally mutated purple-leaf tea germplasm, called ‘Baitangziyacha’, was found in China (Rothenberg et al. Citation2019). In fact, purple-leaf tea is now becoming more and more popular due to its delightful color and abundant accumulation in phenolic compounds and anthocyanins which are bioactive compounds beneficial to human health (Kerio et al. Citation2012; Hayat et al. Citation2015). In addition, rapidly developing metabolomic analyses, which directly reflect the outcomes of an organism’s response to the environment, have been used to identify and quantify secondary metabolites (Chen et al. Citation2013; Yang et al. Citation2019; Li et al. Citation2020; Zou et al. Citation2020; Chen et al. Citation2021). To investigate the availability of purple-leaf tea germplasms, we focused on flavonoids accumulation. In our study, purple-leaf and green-leaf germplasms from the Huizhou region of China (Table S1, Figure ), were used to investigate flavonoids accumulation pattern by widely targeted metabolomics.
As result, 259 secondary metabolites were characterized in the pool of ‘BTZY’ and ‘BTSC’ varieties, of which flavones and flavonols were the most abundant metabolites (more than 65%) (Figure (A)). Anthocyanins are the important pigments for determining tea color, and they are biosynthesized by the flavonoid pathway, improve health in humans, and protect plants against abiotic stress. The accumulation of anthocyanins in many plants has been studied extensively. The content of petunidin 3-O-glucoside and delphinidin 3-O-glucoside were increased with purple bud turning into green leaves (Li et al. Citation2021). Cyanidin 3-O-glucoside (92%) and pelargonidin 3-O-glucoside (8%) were the major anthocyanin components in the pericarp of Litchi (Zhang et al. Citation2000). Peonidin 3-O-glucoside was found to be one of the key anthocyanins in Chinese prickly ash cultivar (Zheng et al. Citation2020). In apple and pear, Cyanidin 3-galactoside is reportedly the major component (Ban et al. Citation2009; Zhang et al. Citation2010). The main anthocyanins that affect pericarp color in grapevine are peonidin derivatives and malvidin 3-O-glucoside (Liang et al. Citation2008). In Jujube leaf, cyanidin O-syringic acid exhibited high contents in the purple-leaf buds and decreased with the ripening process (Li et al. Citation2021). Thus, certain differences in anthocyanin components exist in different plants. In the present study, 13 anthocyanins were also identified, particularly, 6 anthocyanins were significantly accumulated in purple-leaf tea (Figure (A), Figure ). In plants, natural anthocyanins are present as their O-glycoside or C-glycoside forms (Xiao et al. Citation2016). In our results, 5 up-regulated anthocyanins in purple-leaf tea were O-glycoside except cyanidin O-syringic acid which was also existed only in red pericarp longan (Yi et al. Citation2021). In our results, the cyanidin O-syringic acid was the failure to accumulate in ‘BTSC’ varieties with green leaves (Figure ). Interestingly, the flowers of ‘BTSC’ varieties are naturally pink, and cyanidin O-syringic acid was exited in the pink flowers (Rothenberg et al. Citation2019). Therefore, O-glycosidic anthocyanins, including petunidin 3-O-glucoside, pelargonidin 3-O-glucoside, cyanidin 3-O-glucoside, peonidin 3-O-glucoside, delphinidin 3-O-glucoside, and cyanidin O-syringic acid were the primary anthocyanin components in purple leaves in ‘BTZY’ varieties. The presence of these anthocyanins appears to be the reason for the pink coloration of the flowers or purple leaves (Rothenberg et al. Citation2019).
Flavones are the product of flavanone, produced via a reaction catalyzed by flavone synthase (FNS) (Koes et al. Citation1994). In the present investigation, 2 flavones were significantly up-regulated in the germplasms of ‘BTZY’ varieties, including apigenin 7-rutinoside and acacetin-7-O-galactoside (Figure ). Apigenin 7-rutinoside, which is a flavonoid found primarily in citrus fruits, apple, parsley and celery leaves and shown to have a variety of pharmacological effects, was primarily accumulated in the purple-leaf varieties (Figure ) (Dugo et al. Citation2005). Flavonols are one of the products of dihydroflavonol, produced via a reaction catalyzed by flavonol synthase (FLS) (Koes et al. Citation1994; Ferreyra et al. Citation2012). Another major up-regulated product of flavonoids was flavonols in ‘BTZY’ varieties compared to ‘BTSC’ varieties (5 flavonols were significant up-accumulation, Figure ), of which 4 flavonols were significantly up-regulated in purple leaves, including quercetin galactoside-rhamnoside, kaempferol-3,7-di-O-β-D-glucopyranoside, isorhamnetin 3-O-neohesperidoside, and methylquercetin glu-rha (Figure ). Recent reports confirm that high levels of flavonols have existed in fruits, vegetables, tea and so on (Schmitzer et al. Citation2010; Ahmed and Eun Citation2018). Flavonols are a unique class of flavonoids which are existed in most green and black tea, which contribute to the astringent and bitter taste of tea (Cui et al. Citation2016; Zhuang et al. Citation2020). In addition, a dihydroflavonol that is the key metabolite responsible for biosyntheses of flavonols and anthocyanins was up-regulated in ‘BTZY’ varieties, which is a natural population of purple-leaf tea with pink flowers and a higher anthocyanin content than common cultivars (Rothenberg et al. Citation2019). Overall, metabolomics analyses showed that many abundant flavonols and anthocyanins significantly accumulated in ‘BTZY’ varieties with purple leaves.
Conclusion
In this study, the flavonoids accumulation pattern of local ‘BTZY’ varieties with purple young leaves and ‘BTSC’ varieties with green young leaves were compared by widely targeted metabolomic analyses. The results suggested that, compared with ‘BTSC’ varieties, the ‘BTZY’ varieties showed high accumulation of flavonoids, such as flavones, flavonols, dihydroflavone, dihydroflavonol and anthocyanins. Particularly, 5 type major anthocyanins and 4 type flavonols components were characterized in the ‘BTZY’ varieties. This study will be useful for the further breeding and processing of the local germplasms of tea plants.
Acknowledgements
This research was funded by discipline team building projects of Guangdong Academy of Agricultural Sciences in the 13th Five-year period (201627TD), Guangdong Provincial Key Laboratory of Tea Plant Resources Innovation & Utilization and Development and extension project of excellent and characteristic organic agriculture in Boluo County in 2018.
Disclosure statement
No potential competing interest was reported by the authors.
Data availability statement
The following information was supplied regarding data availability:
All the raw data are available in Figshare.
(https://figshare.com/articles/dataset/Table_S1_xlsx/15081540),
(https://figshare.com/articles/dataset/Table_S2_xlsx/15081552),
(https://figshare.com/articles/dataset/Table_S3_xlsx/15081555).
Additional information
Funding
References
- Ahmed M, Eun JB. 2018. Flavonoids in fruits and vegetables after thermal and nonthermal processing: a review. Crit Rev Food Sci. 58(18):3159–3188.
- Ban Y, Kondo S, Ubi BE, Honda C, Bessho H, Moriguchi T. 2009. UDP-sugar biosynthetic pathway: contribution to cyanidin 3-galactoside biosynthesis in apple skin. Planta. 230(5):871–881.
- Butu M, Rodino S, Butu A, Butnariu M. 2014. Screening of bioflavonoidand antioxidant activity of Lens Culinaris Medikus. Dig J Nanomater Bios. 9:519–529.
- Chen W, Gong L, Guo Z, Wang W, Zhang H, Liu X, Yu S, Xiong L, Luo J. 2013. A novel integrated method for large-scale detection, identification, and quantification of widely targeted metabolites: application in the study of rice metabolomics. Mol Plant. 6(6):1769–1780.
- Chen X, Wang P, Zheng Y, Gu M, Lin X, Wang S, Jin S, Ye N. 2020. Comparison of metabolome and transcriptome of flavonoid biosynthesis pathway in a purple-leaf tea germplasm ‘Jinmingzao’ and a Green-leaf tea germplasm ‘Huangdan’ reveals their relationship with genetic mechanisms of color formation. Int J Mol Sci. 21(11):4167.
- Chen X, Yu H, Zhu J, Chen Y, Fu Z, Zhao Y, Yu Y, Chen X, Li X, Ma Q. 2021. Widely targeted metabolomic analyses of albino tea germplasm ‘Huabai 1’ and ‘Baiye 1’. All Life. 14(1):530–540.
- Cui L, Yao S, Dai X, Yin Q, Liu Y, Jiang X, Wu Y, Qian Y, Pang Y, Gao L, Xia T. 2016. Identification of UDP-glycosyltransferases involved in the biosynthesis of astringent taste compounds in tea (Camellia sinensis). J Exp Bot. 67(8):2285–2297.
- Dugo P, Presti ML, Ohman M, Fazio A, Dugo G, Mondello L. 2005. Determination of flavonoids in citrus juices by micro-HPLC-ESI/MS. J Sep Sci. 28(11):1149–1156.
- Dwyer JT, Peterson J. 2013. Tea and flavonoids: where we are, where to go next. Am J Clin Nutr. 98(6 Suppl):1611S–1618S.
- Fan FY, Huang CS, Tong YL, Guo HW, Zhou SJ, Ye JH, Gong SY. 2021. Widely targeted metabolomics analysis of white peony teas with different storage time and association with sensory attributes. Food Chemi. 362:130257.
- Ferreyra MLF, Rius SP, Casati P. 2012. Flavonoids: biosynthesis, biological functions and biotechnological applications. Front Plant Sci. 3(222):222.
- Hayat K, Iqbal H, Malik U, Bilal U, Mushtaq S. 2015. Tea and its consumption: benefits and risks. Crit Rev Food Sci Nutr. 55(7):939–954.
- He X, Zhao X, Gao L, Shi X, Dai X, Liu Y, Xia T, Wang Y. 2018. Isolation and characterization of key genes that promote flavonoid accumulation in purple-leaf tea (Camellia sinensis L.). Sci Rep. 8:130.
- Hsu CP, Shih YT, Lin BR, Chiu CF, Lin CC. 2012. Inhibitory effect and mechanisms of an anthocyanins- and anthocyanidins-rich extract from purple-shoot tea on colorectal carcinoma cell proliferation. J Agric Food Chem. 60(14):3686–3692.
- Hu J, Zhou D, Chen Y. 2009. Preparation and antioxidant activity of green tea extract enriched in epigallocatechin (EGC) and epigallocatechin gallate (EGCG). J Agr Food Chem. 57(4):1349–1353.
- Ivey KL, Jensen MK, Hodgson JM, Eliassen AH, Cassidy A, Rimm EB. 2017. Association of flavonoid-rich foods and flavonoids with risk of all-cause mortality. Br J Nutr. 117(10):1470–1477.
- Joshi R, Rana A, Gulati A. 2015. Studies on quality of orthodox teas made from anthocyanin-rich tea clones growing in Kangra valley, India. Food Chem. 176:357–366.
- Kerio LC, Wachira FN, Wanyoko JK, Rotich MK. 2012. Characterization of anthocyanins in Kenyan teas: extraction and identification. Food Chem. 131(1):31–38.
- Kilel EC, Faraj AK, Wanyoko JK, Wachira FN, Mwingirwa V. 2013. Green tea from purple leaf coloured tea clones in Kenya-their quality characteristics. Food Chem. 141(2):769–775.
- Kim S, Hwang G, Lee S, Zhu JY, Paik I, Nguyen TT, Kim J, Oh E. 2017. High ambient temperature represses anthocyanin biosynthesis through degradation of HY5. Front Plant Sci. 8:1787.
- Koes RE, Quattrocchio F, Mol JNM. 1994. The flavonoid biosynthetic pathway in plants function and evolution. Bioessays. 16(2):123–132.
- Kumari M, Thakur S, Kumar A, Joshi R, Kumar P, Shankar R, Kumar R. 2019. Regulation of color transition in purple tea (Camellia sinensis). Planta. 251(1):35.
- Lee CC, Shen SR, Lai YJ, Wu SC. 2013. Rutin and quercetin, bioactive compounds from tartary buckwheat, prevent liver inflammatory injury. Food & Funct. 4(5):794.
- Lei Z, Huhman DV, Sumner LW. 2011. Mass spectrometry strategies in metabolomics. J Biol Chem. 286(29):25435–25442.
- Li J, Hossain MS, Ma H, Yang Q, Gong X, Yang P, Feng B. 2020. Comparative metabolomics reveals differences in flavonoid metabolites among different coloured buckwheat flowers. J Food Compos Anal. 85(2020):103335.
- Li S, Deng B, Tian S, Guo M, Liu H, Zhao X. 2021. Metabolic and transcriptomic analyses reveal different metabolite biosynthesis profiles between leaf buds and mature leaves in Ziziphus jujuba mill. Food Chem. 347:129005.
- Liang Z, Wu B, Fan P, Yang C, Duan W, Zheng X, Liu C, Li S. 2008. Anthocyanin composition and content in grape berry skin in Vitis germplasm. Food Chem. 111(4):837–844.
- Long L, Liu J, Gao Y, Xu FC, Zhao JR, Li B, Gao W. 2019. Flavonoid accumulation in spontaneous cotton mutant results in red coloration and enhanced disease resistance. Plant Physiol Biochem. 143:40–49.
- Mamati GE, Liang Y, Lu J. 2006. Expression of basic genes involved in tea polyphenol synthesis in relation to accumulation of catechins and total tea polyphenols. J Sci Food Agr. 86(3):459–464.
- Nabavi SM, Samec D, Tomczyk M, Milella L, Russo D, Habtemariam S, Suntar I, Rastrelli L, Daglia M, Xiao J, et al. 2020. Flavonoid biosynthetic pathways in plants: versatile targets for metabolic engineering. Biotechnol Adv. 38:107316.
- Ng KW, Cao ZJ, Chen HB, Zhao ZZ, Zhu L, Yi T. 2018. Oolong tea: a critical review of processing methods, chemical composition, health effects, and risk. Crit Rev Food Sci Nutr. 58(17):2957–2980.
- Obst K, Paetz S, Backes M, Reichelt KV, Ley JP, Engel KH. 2013. Evaluation of unsaturated alkanoic acid amides as maskers of epigallocatechin gallate astringency. J Agric Food Chem. 61(18):4242–4249.
- Qadir MI. 2017. Role of Green tea flavonoids in cancer prevention. Crit Re Eukar Gene. 27(2):844–854.
- Rashid K, Wachira FN, Nyabuga JN, Wanyonyi B, Murilla G, Isaac AO. 2014a. Kenyan purple tea anthocyanins ability to cross the blood brain barrier and reinforce brain antioxidant capacity in mice. Nutr Neurosci. 17(4):178–185.
- Rashid K, Wachira FN, Nyariki JN, Isaac AO. 2014b. Kenyan purple tea anthocyanins and coenzyme-Q10 ameliorate post treatment reactive encephalopathy associated with cerebral human African trypanosomiasis in murine model. Parasitol Int. 63(2):417–426.
- Rothenberg DO, Yang H, Chen M, Zhang W, Zhang L. 2019. Metabolome and transcriptome sequencing analysis reveals anthocyanin metabolism in pink flowers of anthocyanin-rich tea (Camellia sinensis). Molecules. 24(6):1064.
- Saito K, Yonekura-Sakakibara K, Nakabayashi R, Higashi Y, Yamazaki M, Tohge T, Fernie AR. 2013. The flavonoid biosynthetic pathway in Arabidopsis: structural and genetic diversity. Plant Physiol Biochem. 72:21–34.
- Saito T, Honma D, Tagashira M, Kanda T, Nesumi A, Maeda-Yamamoto M. 2011. Anthocyanins from new red leaf tea ‘Sunrouge’. J Agric Food Chem. 59(9):4779–4782.
- Sawada Y, Akiyama K, Sakata A, Kuwahara A, Otsuki H, Sakurai T, Saito K, Hirai M. 2009. Widely targeted metabolomics based on large-scale MS/MS data for elucidating metabolite accumulation patterns in plants. Plant Cell Physiol. 50(1):37–47.
- Schmitzer V, Slatnar A, Mikulic-Petkovsek M, Veberic R, Krska B, Stampar F. 2010. Comparative study of primary and secondarymetabolites in apricot (Prunus armeniaca L.) cultivars. Journal Sci Food Agr. 91(5):860–866.
- Wang D, Zhang L, Huang X, Wang X, Yang R, Mao J, Wang X, Wang X, Zhang Q, Li P. 2018. Identification of nutritional components in black sesame determined by widely targeted metabolomics and traditional Chinese medicines. Molecules. 23(5):1180.
- Wang F, Huang Y, Wu W, Zhu C, Zhang R, Chen J, Zeng J. 2020. Metabolomics analysis of the peels of different colored citrus fruits (Citrus reticulata cv. ‘Shatangju’) during the maturation period based on UHPLC-QQQ-MS. Molecules. 25(2):396.
- Wang H, Hua J, Yu Q, Li J, Wang J, Deng Y, Yuan H, Jiang Y. 2021. Widely targeted metabolomic analysis reveals dynamic changes in non-volatile and volatile metabolites during Green tea processing. Food Chem. 363:130131.
- Wang W, Zhang L, Wang S, Shi S, Jiang Y, Li N, Tu P. 2014. 8-C N-ethyl-2-pyrrolidinone substituted flavan-3-ols as the marker compounds of Chinese dark teas formed in the post-fermentation process provide significant antioxidative activity. Food Chem. 152:539–545.
- Wu LY, Fang ZT, Lin JK, Sun Y, Du ZZ, Guo YL, Liu JH, Liang YR, Ye JH. 2019. Complementary iTRAQ proteomic and transcriptomic analyses of leaves in tea plant (Camellia sinensis L.) with different maturity and regulatory network of flavonoid biosynthesis. J Proteome Res. 18(1):252–264.
- Xiao J, Capanoglu E, Jassbi AR, Miron A. 2016. Advance on the flavonoid C-glycosides and health benefits. Crit Rev Food Sci Nutr. 56(Suppl 1):S29–S45.
- Yang M, Yang J, Su L, Sun K, Li D, Liu Y, Wang H, Chen Z, Guo T. 2019. Metabolic profile analysis and identification of key metabolites during rice seed germination under low-temperature stress. Plant Sci. 289:110282.
- Yang TTC, Koo MWL. 1997. Hypocholesterolemic effects of Chinese tea. Pharmacol Res. 35(6):505–512.
- Yi D, Zhnag H, Lai B, Liu L, Pan X, Ma Z, Wang Y, Xie J, Shi S, Wei Y. 2021. Integrative analysis of the coloring mechanism of red longan pericarp through metabolome and transcriptome analyses. J Agr Food Chem. 69(6):9.
- Zhang D, Quantick P, Grigor J. 2000. Changes in phenolic compounds in Litchi (Litchi chinensis sonn.) fruit during postharvest storage. Postharvest Bio Tech. 19(2):165–172.
- Zhang X, Allan A C, Yi Q, Chen L, Li K, Shu Q, Su J. 2010. Differential gene expression analysis of Yunnan red pear, Pyrus pyrifolia, during fruit skin coloration. Plant Mol Bio Rep. 29(2):305–314.
- Zhang Y, Butelli E, Martin C. 2014. Engineering anthocyanin biosynthesis in plants. Curr Opin Plant Biol. 19:81–90.
- Zhang Y, Liu D. 2011. Flavonol kaempferol improves chronic hyperglycemia-impaired pancreatic beta-cell viability and insulin secretory function. Eur J Pharmacol. 670(1):325–332.
- Zhao X, Zeng X, Lin N, Yu S, Fernir A, Zhao J. 2021. CsbZIP1-CsMYB12 mediates the production of bitter-tasting flavonols in tea plants (Camellia sinensis) through a coordinated activator–repressor network. Hortic Res. 8:110.
- Zheng T, Zhang Q, Su KX, Liu SM. 2020. Transcriptome and metabolome analyses reveal the regulation of peel coloration in green, red Chinese prickly ash (Zanthoxylum L.). Food Chem. 1:100004.
- Zhu J, Xu Q, Zhao S, Xia X, Yan X, An Y, Mi X, Guo L, Samarina L, Wei C. 2020. Comprehensive co-expression analysis provides novel insights into temporal variation of flavonoids in fresh leaves of the tea plant (Camellia sinensis). Plant Sci. 290:110306.
- Zhuang J, Dai X, Zhu M, Zhang S, Dai Q, Jiang X, Liu Y, Gao L, Xia T. 2020. Evaluation of astringent taste of green tea through mass spectrometry-based targeted metabolic profiling of polyphenols. Food Chem. 305:125507.
- Zou S, Wu J, Shahid MQ, He Y, Lin S, Liu Z, Yang X. 2020. Identification of key taste components in loquat using widely targeted metabolomics. Food Chem. 323:126822.