
Abstract
Compelling evidence suggests that immune infiltration is involved in the occurrence of OC. In addition, previous studies demonstrated the effect of Tumor-infiltrating Immune Cells (TIICs) on the development of OC. However, few studies have found the immune genomic profile and immune subclasses of OC based on transcriptome data, which may help to optimally stratify patients who respond to immunotherapy. The present study used unsupervised hierarchical clustering to identify three immunogenomic subgroups, termed hyperimmunogenic (Immunity_H), moderately immunogenic (Immunity_M) and hypoimmunogenic (Immunity_L), based on two publicly available OC transcriptomics datasets. Each subtype was associated with specific pathways. Furthermore, the Immunity_H subtype had higher levels of immune cell infiltration, antitumor immunoreactivity and better survival prognosis compared to the other subtypes. The potential chemotherapeutic targets for OC were assessed in the GDSC dataset. Several potential drug targets for the treatment of OC were identified, including Parthenolide and the AKT inhibitor VIII, Paclitaxel. In addition, the Immunity_H subgroup had an early FIGO stage and was more likely to respond to immunotherapy. The characterization of immune-based OC subgroups may provide useful insights for the treatment of OC and has the potential to guide personalized treatment of OC patients through immunotherapy.
Introduction
Ovarian Cancer (OC) is the second most common type of cancer in women and among the leading cause of cancer-related deaths worldwide (Ovarian Epithelial, Fallopian Tube and Primary Peritoneal Cancer Treatment (PDQ(R)): Health Professional Version Citation2002; Arora et al. Citation2021). In addition, approximately 22,530 new cases of OC and 13,980 deaths were reported from the cancer in 2019 alone (Bray et al. Citation2018; Siegel et al. Citation2019). Considering that the ovaries are located in the pelvic cavity, early symptoms are often not obvious therefore about half of the patients are diagnosed in the late stages of the disease. As a result, OC has the worst prognosis among all the gynecological tumors and the 5-year survival rate is still less than 45% in most countries (Jessmon et al. Citation2017). Moreover, there is still a considerable gap in the prognosis of the disease despite significant advances in surgery and chemotherapy. Notably, several studies have shown that OC is an immunogenic disease and it is therefore important to understand how immune cells are involved in the tumor microenvironment during the development of the cancer (Thomas et al. Citation2016; Perales-Puchalt et al. Citation2019; Hoogstad-van Evert et al. Citation2020).
Tumor inflammation plays a vital role in the occurrence and development of cancer. Additionally, multiple studies have demonstrated that Tumor-infiltrating Immune Cells (TIIC) can help the host resist cancer cells and promote the development of solid tumors (Chifman et al. Citation2016; Kather et al. Citation2019; Maby et al. Citation2020), especially in OC (MacGregor et al. Citation2019; Tu et al. Citation2020). It was also reported that the progression of ovarian cancer requires the co-evolution of neoplastic cells as well as the adjacent microenvironment (Zheng et al. Citation2020). Moreover, increasing evidence suggests that activated CD4 memory T cells are associated with better prognosis in various types of cancer, including non-small cell lung cancer, pancreatic adenocarcinomas, breast and cervical cancer (Li et al. Citation2020). In addition, the recent discovery of immunotherapy presented a promising approach for the treatment of cancer. Immunotherapy can also help in overcoming the challenge of drug resistance. Notably, immunotherapy has yielded satisfactory results in some types of cancer (e.g. malignant melanoma) although its efficacy in OC remains largely unclear (Koller et al. Citation2016; Kwiatkowska et al. Citation2019). Nonetheless, immunotherapy may be a promising option for adjuvant therapy in OC (as in the VITAL trial) and for the treatment of relapsed/progressive disease (Rocconi et al. Citation2020). Therefore, it is worth exploring the effect of immunotherapy in OC given that the treatment options for this disease are very limited. Furthermore, immunotherapy was shown to be beneficial in less than 20% of cancer patients, suggesting that not all OC patients respond to the treatment (Odunsi Citation2017; Wang et al. Citation2019). Our results also indicate that the molecular subtypes of OC possess distinct immune phenotypes. The current research also provides theoretical foundation for immunotherapy strategy against OC.
Results
Identification of immunogenomic subtypes of OC
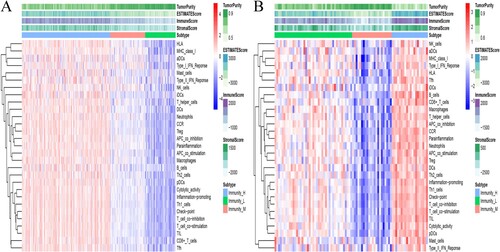
First, a set of 29 immune-related genes that represent multiple immune cell types, functions and pathways was downloaded (Supplementary Table 1). Second, the ssGSEA method was used to estimate the enrichment scores of immune cells in tumor samples. Third, immunogenomic OC subtypes were identified through unsupervised cluster analysis of the OC datasets. The two datasets gave similar clustering results, where three clusters were obtained, namely; hyperimmunogenic (Immunity_H), moderately immunogenic (Immunity_M) and hypoimmunogenic (Immunity_L) (Figure (A,B)).
Figure 1. Three clusters were identified through unsupervised hierarchical clustering of two public datasets. (A) The TCGA and (B) the ICGC OC cohort.
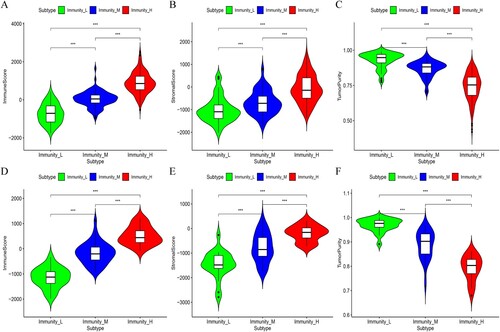
In addition, the stromal and immune scores in the Immunity_H subset were significantly higher in both data sets, while the Immunity_L subset had significantly higher tumor purity (Kruskal–Wallis test, p < 0.05) (Figure (A–F)). These findings indicated that the Immunity_H subtype had a higher percentage of immune and stromal cells while the Immunity_L subtype had a higher proportion of tumor cells.
Figure 2. The immune score, stromal score and tumor purity were compared among the three subgroups of OC. A-F: Immune score, stromal score and tumor purity in the TCGA and ICGC OC cohorts, respectively.
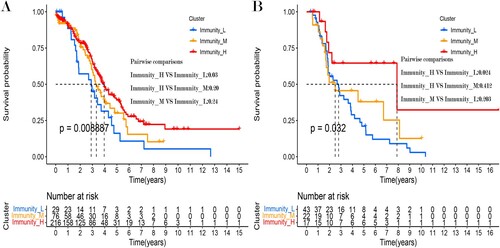
Moreover, the results of survival analysis showed that these OC subtypes had different clinical outcomes. Notably, the Immunity_H subtype had a better survival prognosis than the Immunity_M and Immunity_L subtypes in both datasets. Meanwhile, there were also survival difference between the Immunity_H and Immunity_L subtypes in the ICGC dataset (Figure (A,B)).
Figure 3. Kaplan-Meier curves showing differences in the (A) TCGA and (B) ICGC datasets.
Comparison of HLA and the immune checkpoint among the three OC subtypes
It is noteworthy that T-cell responses to autoantigens are eliminated during thymic T-cell development. However, T-cells are preserved for exogenous antigenic responses by their Human Leukocyte Antigen-presenting (HLA) molecules. The HLA locus is located on chromosome 6 and covers a 7.6 Mb region that contains more than 250 highly polymorphic genes. The region is divided into three sub-regions, namely; class I, II and III, all of which have distinct functions. It was reported that the HLA complex is one of the most important components of the immune system (Althaf et al. Citation2017; van Drongelen and Holoshitz Citation2017). Moreover, Feng et al. reported that the expression of HLA-F was positively correlated with the malignant phenotype and negatively associated with OS (Feng et al. Citation2019). In addition, serum HLA-g was related to tumor size, degree of differentiation, capsular invasion and lymph node metastasis in thyroid carcinoma (Tan et al. Citation2021). Halle et al. also demonstrated that HLA-DQB1 is a potential biomarker that may guide the treatment of cervical cancer (Halle et al. Citation2021). Additionally, most of the HLA-associated genes were linked to the occurrence and the immune environment of Ovarian Cancer (Andersson et al. Citation2016; Schwich et al. Citation2019; Ullah et al. Citation2019). In the current study, the HLA-associated genes were significantly highly expressed in the Immunity_H subtype although they were expressed in significantly lower levels in the Immunity_L subgroup (Kruskal–Wallis test, p < 0.05, Figure (A,C)).
Figure 4. The expression of HLA related genes (A, C: TCGA and ICGC OC cohort) and immune cell subpopulation marker genes (B, D: TCGA and ICGC OC cohort) was compared among the three OC subtypes.
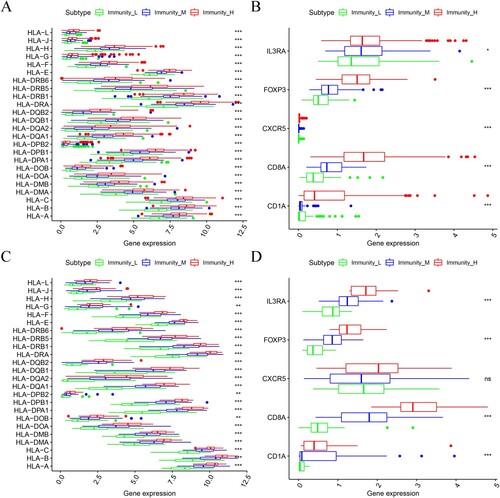
Similar results were obtained in the expression levels of various immune cell marker genes such as IL3RA (pDC), FOXP3 (Treg), CXCR5 (Tfh cells), CD1A (iDC) and CD8A (cytotoxic T cells) (Figure (B,D)). Notably, the highest levels of marker gene expression were observed in the Immunity_H subtype while the lowest levels were identified in the Immunity_L subgroup. These findings further proved that the Immunity_H subtype had a higher level of immune cell infiltration.
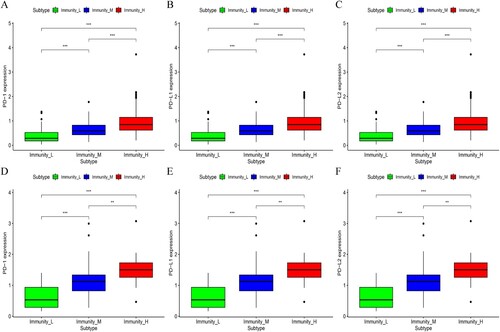
Moreover, the study analyzed the expression of the PD-L1 (Programmed Death-Ligand 1), PD1 (benzoate dehydratase 1) and PD-L2 (Programmed Death-ligand 2) genes in the three OC subtypes, in two datasets. The findings showed that the Immunity_H subtype had the highest expression of PD-L1, PD1 and PD-L2 while the Immunity_L subtype had the lowest expression of the genes (Kruskal–Wallis test, p <0.05, Figure (A–F)). Based on the above results, it is possible that the Immunity_H subtype of OC may respond better to PD-L1 immunotherapy given that the expression of PD-1/PD-L1 was positively correlated with in vivo immune responses (Patel and Kurzrock Citation2015).
Figure 5. The expression of PD-1, PD-L1 and PD-L2 was compared among the three subtypes of OC in the (A–C) TCGA and (D–F) ICGC datasets.
Identification of subtype-specific immune cell infiltration patterns in the three OC subsets
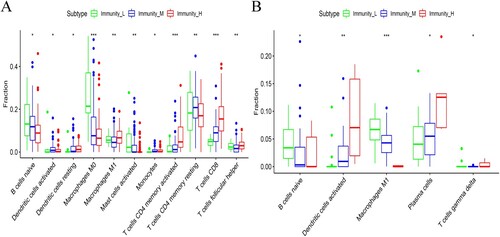
The CIBERSOFT method, through gene expression profiling was applied to evaluate the proportion of LM22 infiltration in OC samples. The results revealed that there were significant differences between the OC subtypes in 11 out of the 22 immune cells. The following cells were activated in the Immunity_H subgroup; activated dendritic cells, M1 macrophages, CD8 T-cells, follicular helper T-cells and CD4 memory T-cells. However, there was a significant decrease in the number of monocytes in the Immunity_L subgroup, in the TCGA dataset (Figure (A)). In the ICGC dataset, differences between the OC subtypes were only observed in 5 out of the 22 immune cells. Notably, there was an increase in the number of activated dendritic cells and plasma cells in the Immunity_H subgroup. On the other hand, there was a decrease in the number of monocytes and regulatory T-cells (Treg) in the Immunity_L subtype (Figure (B)). These results similarly showed that the Immunity_H subtype was rich in immune cells.
Figure 6. Differences in the composition of immune cell subgroups between the three OC subtypes in the (A) TCGA and (B) ICGC datasets.
Clinical characteristics of OC subtypes
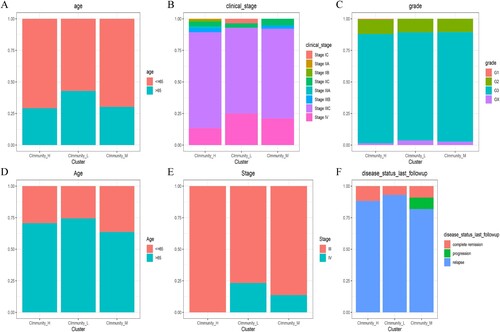
With regard to clinical features, the Immunity_H subtype was associated with a younger population (Aged less than 65) and an earlier FIGO TNM stage compared to the Immunity_L subgroup, in the TCGA dataset. In addition, patients in the Immunity_L subgroup were at an advanced FIGO TNM stage (Figure (A–C)). Similar results were obtained in the ICGC data set where the Immunity_H subtype was shown to be associated with a younger population (Age less than 65) and an earlier FIGO TNM stage compared to the Immunity_L subgroup. Moreover, the Immunity_H subtype was associated with a higher degree of complete remission during follow-up while the Immunity_L subgroup was linked to a higher rate of relapse. Furthermore, patients in the Immunity_L subset were mainly at FIGO stage II while those in the Immunity_H subgroup were at FIGO stage IV (Figure (D–F)).
Figure 7. Comparison of clinical features between the Immune-H and Immune-L subsets of OC in the TCGA and ICGC datasets. (A) Age, (B) FIGO TNM stage and (C) Grade, for each subtype in the TCGA dataset. (D) Age, (E) FIGO TNM stage and (F) disease status at last follow up, in the ICGC dataset.
Identification of subtype-specific GO and KEGG pathways
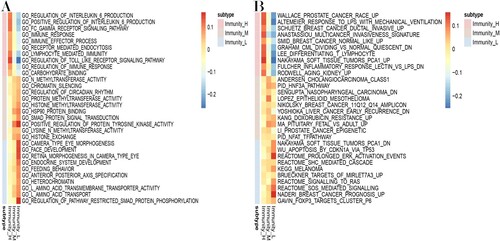
In this study, GSEA analysis was used to reveal the subtype-specific GO and KEGG pathways, in the TCGA dataset (Figure (A,B)). Several immune-associated GO categories were enriched in the Immunity_H subtype, including immune response, immune effector process and regulation of immune response. Compared to the Immunity_H subtype, endocrine system development, heterochromatin and amino acid transport were activated in the Immunity_L subset. Similarly, the cancer-associated KEGG pathways were highly activated in the Immunity_H subclass and included Wallace prostate cancer, Schuetz breast cancer and multicancer invasiveness signature. In contrast, the Immunity_L subtype was predominantly associated with pathways related to ARGETS of MIRLET7A3, APOPTOSIS by CDKN1A via TP53 and Breast cancer prognosis. Similar results were found in the ICGC dataset (Supplementary Figure 1A,B). These findings further confirmed that there was increased immunoreactivity in the Immunity_H subtype.
Figure 8. OC subtype-specific enrichment of (A) GO and (B) KEGG terms among the three subtypes of OC, revealed using the GSEA method in the TCGA dataset. (C). GSVA showed differences in the enriched KEGG pathways between the Immunity_H and Immunity_L subgroups of the TCGA dataset.
The correlation between the immune subgroup and somatic variants
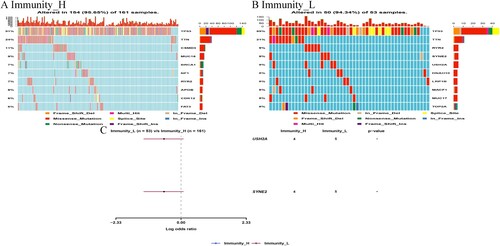
The study evaluated the distribution of somatic variants in OC driver genes between the low and high immune subgroups. Therefore, the OC driver genes were evaluated using the ‘maftools’ package in R (Supplementary Table 2). Thereafter, the top 25 driver genes with the highest frequency of mutation were analyzed further. The results revealed highly mutated genetic profiles, as shown in Figure (A,B). Analysis of the mutation annotation files in the TCGA cohort also showed that the frequency of mutations in USH2A, TP53, MUC16, CSMD3, TOP2A, TTN, NF1, RYR2, HMCN1 and FAT3 was significantly different between the low and high immune subtypes (chi-square test; Table ).
Figure 9. Correlation between the immune ((A) Immune-H and (B) Immune-L OC subsets) subgroups and somatic variants in the TCGA dataset.
Prediction of response to immunotherapy and anti-cancer drugs
Immunotherapy using monoclonal antibodies against the Immune Checkpoint Inhibitor (ICPC) may potentially be used to treat OC. In this study, the TIDE algorithm was used to show that patients in the Immunity_H subgroup would respond better to treatment with ICPC compared to those in the Immunity_L category (p<0.05). Moreover, the expression profiles of the OC subtypes were compared to a previously published dataset using the Submap algorithm, for the specific immune checkpoint. The findings suggested that patients in the Immunity_H subgroup were highly sensitive to Programmed Cell Death 1 (PD1) immunotherapy (Bonferroni correction p<0.05) as shown in Figure (A).
Figure 10. Prediction of response to immunotherapy and anti-cancer drugs. The box plots shows the estimated IC50 for chemotherapeutic drugs, using the GDSC database: (A) for the Immune-H and Immune-L OC subsets. (B) The Submap algorithm revealed that the Immune-H subtype was more sensitive to immunotherapy (Bonferroni-corrected p < 0.05).
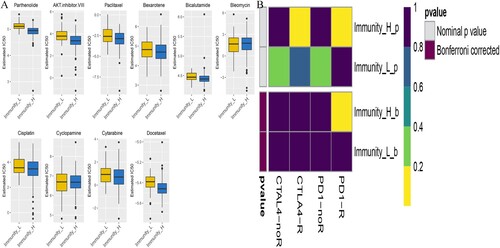
Additionally, anti-tumor drug therapy is one of the mainstream treatments for patients with OC. Herein, the prediction model was employed to assess response to anti-cancer drugs in the two molecular subgroups, based on the GDSC cell line dataset. In addition, the prediction accuracy of the approach was confirmed through 10-fold cross-validation and the response sensitivity was estimated using IC50. Out of the 138 types of anti-cancer drugs, 85 showed differences between the Immunity_H and Immunity_L subtypes (Supplementary Table 3). Moreover, the results suggested that the Immunity_H subtype was more sensitive to these drugs than the Immunity_L subgroup. The findings also showed that Parthenolide and the AKT inhibitor VIII, Paclitaxel had great potential in the treatment of OC (p<0.05), as shown in Figure (B). Notably, Paclitaxel is a first-line form of chemotherapy that is widely used in clinical practice.
Discussion
Ovarian cancer still has the worst prognosis among the gynecological tumors and it is therefore necessary to find new therapeutic targets to improve the prognosis of OC. It is also important to explore the role of immune infiltration in OC (Weidle et al. Citation2016; De La Motte Rouge et al. Citation2019; MacGregor et al. Citation2019). Immune cells ideally recognize and attack cancer cells, to inhibit their growth. However, cancer cells have evolved an immune escape mechanism, making tumor initiation and progression extremely complex. The results from the present study showed that the tumor microenvironment, especially immune cells, plays a vital role in the occurrence and development of ovarian cancer.
Moreover, accumulating evidence suggests that immune infiltration is related to the prognosis of ovarian cancer (Alcaraz-Sanabria et al. Citation2019; Liu et al. Citation2020 oct). The tumor immune microenvironment is a complex system, therefore understanding the mechanisms of TIIC in tumors may lead to the discovery of prognostic biomarkers and new targets for cancer therapy. Recently, Tumor-related Macrophages (TAMs) were shown to be the most abundant immune stromal cells in the tumor microenvironment and important regulators of tumor progression (Wang et al. Citation2016). Notably, macrophages are known to have great plasticity in their phenotype and function. In addition, they can be categorized into two main groups, namely; the classically activated macrophages (M1) and the activated macrophages (M2) (Mantovani et al. Citation2002). M1 macrophages have a pro-inflammatory function and boost the Th1 response. They are also able to identify and arrest tumor cells and are therefore the most common immune cell type associated with the prognosis of ovarian cancer (Guo et al. Citation2019; An and Yang Citation2020). Additionally, the subsets of memory T cells include CD4+ and CD8+ memory T cells. The CD8+ memory T cells can eliminate tumor cells through secondary recognition of tumor-associated antigens. On the other hand, CD4+ memory T cells inhibit the growth of tumor cells by promoting the proliferation of CD8+ memory T cells (Novy et al. Citation2007). Therefore, tumor-infiltrating immune cells play an important role in the development of OC.
The traditional morphology-based classification system of ovarian cancer includes histopathological classification (Serous (SC), Endometrioid (EC), Clear Cell (CCC) and Mucinous (MC) carcinomas). However, OC can also be classified into type I (low grade) and type II (high grade), based on histology, pathogenesis, tumor growth, prognosis and response to treatment (Palmirotta et al. Citation2017). In addition, previous studies identified four phenotype-based expression-based high-grade serous tuboovarian cancer (HGSOC) molecular subtypes of OC, based on transcriptome data. These include the C1/Mesenchymal (C1.MES), C2/Immunoreactive (C2.IMM), C4/Differentiated (C4.DIF) and C5/Proliferative (C5.PRO) subtypes (Cancer Genome Atlas Research Citation2011; Talhouk et al. Citation2020). Nonetheless, there are currently no immune biomarkers for the stratification of OC based on RNA sequencing profiles. Therefore, the present study identified subgroups of immune-related molecules, based on transcriptome data and evaluated the specific mechanisms in each subgroup. Herein, the immunogenomic OC subsets were classified based on the immune signatures in transcriptome data. The findings showed that OC can be divided into three subsets, each with specific characteristics. These include the Immunity_H, Immunity_M and Immunity_L subsets. The Immunity_H subtype not only had higher immune cell infiltration and stromal score but was also associated with better prognosis. On the other hand, the Immunity_L subtype was associated with higher tumor purity. Moreover, the Immunity_H subset had an earlier FIGO stage while the Immunity_L subtye was linked to an advanced FIGO stage. Furthermore, each cluster had distinct functional enrichment terms. Analysis using the TIDE algorithm also showed that patients in the Immunity_H subgroup were likely to respond better to anti-PD1 immunotherapy that those in the Immunity_L category. Additionally, previous studies confirmed that the Immunity_H subtype can express most HLA genes at higher levels, indicating that it is more immunogenic than the other subtypes. Although the specific mechanism of immune escape is unknown, these findings highlight a possible target for personalized treatment of OC. It is also noteworthy that the heterogeneity of the tumor immune microenvironment may lead to different responses to immunotherapy or anti-cancer drugs. However, bioinformatics and further clinical studies are needed to confirm these results.
In conclusion, the identification of immune-associated OC subtypes provides useful insights that may potentially be applied in the treatment of OC.
Materials and methods
Data sources and processing
The RNA-seq data was obtained from two publicly available datasets: The Cancer Genome Atlas (TCGA) and the International Cancer Genome Consortium (ICGC) cohorts. The level 3 RNA sequencing (RNA-seq) data and corresponding clinical information of 380 OC patients were downloaded from the TCGA website up to 15 January 2021 (https://portal.gdc.cancer.gov/repository). Fragments Per Kilo-base Million [FPKM] value were used. In addition, RNA-seq data and clinical information of another 85 tumor samples were obtained from the ICGC portal (https://dcc.icgc.org/projects/OV-AU) (Table ). Normalized read count values were used. These patients who survival time less than 30d were excluded in the study.
Table 1. Information of the two publicly available datasets.
Table 2. Comparison of somatic variants between high and low immune subgroups.
Single-sample Gene Set Enrichment Analysis (ssGSEA) and unsupervised clustering analysis
First, ssGSEA was used to quantify the level of enrichment based on the 29 immune signals in each OC sample (Hanzelmann et al. Citation2013; Krug et al. Citation2019). Unsupervised hierarchical clustering of OC samples was then performed based on the immune enrichment scores.
Estimation of the level of immune cell infiltration, tumor purity and stromal scores in OC
The ESTIMATE method (Yoshihara et al. Citation2013) was employed to approximate the level of immune cell infiltration, the immune score, tumor purity and stromal score, for each OC sample. The Kruskal–Wallis test was then used to examine the differences between the OC subtypes.
Survival analysis
Survival analysis was separately conducted on the three OC subsets, in the ICGC and TCGA datasets. In addition, Kaplan-Meier curves were drawn to show differences in survival between the subtypes. Moreover, log-rank tests were employed to examine the significance of differences in survival and a p value less than 0.05 was considered to be statistically significant.
The proportion of immune cell subpopulations in the OC subtypes
The CIBERSORT algorithm (Newman et al. Citation2015) was used to determine the proportion of LM22 human immune cells in the TCGA and ICGC datasets. The study used 1000 permutations and p < 0.05 as the inclusion criteria for tumor samples. Thereafter, LM22 human cells were compared among the three subclasses. Moreover, the Kruskal–Wallis test was used to examine differences among the OC subtypes.
Gene Set Enrichment Analysis
Gene Enrichment Analysis (GSEA) was employed to calculate the overall enrichment score in the TCGA dataset (Subramanian et al. Citation2005). In addition, the signature gene sets curated from c2/c5 were downloaded from Broad Institute's Molecular Signature Database (MSigDB). Thereafter, the study compared the enriched KEGG pathways between the Immunity_H and Immunity_L subtypes. The significantly enriched pathways were identified based on a False Discovery Rate (FDR) < 0.05. Because the patients in the TCGA OC cohort has a large sample size, I only perform enrichment analysis in the TCGA database.
Mutation analysis
The study downloaded the mutation profiles of MAF in the OC samples from the TCGA data set. Mutation analysis was then performed using the ‘maftools’ package in R (Mayakonda and Koeffler Citation2016), which calculated the frequency of mutations in the given genes. The top 25 driver genes with the highest frequency of mutations were then analyzed further. The study also compared the frequency of somatic variants between the high and low immune subgroups using the chi-square test. A p value < 0.05 was considered to be statistically significant.
Prediction of response to immunotherapy and anti-cancer drugs
Response to immunotherapy was predicted using the Tumor Immune Dysfunction and Rejection (TIDE) algorithm (Jiang et al. Citation2018) and subclass mapping (Hoshida et al. Citation2007). The public pharmacogenomics database, Genomics of Drug Sensitivity in Cancer (GDSC, https://www.cancerrxgene.org/) was also used to predict drug responses in the subtypes, using the pRRophetic package in R (Yang et al. Citation2013). Moreover, the half-peak inhibition concentration (IC50) and prediction accuracy were obtained through ridge regression and 10-fold cross-validation, respectively, depending on the GDSC training set.
Statistical analysis
All the statistical tests were conducted using the R software, version 4.0.0. The Wilcox test was used to compare two groups while the Kruskal–Wallis test was employed to make comparisons in more than two groups (Hazra and Gogtay Citation2016). In addition, the Kaplan-Meier curve was generated to identify the subtypes related to the prognosis of survival (Bland and Altman Citation1998). Moreover, the log-rank test was used to assess the significance of differences among groups. The ‘survival’ package in R was used to conduct the log-rank test. All the p values were bilateral and a p value <0.05 was considered to be statistically significant.
Authors’ contributions
L.Y; J.K.S; Q.A wrote the main manuscript text; T.L; L.Y; J.K.S prepared Figures ; J.K.S; T.L contributed to data analysis; All authors reviewed the manuscript.
Disclosure statement
No potential conflict of interest was reported by the author(s).
Data availability statement
The data that support the findings of this study are available in TCGA at [https://portal.gdc.cancer.gov/repository] and ICGC at [https://dcc.icgc.org/projects/OV-AU].
References
- Alcaraz-Sanabria A, Baliu-Pique M, Saiz-Ladera C, Rojas K, Manzano A, Marquina G, Casado A, Cimas FJ, Perez-Segura P, Pandiella A, et al. 2019. Genomic signatures of immune activation predict outcome in advanced stages of ovarian cancer and basal-like breast tumors. Front Oncol. 9:1486.
- Althaf MM, El Kossi M, Jin JK, Sharma A, Halawa AM. 2017 Dec. Human leukocyte antigen typing and crossmatch: a comprehensive review. World J Transplant. 24(7):339–348.
- An Y, Yang Q. 2020 Feb. MiR-21 modulates the polarization of macrophages and increases the effects of M2 macrophages on promoting the chemoresistance of ovarian cancer. Life Sci. 1(242):117162.
- Andersson E, Poschke I, Villabona L, Carlson JW, Lundqvist A, Kiessling R, Seliger B, Masucci GV. 2016. Non-classical HLA-class I expression in serous ovarian carcinoma: correlation with the HLA-genotype, tumor infiltrating immune cells and prognosis. Oncoimmunology. 5:e1052213.
- Arora T, Mullangi S, Lekkala MR. 2021. Ovarian cancer. Treasure Island (FL): StatPearls.
- Bland JM, Altman DG. 1998 Dec. Survival probabilities (the Kaplan-Meier method). BMJ. 5(317):1572.
- Bray F, Ferlay J, Soerjomataram I, Siegel RL, Torre LA, Jemal A. 2018 Nov. Global cancer statistics 2018: GLOBOCAN estimates of incidence and mortality worldwide for 36 cancers in 185 countries. CA Cancer J Clin. 68:394–424.
- Cancer Genome Atlas Research N. 2011 Jun. Integrated genomic analyses of ovarian carcinoma. Nature. 29(474):609–615.
- Chifman J, Pullikuth A, Chou JW, Bedognetti D, Miller LD. 2016 Nov. Conservation of immune gene signatures in solid tumors and prognostic implications. BMC Cancer. 22(16):911.
- De La Motte Rouge T, Corne J, Cauchois A, Le Boulch M, Poupon C, Henno S, Rioux-Leclercq N, Le Pabic E, Laviolle B, Catros V, et al. 2019 Dec. Serum CD95L level correlates with tumor immune infiltration and is a positive prognostic marker for advanced high-grade serous ovarian cancer. Mol Cancer Res. 17:2537–2548.
- Feng E, Liang T, Wang X, Du J, Tang K, Wang X, Wang F, You G. 2019 Feb. Correlation of alteration of HLA-F expression and clinical characterization in 593 brain glioma samples. J Neuroinflammation. 12(16):33.
- Guo L, Zhang Y, Yang Z, Peng H, Wei R, Wang C, Feng M. 2019 Feb. Tunneling nanotubular expressways for ultrafast and accurate M1 macrophage delivery of anticancer drugs to metastatic ovarian carcinoma. ACS Nano. 26(13):1078–1096.
- Halle MK, Sodal M, Forsse D, Engerud H, Woie K, Lura NG, Wagner-Larsen KS, Trovik J, Bertelsen BI, Haldorsen IS, et al. 2021 May. A 10-gene prognostic signature points to LIMCH1 and HLA-DQB1 as important players in aggressive cervical cancer disease. Br J Cancer. 124:1690–1698.
- Hanzelmann S, Castelo R, Guinney J. 2013 Jan. GSVA: gene set variation analysis for microarray and RNA-seq data. BMC Bioinformatics. 16(14):7.
- Hazra A, Gogtay N. 2016 May–Jun. Biostatistics series module 3: comparing groups: numerical variables. Indian J Dermatol. 61:251–260.
- Hoogstad-van Evert JS, Bekkers R, Ottevanger N, Jansen JH, Massuger L, Dolstra H. 2020 Jun. Harnessing natural killer cells for the treatment of ovarian cancer. Gynecol Oncol. 157:810–816.
- Hoshida Y, Brunet JP, Tamayo P, Golub TR, Mesirov JP. 2007 Nov. Subclass mapping: identifying common subtypes in independent disease data sets. PloS one. 21(2):e1195.
- Jessmon P, Boulanger T, Zhou W, Patwardhan P. 2017 May. Epidemiology and treatment patterns of epithelial ovarian cancer. Expert Rev Anticancer Ther. 17:427–437.
- Jiang P, Gu S, Pan D, Fu J, Sahu A, Hu X, Li Z, Traugh N, Bu X, Li B, et al. 2018 Oct. Signatures of T cell dysfunction and exclusion predict cancer immunotherapy response. Nat Med. 24:1550–1558.
- Kather JN, Horner C, Weis CA, Aung T, Vokuhl C, Weiss C, Scheer M, Marx A, Simon-Keller K. 2019 Jun. CD163+ immune cell infiltrates and presence of CD54+ microvessels are prognostic markers for patients with embryonal rhabdomyosarcoma. Sci Rep. 9:9211.
- Koller KM, Wang W, Schell TD, Cozza EM, Kokolus KM, Neves RI, Mackley HB, Pameijer C, Leung A, Anderson B, et al. 2016 Oct. Malignant melanoma-the cradle of anti-neoplastic immunotherapy. Crit Rev Oncol Hematol. 106:25–54.
- Krug K, Mertins P, Zhang B, Hornbeck P, Raju R, Ahmad R, Szucs M, Mundt F, Forestier D, Jane-Valbuena J, et al. 2019 Mar. A curated resource for phosphosite-specific signature analysis. Mol Cell Proteomics. 18:576–593.
- Kwiatkowska D, Kluska P, Reich A. 2019 Jun. Beyond PD-1 immunotherapy in malignant melanoma. Dermatol Ther (Heidelb). 9:243–257.
- Li J, Li X, Zhang C, Zhang C, Wang H. 2020 Mar. A signature of tumor immune microenvironment genes associated with the prognosis of nonsmall cell lung cancer. Oncol Rep. 43:795–806.
- Liu J, Tan Z, He J, Jin T, Han Y, Hu L, Song J, Huang S. 2020 Oct. Identification of three molecular subtypes based on immune infiltration in ovarian cancer and its prognostic value. Biosci Rep. 40(10):1–17.
- Maby P, Corneau A, Galon J. 2020. Phenotyping of tumor infiltrating immune cells using mass-cytometry (CyTOF). Methods Enzymol. 632:339–368.
- MacGregor HL, Sayad A, Elia A, Wang BX, Katz SR, Shaw PA, Clarke BA, Crome SQ, Robert-Tissot C, Bernardini MQ, et al. 2019 Dec. High expression of B7-H3 on stromal cells defines tumor and stromal compartments in epithelial ovarian cancer and is associated with limited immune activation. J Immunother Cancer. 31(7):357.
- Mantovani A, Sozzani S, Locati M, Allavena P, Sica A. 2002 Nov. Macrophage polarization: tumor-associated macrophages as a paradigm for polarized M2 mononuclear phagocytes. Trends Immunol. 23:549–555.
- Mayakonda A, Koeffler HP. 2016. Maftools: efficient analysis, visualization and summarization of MAF files from large-scale cohort based cancer studies. BioRxiv.052662.
- Newman AM, Liu CL, Green MR, Gentles AJ, Feng W, Xu Y, Hoang CD, Diehn M, Alizadeh AA. 2015 May. Robust enumeration of cell subsets from tissue expression profiles. Nat Methods. 12:453–457.
- Novy P, Quigley M, Huang X, Yang Y. 2007 Dec. CD4 T cells are required for CD8 T cell survival during both primary and memory recall responses. J Immunol. 15(179):8243–8251.
- Odunsi K. 2017 Nov. Immunotherapy in ovarian cancer. Ann Oncol. 1(28):viii1–viii7.
- Ovarian, Fallopian Tube, and Primary Peritoneal Cancer Prevention (PDQ(R)): Patient Version. 2002. PDQ cancer information summaries. Bethesda (MD). https://pubmed.ncbi.nlm.nih.gov/26389375/.
- Palmirotta R, Silvestris E, D’Oronzo S, Cardascia A, Silvestris F. 2017 Sep. Ovarian cancer: novel molecular aspects for clinical assessment. Crit Rev Oncol Hematol. 117:12–29.
- Patel SP, Kurzrock R. 2015 Apr. PD-L1 expression as a predictive biomarker in cancer immunotherapy. Mol Cancer Ther. 14:847–856.
- Perales-Puchalt A, Wojtak K, Duperret EK, Yang X, Slager AM, Yan J, Muthumani K, Montaner LJ, Weiner DB. 2019 Feb. Engineered DNA vaccination against follicle-stimulating hormone receptor delays Ovarian cancer progression in animal models. Mol Ther. 6(27):314–325.
- Rocconi RP, Grosen EA, Ghamande SA, Chan JK, Barve MA, Oh J, Tewari D, Morris PC, Stevens EE, Bottsford-Miller JN, et al. 2020 Dec. Gemogenovatucel-T (vigil) immunotherapy as maintenance in frontline stage III/IV ovarian cancer (VITAL): a randomised, double-blind, placebo-controlled, phase 2b trial. Lancet Oncol. 21:1661–1672.
- Schwich E, Rebmann V, Horn PA, Celik AA, Bade-Doding C, Kimmig R, Kasimir-Bauer S, Buderath P. 2019 Aug. Vesicular-bound HLA-G as a predictive marker for disease progression in epithelial ovarian cancer. Cancers (Basel). 2:11.
- Siegel RL, Miller KD, Jemal A. 2019 Jan. Cancer statistics, 2019. CA Cancer J Clin. 69:7–34.
- Subramanian A, Tamayo P, Mootha VK, Mukherjee S, Ebert BL, Gillette MA, Paulovich A, Pomeroy SL, Golub TR, Lander ES, et al. 2005 Oct. Gene set enrichment analysis: a knowledge-based approach for interpreting genome-wide expression profiles. Proc Natl Acad Sci U S A. 25(102):15545–15550.
- Talhouk A, George J, Wang C, Budden T, Tan TZ, Chiu DS, Kommoss S, Leong HS, Chen S, Intermaggio MP, et al. 2020 Oct. Development and validation of the gene expression predictor of high-grade serous ovarian carcinoma molecular SubTYPE (PrOTYPE). Clin Cancer Res. 15(26):5411–5423.
- Tan B, Guo J, Wang L, Wang L, Gan X, Chen B. 2021 Apr. Expression and change of miR-199b-5p, s HLA-G in thyroid carcinoma. Exp Mol Pathol. 28(120):104643.
- Thomas ED, Meza-Perez S, Bevis KS, Randall TD, Gillespie GY, Langford C, Alvarez RD. 2016 Oct. IL-12 Expressing oncolytic herpes simplex virus promotes anti-tumor activity and immunologic control of metastatic ovarian cancer in mice. J Ovarian Res. 27(9):70.
- Tu L, Guan R, Yang H, Zhou Y, Hong W, Ma L, Zhao G, Yu M. 2020 Jul. Assessment of the expression of the immune checkpoint molecules PD-1, CTLA4, TIM-3 and LAG-3 across different cancers in relation to treatment response, tumor-infiltrating immune cells and survival. Int J Cancer. 15(147):423–439.
- Ullah M, Azazzen D, Kaci R, Benabbou N, Pujade Lauraine E, Pocard M, Mirshahi M. 2019 Mar. High expression of HLA-G in Ovarian carcinomatosis: the role of interleukin-1beta. Neoplasia. 21:331–342.
- van Drongelen V, Holoshitz J. 2017 Aug. Human leukocyte antigen-disease associations in rheumatoid arthritis. Rheum Dis Clin North Am. 43:363–376.
- Wang J, Chen H, Chen X, Lin H. 2016 Jan. Expression of tumor-related macrophages and cytokines after surgery of triple-negative breast cancer patients and its implications. Med Sci Monit. 11(22):115–120.
- Wang W, Liu JR, Zou W. 2019 Jul. Immunotherapy in ovarian cancer. Surg Oncol Clin N Am. 28:447–464.
- Weidle UH, Birzele F, Kollmorgen G, Rueger R. 2016. Mechanisms and targets involved in dissemination of ovarian cancer. Cancer Genom Proteom. 11–12(13):407–423.
- Yang W, Soares J, Greninger P, Edelman EJ, Lightfoot H, Forbes S, Bindal N, Beare D, Smith JA, Thompson IR, et al. 2013 Jan. Genomics of Drug Sensitivity in cancer (GDSC): a resource for therapeutic biomarker discovery in cancer cells. Nucleic Acids Res. 41:D955–D961.
- Yoshihara K, Shahmoradgoli M, Martinez E, Vegesna R, Kim H, Torres-Garcia W, Trevino V, Shen H, Laird PW, Levine DA, et al. 2013. Inferring tumour purity and stromal and immune cell admixture from expression data. Nat Commun. 4:2612.
- Zheng Q, Dai X, Fang W, Zheng Y, Zhang J, Liu Y, Gu D. 2020. Overexpression of microRNA-367 inhibits angiogenesis in ovarian cancer by downregulating the expression of LPA1. Cancer Cell Int. 20:476.