
Abstract
Objective:
We used a preliminary bioinformatics method to analyze the effects of the adenosine A2A receptor on regulatory T cells.
Methods:
GSE34006 data were retrieved from the GEO database, and the differential expression genes (DEGs) were analyzed. DAVID Bioinformatics Resources and Cytoscape software were used to analyze the GO and KEGG. The STRING database was used to construct the PPI networks. Finally, two kinds of algorithms were used to identify the hub genes of the PPI networks. Targetscan and AnimalTFDB were used to predict the regulatory miRNA and transcription factors (TFs) of the hub genes.
Results:
Two hundred and forty-nine DEGs involved in Treg cells regulated by the adenosine A2A receptor, with 163 genes upregulated and 86 genes downregulated. These DEGs were enriched into 75 GO terms and 5 pathways. Fos, Stat5a, Cebpb and Il10 were the hub genes and were upregulated. 13, 2 miRNAs, 1 and 3 miRNAs were predicted to regulate Fos, Stat5a, Cebpb and Il10, respectively. 1 TF was predicted to regulate Fos, Stat5a and Cebpb.
Conclusion:
This study presents a platform to discover the potential mechanism for adenosine A2A receptor on regulatory T cells. However, the functional studies are further needed to validate the hub genes and pathways.
Introduction
Immune system function networks are regulated by interactions between the variable parts of lymphocytes and their secreted molecules (Andersen Citation2017; Zhang et al. Citation2017; Sharabi et al. Citation2018). The immunosuppressants or immunoregulators, known as suppressor T cells or regulatory T (Treg) cells, inhibit antigen–antibody reactions (Andersen Citation2017; Sharabi et al. Citation2018; Zheng and Wang Citation2020). The word ‘regulatory’ is used to describe the important Treg cell functions of maintaining immunological self-tolerance and immune homeostasis (Andersen Citation2017; Li et al. Citation2018).
However, regulatory functions are not only in the immune system; the functions of Treg cells in nonimmunological processes have also been found in recent years in bone repair (Lei et al. Citation2015; Zhang et al. Citation2017; Proto et al. Citation2018; Zheng and Wang Citation2020). Treg cells accelerate bone healing not just by reducing inflammatory responses in direct or indirect ways (Lei et al. Citation2015; Proto et al. Citation2018; Sharabi et al. Citation2018; Schlundt et al. Citation2019), but also by participating in cellular crosstalk and recruitment actions within mesenchymal stem cells (MSCs), osteoblasts, osteoclasts, and vascular endothelial cells (Sun et al. Citation2017; Zhang et al. Citation2017; Li et al. Citation2018; Schlundt et al. Citation2019; Zheng and Wang Citation2020).
The adenosine A2A receptor, as a G-protein coupled receptor, can form self-association homo-oligomers, like A2A–A2A, or heterodimers, like the dopamine D2 receptor, dopamine D3 receptor, cannabinoid CB1, glutamate mGlu5 receptor, and so on (Guerrero Citation2018; Jamwal et al. Citation2019). Thus, the functions of the adenosine A2A receptor include self-functions and polymer-induced functions, such as inflammatory regulation, oxidative stress buffering, ischemia reperfusion protection, and tissue healing (Li et al. Citation2012; Leone et al. Citation2015; Mediero et al. Citation2015; Klein and Bopp Citation2016; Maj et al. Citation2017; Guerrero Citation2018; Lopez et al. Citation2019; Zheng and Wang Citation2020).
ATL-1222 or CGS-21680 are substituted n-ethylcarbazole (NECA) derivatives used as classical A2A receptor agonists in many studies (Li et al. Citation2012; Bao et al. Citation2016b; Mediero et al. Citation2018; Zheng and Wang Citation2020; Zhou et al. Citation2020). We previously studied the effects of the adenosine A2A receptor agonists on Treg cells in rat tibial fracture models and found that adenosine A2A receptor agonists increased Treg cells in fractured rat blood. The phenomenon was found to be related to accelerated bone repair, but the exact mechanisms were unclear (Zheng and Wang Citation2020).
Treg cells activated by A2A receptor agonists also play important roles in many diseases (Lei et al. Citation2015; Mehta et al. Citation2018; Proto et al. Citation2018; Sharabi et al. Citation2018; Fischer et al. Citation2019). In a study using Treg cells isolated from septic mice, A2A receptor agonist-upregulated CD39 and CD73 expression was associated with the protection of the Treg cells (Bao et al. Citation2016b). In allergic asthma or chronic obstructive pulmonary disease (COPD), A2A receptor agonists could increase the ratio of Treg cells in blood and lung tissue to alleviate the illness (Guerrero Citation2018; Sharabi et al. Citation2018; Wang et al. Citation2018). When A2A receptor knockout occurs in Treg cells, Treg cells lose the protective effects in kidney ischemia-reperfusion injury (IRI) (Kinsey et al. Citation2012). Thus, the A2A receptor agonists or the A2A receptor are vital for Treg cells.
The Gene Expression Omnibus (GEO) database is a public gene expression database from the National Center of Biotechnology Information (NCBI) (Zhang et al. Citation2019). Bioinformatics is the discipline involving the use of computers for the collection, processing, storage, dissemination, analysis, and interpretation of biological information. We used databases that have been widely used to analyze the function and the regulation of genes, such as GO, KEGG and STRING. However, bioinformatics studies can provide only a preliminary analysis of each mechanism, which then needs to be verified experimentally.
Some studies utilized the computational pipelines to identify the hub genes from RNA-Seq or Microarray data. Fu et al. (Citation2020) used the RNA-seq raw count data from TCGA database to evaluate the immune related genes and pathways for predicting the prognosis of lung squamous cell carcinoma. Udhaya Kumar et al. (Citation2020a) gathered the data from the obesity and co-morbid diseases database to explore the essential signaling cascades and gene networks in diabesity. Wan et al. (Citation2020) analyzed the data from TCGA database to investigate the different expressed lncRNAs, miRNAs and mRNAs in prostate cancer. Udhaya Kumar et al. (Citation2020b) analyzed the GSE13985 dataset from GEO database to detect the differentially expressed genes and molecular pathways in familial hypercholesterolemia involved in atherosclerosis. They used bioinformatic strategies in their current research to help the experimental biologists to further carry forward the outcomes to treat patients.
In this study, after analyzing the genes and pathways of Treg cells regulated by the adenosine A2A receptor as an immunomodulator, we proposed the hypothesis that adenosine A2A receptors regulate multiple Treg cell signal pathways and genes that play an anti-inflammatory function. We retrieved the gene microarray data of Treg cells regulated by adenosine A2A receptor from the GEO database and then used the bioinformatics method to screen the DEGs among wild-type Treg cells stimulated by selective adenosine A2A receptor agonists, Treg cells with adenosine A2A receptor knockout, and wild-type Treg cells. We analyzed the regulation effects of the adenosine A2A receptor on Treg cells and identified key genes and pathways. This research contributes to understanding the mechanisms of adenosine A2A receptor agonists in Treg cells, but the results must be validated by analytical approaches and larger groups before a valid conclusion could be taken.
Materials and methods
Microarray data
GEO DataSets Database series GSE34006 was retrieved from the GEO database (https://www.ncbi.nlm.nih.gov/geo/query/acc.cgi?acc=GSE34006) (Barrett et al. Citation2012). The annotation platform was the GPL1261 Affymetrix Mouse Genome 430 2.0 Array [Mouse430_2]. The data experiment type was expression profiling by array and mainly focused on the function of the adenosine A2A receptor expression in Treg cells. The data experiment design was as follows: CD4+CD25+ cells were isolated from the spleens and lymph nodes of adenosine A2A receptor+/+FOXP3GFP and adenosine A2A receptor–/–FOXP3GFP mice using magnetic bead–based kits. Next, FOXP3GFP Treg cells were sorted by an iCyte Reflection Cell Sorter. Adenosine A2A receptor+/+ Treg cells were incubated for 18 h with 10 nM ATL-1222 (agonist group) or vehicle (DMSO)(control group). Adenosine A2A receptor–/– Treg cells were incubated for 18 h with vehicle (DMSO) (knockout group).
Data processing
The microarray data were analyzed by R. A grey-scale map of the chip data, a normalized unscaled standard errors (NUSE) box graph, an RNA degradation map and an MA plot were generated to evaluate the quality of the data by affyPLM, RColorBrewer, affy, and oligo packages of the R software. Second, the data were preprocessed by the RMA method, and the GPL1261 platform was used to convert the probe IDs into the appropriate gene symbols. The missing values were supplemented by the k-Nearest Neighbor (KNN). Last, the DEGs among the groups were analyzed by limma packages of R. The criterions for DEGs were an adjusted P-value of less than 0.05 and a | log2fold-change(FC) | greater or equal to 1. The code was deposited in the Mendeley data repository (https://doi.org/10.17632/t8b467z34v.1).
GO analysis and KEGG pathway analysis
We used two methods to make GO annotations and KEGG pathways for DEGs: DAVID Bioinformatics Resources 6.8 (https://david.ncifcrf.gov/, Version 6.8), an online analysis database, and the BiNGO apps of Cytoscape 3.8.0 software (https://cytoscape.org/) (Huang et al. Citation2009; Huang da et al. Citation2009). P-values of less than .05 and gene counts greater than 2 were the criteria for both.
DAVID bioinformatics steps: click ‘start analysis’, paste the list of DEGs, and select the official gene symbol. Then, choose GO and KEGG to analyze. BiNGO apps bioinformatics steps: Open the app in Cytoscape 3.8.0 software, paste the list of DEGs and select Mus musculus. Then, choose GO to analyze.
PPI network construction
The STRING version 11.0 database (https://string-db.org/) was used to construct the DEGs’ PPI networks and to create networks for visualization (Szklarczyk et al. Citation2017). The confidence score for selection was greater than or equal to 0.4. We hid the disconnected nodes in the network. The hub genes in the PPI networks were determined according to the degree and the betweenness, as calculated by the cytoHubba 0.1 and MCODE of Cytoscape 3.8.0 software (Shannon et al. Citation2003).
miRNA-hub genes and TFs-hub gene regulatory network construction
The Targetscan online software (http://www.targetscan.org/) was used to predict the regulatory miRNA of hub genes (Garcia et al. Citation2011). Mouse species was selected and the hub genes was imported, then we got the regulatory miRNA. AnimalTFDB (v3.0) (http://bioinfo.life.hust.edu.cn/AnimalTFDB/) was used to predict the transcription factors (TFs) of hub genes (Hu et al. Citation2019). The protein sequences of hub genes were acquired in NCBI databases as FASTA format. The protein sequences were imported in AnimalTFDB (v3.0) and we got the TFs.
Results
Differentially expressed genes
In our study, GSE34006 was retrieved and analyzed by R. With the criteria for the DEGs being an adjusted P-value less than .05 and a | log2fold-change(FC) | greater than or equal to 1, in all, 249 DEGs were selected among groups. In these DEGs, 163 genes were upregulated and 86 genes were downregulated (Figure ). The top ten upregulated genes were: Tnfrsf9, Gls2, Ramp3, Odc1, Ctla2a, Ctla2b, Rgs2, LOC73899, Pdcd1 and Penk; The top ten downregulated genes were: 4930422I22Rik, Ighv14-2, Ppp1r3fos, Hrh3, 1700031F05Rik, 4930556N13Rik, Plekho2, Wfdc2, Slc9b2 and Srrm3os (Table ).
Figure 1. Heat map of DEGs (the top 60 genes). Agonist: Adenosine A2A receptor+/+ Treg cells incubated 18 h with 10 nM ATL-1222; knockout: Adenosine A2A receptor–/– Treg cells were incubated 18 h with DMSO; wt: Adenosine A2A receptor+/+ Treg cells were incubated 18 h with DMSO. Colors from white to blue mean increasing expression of DEGs among groups. DEGs, differentially expressed genes.
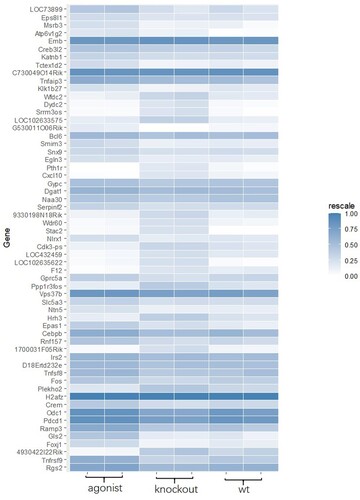
Figure 2. PPI network of DEGs. Hub genes are labeled by triangles. Red indicates upregulated genes, and green indicates downregulated genes. DEGs, differentially expressed genes.
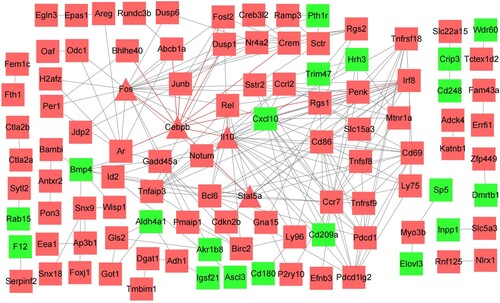
Table 1 Ten most upregulated and downregulated DEGs.
GO analysis and KEGG pathways
DAVID Bioinformatics Resources 6.8 and BiNGO apps of Cytoscape 3.8.0 software were used to analyze GO annotation and the enrichment of KEGG pathways for the 249 DEGs. At last, the 249 DEGs were enriched to 75 Go terms (Biological Process (BP) 55; Cellular Component (CC) 7 and Molecular Function (MF), 13) with a P-value less than .05 and gene counts greater than 2 as the criteria. The top 10, or all significant terms with the lowest P-values of BP, CC, and MF are shown in Table . Five pathways were enriched for 249 DEG genes, with a P-value less than 0.05 and a gene count greater than 2 as criteria. All DEG gene pathways are shown in Table , including six genes involved in TNF signaling pathway (p = 5.70E–03), five genes involved in the TGF-beta signaling pathway (p = 1.20E–02), six genes involved in transcriptional misregulation in cancer (p = 0.03), seven genes involved in cytokine–cytokine receptor interaction (p = 4.20E–02) and four genes involved in pertussis (p = 4.30E–02).
Table 2 GO terms for DEGs (top 10 or all).
Table 3 KEGG pathway analysis for DEGs (all).
PPI network construction
Two hundred and forty-nine DEGs were input into the STRING database, and the disconnected nodes in the network were hidden. Then, a PPI network was constructed, which included 206 nodes and 219 edges (Figure ). The average node degree was 2.13, and the average local clustering coefficient was 0.323. The P-value of PPI enrichment was less than 1.0E–16. Then, a.tsv file from the STRING database was imported into Cytoscape 3.8.0 software to find the hub genes. We used two kinds of computing methods: degree and betweenness. Then the top ten genes were sorted out by each computing method (Table ). Finally, we used the intersection of the top ten genes as the hub genes. The four hub genes, Fos, Stat5a, Cebpb and Il10, were upregulated (Table ).
Table 4 The top 10 genes in PPI network by two kinds computing methods.
Table 5 The expression levels of these hub genes from the studied dataset.
miRNA-hub genes and TFs-hub gene regulatory network construction
Thirteen miRNAs were predicted to regulate Fos. 2 miRNAs were regulated Stat5a, 1 miRNA was regulated Cebpb, and 3 miRNAs were regulated Il10. 1 TF was predicted to regulate Fos, 1 TF was predicted to regulate Stat5a, 1 TF was predicted to regulate Cebpb. however, 0 TF was predicted to regulate Il10. (Table )
Table 6 miRNA-hub genes and TFs-hub gene regulatory network.
Discussion
Treg cells are a special type of T cell that inhibits antigen–antibody reactions acting as immunosuppressants or immunoregulators (Andersen Citation2017; Zhang et al. Citation2017; Mehta et al. Citation2018; Sharabi et al. Citation2018). These cells are vital in regulating inflammatory, immune functions, tissue healing, angiopoiesis and tumor metastasis (Zhang et al. Citation2017; Lee Citation2018; Sharabi et al. Citation2018; Wang et al. Citation2019; Zheng and Wang Citation2020). In addition, they play an indispensable role in autoimmune disease, cardiovascular diseases, tumors, COPD, asthma, bone healing, and so on (Lee Citation2018; Sharabi et al. Citation2018; Wang et al. Citation2018; Zheng and Wang Citation2020). The exploration of the regulation of Treg cells is crucial to advance the treatment of many diseases.
The adenosine A2A receptor is a regulator in various cells, such as endothelial cells, macrophages, osteoclasts, osteoblasts, cancer cells, and Treg cells (Kinsey et al. Citation2012; Li et al. Citation2012; Leone et al. Citation2015; Maj et al. Citation2017; Guerrero Citation2018; Zheng and Wang Citation2020). However, there are few studies that discussed the involved genes and pathways of adenosine A2A receptor on regulatory T cells through the adenosine A2A receptors of Treg cells are essential for cell function (Sitkovsky et al. Citation2008).
The biological effects of adenosine A2A receptors on regulatory T cells have been studied in many diseases. Kinsey et al. (Citation2012) found that adenosine A2A receptor-deficient Treg cells inhibited the kidney IRI protection of Tregs, while receptor activation by ATL-1222 could enhance Treg cells to suppress kidney IRI. Klein and Bopp (Citation2016) reported that adenosine could strongly improve the suppressive functions of Treg in the course of inflammation by the adenosine A2A receptor. However, the specific genes and pathways of Treg cells regulated by the adenosine A2A receptor have not been reported.
In this integrated study, we used bioinformatic analysis to explore the potential genes and pathways participated the biological effects of adenosine A2A receptor on regulatory T cells as the previous studies (Udhaya Kumar et al. Citation2019; Yan et al. Citation2019; Udhaya Kumar et al. Citation2020c; Mishra et al. Citation2021; Udhaya Kumar et al. Citation2021). We analyzed the gene expression changes in Treg cells that are influenced by the adenosine A2A receptor. To accomplish this, GSE34006 was used in the GEO DataSets database. Using the criteria for DEGs (P-value <.05 and | log2fold-change(FC) | ≥1), 249 DEGs were selected. In these DEGs, 163 genes were upregulated, and 86 genes were downregulated.
The regulated biological processes of adenosine A2A receptor on regulatory T cells were performed by GO enrichment analysis. We found that response to lipopolysaccharide, response to cAMP, inactivation of MAPK activity, inflammatory response, response to light stimulus, negative regulation of B cell activation, positive regulation of transcription from RNA polymerase II promoter, circadian rhythm, cellular response to lipopolysaccharide and cellular response to estradiol stimulus were the top 10 most significant biological processes with the lowest P-values. The results were shown that immune and inflammatory regulation were the main biological processes of adenosine A2A receptor on regulatory T cells. However, only five pathways were enriched for the 249 DEGs genes: the TNF signaling pathway, the TGF-beta signaling pathway, transcriptional misregulation in cancer, cytokine–cytokine receptor interaction, and pertussis.
TNF signaling pathway and the TGF-beta signaling pathway were the two pathways that we thought were the main pathways regulated by adenosine A2A receptor on regulatory T cells and these were needed to be verified by ELISA test and knockout cell model.
Tumor necrosis factor (TNF) is an important cytokine in inflammatory reactions and immune system response (Sun et al. Citation2017; Mehta et al. Citation2018). It produces pro-inflammatory and anti-inflammatory effects in autoimmune diseases, cancers, tissue healing, and infectious diseases (Mehta et al. Citation2018). Mehta et al. (Citation2018) summarized that TNF could exert strong protective or pathogenic activity on Treg cells. With co-stimulatory molecules, such as OX40 L and GITRL, TNF can promote the suppressive capacities of Treg cells; furthermore, by itself, TNF can downregulate can downregulate the immunosuppressive functions of Treg cells (Mehta et al. Citation2018). The adenosine A2A receptor enhances Treg cells’ protection functions, such as anti-inflammation or immunosuppression, possibly by activating TNF and co-stimulatory molecule interactions, such as cytokine–cytokine receptor interaction, in GO terms. Transforming growth factor-beta (TGF-beta) is essential for Treg cells (Bao et al. Citation2016a; Wang et al. Citation2019). The application of TGF-beta-blocking antibodies or chemicals leads to the impairment of the Treg cells’ suppressive functions (Toomer and Malek Citation2018). Treg cells secrete TGF-beta to accelerate tissue healing and alleviate inflammation damage (Maj et al. Citation2017; Salamon et al. Citation2017; Lee Citation2018b; Toomer and Malek Citation2018). In TGF-beta deficient mice, the expression of forkhead/winged-helix transcription factor 3 (FOXP3) within the Treg cells was low, leading to Treg cell dysfunction (Toomer and Malek Citation2018). Our findings suggest that the adenosine A2A receptor plays an important regulatory role by affecting the expression TGF-beta, TNF and co-stimulatory molecules.
To assess the degree of interaction between genes, we used the STRING database to build a PPI network. We then used cytoHubba 0.1 and MCODE of the software Cytoscape 3.8.0 to calculate the hub genes using degree and betweenness computations. Finally, we extracted the intersection of the top 10 genes as the hub genes and identified four hub genes, Fos, Stat5 a, Cebpb, and Il10, which were upregulated. The Fox gene regulates Treg cell functions. Bao et al. found that the knockdown of c-Fos (production of the Fox gene) reduced FOXP3 expressions in Treg cells and that induction of c-Fos would elevate the transcription of the FOXP3 gene (Citation2016a, Citation2016b). Lee (Citation2018a) found that the IRF8 gene controlled the type I immune responses and that IRF8-deficient Treg cells expressed aberrant cytokines or caused CXC chemokine receptor 3 (CXCR 3) deficiency; in addition, they found that IRF8-deficient Treg cells could not migrate to inflammatory sites. Interleukin-10 (IL-10) is an important anti-inflammatory factor in tumor immunity and inflammatory immunity. Treg cells secrete IL-10 to play an immunosuppressive role (Maj et al. Citation2017; Proto et al. Citation2018; Wang et al. Citation2019). The Stat5a gene is critical for peripheral Foxp3 expression and Treg cell maintenance; Stat5a binds to the murine Foxp3 gene, implying a direct role for Stat5 in regulating Foxp3 transcription (Yao et al. Citation2007).
These results confirm our hypothesis that adenosine A2A receptors regulate multiple signal pathways and genes in Treg cells to perform anti-inflammatory functions. Overall, the results must be validated by analytical approaches and larger groups before any valid conclusion could be taken.
Conclusions
In summary, we used bioinformatics to analyze the DEGs of Treg cells regulated by the adenosine A2A receptor. We obtained 249 DEGs. We then performed GO enrichment, KEGG pathway analysis, and a PPI network of these DEGs. Four hub genes, Fos, Stat5a, Cebpb and Il10, were found to be upregulated. These hub genes may play important roles in Treg cells regulated by the adenosine A2A receptor. This study is based on gene transcription data and must be confirmed by rigorous, molecular biology experimental research.
Abbreviations
| Treg cells | = | Regulatory T cells |
| DEGs | = | differential expression genes |
| FC | = | fold-change |
| DAVID | = | database for annotation, visualization and integrated discovery |
| KEGG | = | Kyoto encyclopedia of genes and genomes |
| PPI | = | protein–protein interaction |
| GO | = | gene ontology |
| TNF | = | tumor necrosis factor |
| TGF-beta | = | transforming growth factor-beta |
| MSCs | = | mesenchyma stem cells |
| NECA | = | n-ethylcarbazole |
| COPD | = | chronic obstructive pulmonary disease |
| IRI | = | ischemia-reperfusion injury |
| GEO | = | gene expression omnibus |
| NCBI | = | National Center of Biotechnology Information |
| DMSO | = | dimethyl sulfoxide |
| NUSE | = | normalized unscaled standard errors |
| KNN | = | k-nearest neighbor |
| BP | = | biological process |
| CC | = | cellular component |
| MF | = | molecular function |
| CXCR 3 | = | C-X-C chemokine receptor 3 |
| IL-10 | = | interleukin-10 |
| TFs | = | transcription factors |
Consent for publication
All authors agreed to the publication of this research.
Availability of data and materials
The raw data for this study was obtained from the GEO database [https://www.ncbi.nlm.nih.gov/geo/query/acc.cgi?acc=GSE34006]. The supplemental data used to support the findings of this study have been deposited in the Mendeley Data repository [https://doi.org/10.17632/n4k6wywftg.1].
Code availability
R language: https://www.r-project.org/. (The code was deposited in the Mendeley data repository (https://doi.org/10.17632/t8b467z34v.1)). DAVID Bioinformatics Resources 6.8: https://david.ncifcrf.gov/ Cytoscape 3.8.0 software: https://cytoscape.org/ STRING version 11.0 database: https://string-db.org/ Targetscan software: http://www.targetscan.org/ AnimalTFDB (v3.0): http://bioinfo.life.hust.edu.cn/AnimalTFDB/
Acknowledgements
The authors thank Kinsey GR, okusa MD for uploading database series GSE34006 to(https://www.ncbi.nlm.nih.gov/geo/query/acc.cgi?acc=GSE34006) for public use. The authors are also grateful for the continuous updating of R language and the development of related software used in this research. Jingyi Wang and Xi Zheng designed this study; Dong Wang analyzed GSE34006 data from the GEO database; Dong Wang wrote the article, and Xi Zheng revised the article. All the authors read and approved the final manuscript.
Disclosure statement
No potential conflict of interest was reported by the author(s).
References
- Andersen MH. 2017. Anti-regulatory T cells. Semin Immunopathol. 39:317–326.
- Bao R, Hou J, Li Y, Bian J, Deng X, Zhu X, Yang T. 2016a. Adenosine promotes Foxp3 expression in Treg cells in sepsis model by activating JNK/AP-1 pathway. Am J Transl Res. 8:2284–2292.
- Bao R, Shui X, Hou J, Li J, Deng X, Zhu X, Yang T. 2016b. Adenosine and the adenosine A2A receptor agonist, CGS21680, upregulate CD39 and CD73 expression through E2F-1 and CREB in regulatory T cells isolated from septic mice. Int J Mol Med. 38:969–975.
- Barrett T, Wilhite SE, Ledoux P, Evangelista C, Kim IF, Tomashevsky M, Marshall KA, Phillippy KH, Sherman PM, Holko M, et al. 2012. NCBI GEO: archive for functional genomics data sets – update. Nucleic Acids Res. 41:D991–D995.
- Fischer L, Herkner C, Kitte R, Dohnke S, Riewaldt J, Kretschmer K, Garbe AI. 2019. Foxp3+ regulatory T cells in bone and hematopoietic homeostasis. Front Endocrinol (Lausanne). 10:578.
- Fu D, Zhang B, Yang L, Huang S, Xin W. 2020. Development of an immune-related risk signature for predicting prognosis in lung squamous cell carcinoma. Front Genet. 11:978.
- Garcia DM, Baek D, Shin C, Bell GW, Grimson A, Bartel DP. 2011. Weak seed-pairing stability and high target-site abundance decrease the proficiency of lsy-6 and other microRNAs. Nat Struct Mol Biol. 18(10):1139–1146.
- Guerrero A. 2018. A2A adenosine receptor agonists and their potential therapeutic applications: an update. Curr Med Chem. 25:3597–3612.
- Hu H, Miao YR, Jia LH, Yu QY, Zhang Q, Guo AY. 2019. AnimalTFDB 3.0: a comprehensive resource for annotation and prediction of animal transcription factors. Nucleic Acids Res. 47(D1):D33–D38.
- Huang DW, Sherman BT, Lempicki RA. 2009. Systematic and integrative analysis of large gene lists using DAVID bioinformatics resources. Nat Protoc. 4:44–57.
- Huang da W, Sherman BT, Lempicki RA. 2009. Bioinformatics enrichment tools: paths toward the comprehensive functional analysis of large gene lists. Nucleic Acids Res. 37:1–13.
- Jamwal S, Mittal A, Kumar P, Alhayani DM, Al-Aboudi A. 2019. Therapeutic potential of agonists and antagonists of A1, A2a, A2b and A3 adenosine receptors. Curr Pharm Des. 25:2892–2905.
- Kinsey GR, Huang L, Jaworska K, Khutsishvili K, Becker DA, Ye H, Lobo PI, Okusa MD. 2012. Autocrine adenosine signaling promotes regulatory T cell-mediated renal protection. J Am Soc Nephrol. 23:1528–1537.
- Klein M, Bopp T. 2016. Cyclic AMP represents a crucial component of Treg cell-mediated immune regulation. Front Immunol. 7:315.
- Lee GR. 2018a. IRF8: identity-keeper for suppressive Th1-like Treg cells. Cell Mol Immunol. 15:1080–1081.
- Lee GR. 2018b. The Balance of Th17 versus Treg cells in autoimmunity. Int J Mol Sci. 3:19.
- Lei H, Schmidt-Bleek K, Dienelt A, Reinke P, Volk HD. 2015. Regulatory T cell-mediated anti-inflammatory effects promote successful tissue repair in both indirect and direct manners. Front Pharmacol. 6:184.
- Leone RD, Lo YC, Powell JD. 2015. A2ar antagonists: next generation checkpoint blockade for cancer immunotherapy. Comput Struct Biotechnol J. 13:265–272.
- Li J, Tan J, Martino MM, Lui KO. 2018. Regulatory T-cells: potential regulator of tissue repair and regeneration. Front Immunol. 9:585.
- Li Y, Figler RA, Kolling G, Bracken TC, Rieger J, Stevenson RW, Linden J, Guerrant RL, Warren CA. 2012. Adenosine A2A receptor activation reduces recurrence and mortality from clostridium difficileinfection in mice following vancomycin treatment. BMC Infect Dis. 12(1):342.
- Lopez CD, Bekisz JM, Corciulo C, Mediero A, Coelho PG, Witek L, Flores RL, Cronstein BN. 2019. Local delivery of adenosine receptor agonists to promote bone regeneration and defect healing. Adv Drug Delivery Rev. 146:240–247.
- Maj T, Wang W, Crespo J, Zhang H, Wang W, Wei S, Zhao L, Vatan L, Shao I, Szeliga W, et al. 2017. Oxidative stress controls regulatory T cell apoptosis and suppressor activity and PD-L1-blockade resistance in tumor. Nat Immunol. 18:1332–1341.
- Mediero A, Wilder T, Perez-Aso M, Cronstein BN. 2015. Direct or indirect stimulation of adenosine A2Areceptors enhances bone regeneration as well as bone morphogenetic protein-2. FASEB J. 29:1577–1590.
- Mediero A, Wilder T, Shah L, Cronstein BN. 2018. Adenosine A2A receptor (A2AR) stimulation modulates expression of semaphorins 4D and 3A, regulators of bone homeostasis. FASEB J 32:3487–3501.
- Mehta AK, Gracias DT, Croft M. 2018. TNF activity and T cells. Cytokine 101:14–18.
- Mishra S, Shah MI, Udhaya Kumar S, Thirumal Kumar D, Gopalakrishnan C, Al-Subaie AM, Magesh R, George Priya Doss C, Kamaraj B. 2021. Network analysis of transcriptomics data for the prediction and prioritization of membrane-associated biomarkers for idiopathic pulmonary fibrosis (IPF) by bioinformatics approach. Adv Protein Chem Struct Biol. 123:241–273.
- Proto JD, Doran AC, Gusarova G, Yurdagul A, Sozen E, Subramanian M, Islam MN, Rymond CC, Du J, Hook J, et al. 2018. Regulatory T cells promote macrophage efferocytosis during inflammation resolution. Immunity. 49(4):666–677.e6.
- Salamon P, Shefler I, Moshkovits I, Munitz A, Horwitz Klotzman D, Mekori YA, Hershko AY. 2017. IL-33 and IgE stimulate mast cell production of IL-2 and regulatory T cell expansion in allergic dermatitis. Clin Exp Allergy. 47:1409–1416.
- Schlundt C, Reinke S, Geissler S, Bucher CH, Giannini C, Mardian S, Dahne M, Kleber C, Samans B, Baron U, et al. 2019. Individual effector/regulator T cell ratios impact bone regeneration. Front Immunol. 10:1954.
- Shannon P, Markiel A, Ozier O, Baliga NS, Wang JT, Ramage D, Amin N, Schwikowski B, Ideker T. 2003. Cytoscape: a software environment for integrated models of biomolecular interaction networks. Genome Res. 13:2498–2504.
- Sharabi A, Tsokos MG, Ding Y, Malek TR, Klatzmann D, Tsokos GC. 2018. Regulatory T cells in the treatment of disease. Nat Rev Drug Discovery. 17:823–844.
- Sitkovsky M, Lukashev D, Deaglio S, Dwyer K, Robson SC, Ohta A. 2008. Adenosine A2A receptor antagonists: blockade of adenosinergic effects and T regulatory cells. Br J Pharmacol. 153(Suppl 1):S457–S464.
- Sun G, Wang Z, Ti Y, Wang Y, Wang J, Zhao J, Qian H. 2017. STAT3 promotes bone fracture healing by enhancing the FOXP3 expression and the suppressive function of regulatory T cells. APMIS. 125:752–760.
- Szklarczyk D, Morris JH, Cook H, Kuhn M, Wyder S, Simonovic M, Santos A, Doncheva NT, Roth A, Bork P, et al. 2017. The STRING database in 2017: quality-controlled protein-protein association networks, made broadly accessible. Nucleic Acids Res. 45(45):D362–D368.
- Toomer KH, Malek TR. 2018. Cytokine signaling in the development and homeostasis of regulatory T cells. Cold Spring Harbor Perspect Biol. 1:10.
- Udhaya Kumar S, Rajan B, Thirumal Kumar D, Anu Preethi V, Abunada T, Younes S, Okashah S, Ethiraj S, George Priya Doss C, Zayed H. 2020a. Involvement of essential signaling cascades and analysis of gene networks in diabesity. Genes (Basel). 25:11.
- Udhaya Kumar S, Saleem A, Kumar DT, Preethi VA, Younes S, Zayed H, Tayubi IA, George Priya Doss C. 2021. A systemic approach to explore the mechanisms of drug resistance and altered signaling cascades in extensively drug-resistant tuberculosis. Adv Protein Chem Struct Biol. 127:1–22.
- Udhaya Kumar S, Thirumal Kumar D, Bithia R, Sankar S, Magesh R, Sidenna M, George Priya Doss C, Zayed H. 2020b. Analysis of differentially expressed genes and molecular pathways in familial hypercholesterolemia involved in atherosclerosis: a systematic and bioinformatics approach. Front Genet. 11:734.
- Udhaya Kumar S, Thirumal Kumar D, Siva R, George Priya Doss C, Younes S, Younes N, Sidenna M, Zayed H. 2020c. Dysregulation of signaling pathways due to differentially expressed genes from the B-cell transcriptomes of systemic lupus erythematosus patients – a bioinformatics approach. Front Bioeng Biotechnol. 8:276.
- Udhaya Kumar S, Thirumal Kumar D, Siva R, George Priya Doss C, Zayed H. 2019. Integrative bioinformatics approaches to map potential novel genes and pathways involved in ovarian cancer. Front Bioeng Biotechnol. 7:391.
- Wan J, Jiang S, Jiang Y, Ma W, Wang X, He Z, Wang X, Cui R. 2020. Data mining and expression analysis of differential lncRNA ADAMTS9-AS1 in prostate cancer. Front Genet. 10:1377.
- Wang J, Jiang H, Qiu Y, Wang Y, Sun G, Zhao J. 2019. Effector memory regulatory T cells were most effective at suppressing RANKL but their frequency was downregulated in tibial fracture patients with delayed union. Immunol Lett. 209:21–27.
- Wang L, Wan H, Tang W, Ni Y, Hou X, Pan L, Song Y, Shi G. 2018. Critical roles of adenosine A2A receptor in regulating the balance of Treg/Th17 cells in allergic asthma. Clin Respir J. 12:149–157.
- Yan H, Zheng G, Qu J, Liu Y, Huang X, Zhang E, Cai Z. 2019. Identification of key candidate genes and pathways in multiple myeloma by integrated bioinformatics analysis. J Cell Physiol. 234:23785–23797.
- Yao Z, Kanno Y, Kerenyi M, Stephens G, Durant L, Watford WT, Laurence A, Robinson GW, Shevach EM, Moriggl R, et al. 2007. Nonredundant roles for Stat5a/b in directly regulating Foxp3. Blood. 109(10):4368–4375.
- Zhang C, Li L, Feng K, Fan D, Xue W, Lu J. 2017. ‘Repair’ treg cells in tissue injury. Cell Physiol Biochem. 43:2155–2169.
- Zhang J, Liu Y, Shi G. 2019. Gene microarray analysis of expression profiles in suberoyllanilide hyroxamic acid-treated dendritic cells. Biochem Biophys Res Commun. 508(2):392–397.
- Zheng X, Wang D. 2020. The adenosine A2A receptor agonist accelerates bone healing and adjusts treg/Th17 cell balance through interleukin 6. BioMed Res Int. 2020:2603873.
- Zhou YP, Ruan CC, Kong LR, Gao PJ. 2020. Adenosine A2A receptor activation prevents DOCA-salt induced hypertensive cardiac remodeling via iBAT. Biochem Biophys Res Commun. 19:224–230.