
Abstract
The aim of this study was to elucidate the role of DNA methylation-silenced genes in malignant transformation. We screened DNA methylation-silenced genes during methacrylate (GMA)-induced malignant transformation of human bronchial epithelial cells (16HBE) by DNA methylation microarray analysis. The methylation status of some identified genes was assessed by a polymerase chain reaction and compared with uninduced control cells. A total of 801, 66 and 30 genes were silenced in 10th, 20th and 30th generation cells; 8 genes were silenced in 10th and 20th generation cells but not in 30th generation cells; 14 genes were silenced in 30th and 10th generation cells but not in 20th generation cells; and one gene was silenced in 20th and 30th generation cells but not in 10th generation cells. TRPV1 and SOD2 genes were methylated and their gene expression levels were significantly lower in 30th generation 16HBE cells treated with GMA compared to uninduced control cells (P < 0.05). The expression levels of DNA methylation-silenced genes were altered throughout the GMA-induced malignant transformation of 16HBE cells. Furthermore, TRPV1/SOD2 may represent a specific molecular marker associated with the malignant transformation of GMA-stimulated 16HBE cells.
Introduction
Gene silencing is required to regulate gene expression in eukaryotic cells, resulting in reduced gene expression levels and function (Chamberlain et al. Citation2014). DNA methylation represents an epigenetic modification that could directly or indirectly affect gene transcription. DNA methylation has been shown to occur in humans and other animals and often affects promoters of tumor suppressor genes (Wolffe and Matzke Citation1999). Numerous studies have shown a strong association between DNA methylation and gene expression repression (Fujita and Kaneda Citation2017; Sharifi-Zarchi et al. Citation2017; Wang et al. Citation2018).
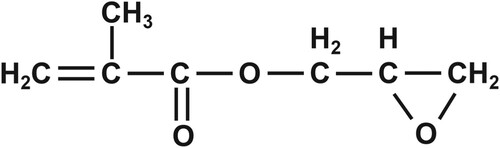
Glycidyl methacrylate (GMA) is a chemical widely used in resins, coatings, adhesives, and plastics (Figure ) (Dobrovolsky et al. Citation2016). Epidemiological investigations found that GMA concentrations of 32.59 mg/m3 can be significantly toxic to humans (Xie et al. Citation1990). In China in the late 1980s, we first reported that GMA is mutagenic and exhibits significant genotoxic effects in vivo and in vitro, mainly including DNA damage, chromosomal damage, and genetic mutations. We also found that GMA could induce malignant transformation in several types of mammalian and human cells (2020, group 2020; Wang et al. Citation2014). The demethylating agent 5-aza-2'-deoxycytidine (5-aza-cdr) is a specific DNA methyltransferase inhibitor that has been shown to reverse the DNA methylation process, induce tumor cell differentiation and cause apoptosis in tumor cells. The FDA also approved 5-aza-cdr for the treatment of myelodysplastic syndromes (Zhu and Otterson Citation2003).
In this study, we screened DNA methylation silencing genes at different stages of transformation by previously established cell models (Wang et al. Citation2014) using methylated DNA immunoprecipitation methylation microarray. Meanwhile, we combined whole-genome sequencing results to explore possible mechanistic pathways in GMA carcinogenesis and its potential biomarkers.
Materials and methods
Materials
GMA (purity ≥98.5%, Dow) was obtained from Guang Zhou Shuang Jian Trading Co., Ltd. The medium was obtained from Hyclone, trypsin was from Amresco, Quick-gDNA™ MiniPrep was obtained from Zymo (USA), 5-aza-cdr, Na2EDTA, and DMSO were from Sigma, and NaCl, KCl, and NaOH were from TIANGEN (Beijing, China). 16HBE cells were obtained from the University of California. The main instruments used included an Olympus IX50 inverted fluorescence microscope (Olympus), Kodak DC290 digital camera (Kodak), CO2 incubator (Thermo), clean benches (Tianjin Teste plant), centrifuge (Shanghai Medical Instrument Factory), inverted microscope (Shanghai Optical Wing Hang Instruments, Inc.), optical microscope (Olympus), and a microplate reader (Bio-Rad, USA).
Cell culture
Cells were digested with 0.25% trypsin during the logarithmic growth phase, seeded in cell culture flasks (culture area 25 cm2, Greiner Bio-One) at 5 × 10⁵ per flask, and then placed overnight in an incubator at 37°C with 5% CO2. The next day, cells were exposed to GMA (8 µg/ml) for 72 h, washed three times with phosphate-buffered saline, cultured in a fresh medium, and re-exposed after 24 h interval. After the third exposure to GMA, the cells were cultured in Minimal Essential Medium (MEM) medium containing 5% fetal bovine serum (FBS), which was considered the first generation. When the cells covered about 85% of the culture flask, they were subjected to passaged culture. At the 10th, 20th and 30th generations, GMA-stimulated cells were treated with 5-aza-cdr (5 µmol/l), respectively.
Figure 1. Chemical structure of GMA.
Concanavalin A agglutination test and anchorage-independent growth
First and tenth generation cells were digested with 0.25% trypsin, centrifuged, and suspended at 1 × 10⁶ cells/ml. Concanavalin A (Con A) was prepared at concentrations of 6.25, 12.5, 25, 50, 100 and 200 µg/ml. Two drops of cell suspension per group were taken into the above Con A solution in a six-well plate and mixed thoroughly. The cells were then observed to agglutinate using an inverted microscope and the time at which the cells started to agglutinate was recorded within 30 min. Petri dishes were prepared by mixing equal volumes of agar solution (1.0%) and (MEM) medium (0% FBS), coagulated and placed in an incubator. Then equal volumes of agar solution (0.5%) and MEM (10% FBS) were mixed and placed in a water bath at 37°C to prepare the top agar layer. Single cell suspensions of 10th, 20th and 30th generation cells were prepared with trypsin, and 4000 cells were added to the top agar and poured on top of the bottom agar layer. After solidification of the top agar layer the cultures were placed in an incubator and after 14 days the formation of colonies was observed with an inverted microscope.
Whole-genome microarrays
According to the manufacturer's instructions, total RNA was collected using Trizol (Invitrogen, France) and RNeasy kit (Qiagen, Cat No./ID: 74106), including the DNase digestion step. After measuring by RNA on the NanoDrop 1000 (Thermo Fisher) and Denaturing Gradient Gel Electrophoresis, the samples were amplified and labeled with Agilent's Quick Amp Labeling Kits (Agilent, Santa Clara, United States) and hybridized with Agilent whole-genome oligo microarray in the Agilent SureHyb hybridization chamber (Agilent, Santa Clara, United States). After hybridization and washing, the settings recommended by Agilent Technologies were used to scan the processed slides with the Agilent DNA Microarray Scanner (Part No. G2505B). The resulting text files extracted from the Agilent feature extraction software (version 9.5.3) were imported into Agilent GeneSpring GX software (version 7.3 or later) for further analysis.
Genomic DNA extraction and fragmentation genomic
DNA was extracted from 16HBE cells using DNeasy Blood & Tissue Kits (Takara Bio USA). The purified DNA was then quantified and its quality assessed using NanoDrop ND-1000 (Thermo Fisher). Subsequently, DNA was sonicated to 200–1000 bp with Diagenode's Bioruptor and agarose analysis was performed, including sheared DNA.
DNA labeling and array hybridization
For DNA labeling, the NimbleGen two-color DNA labeling kit was used in the NimbleGen MeDIP microarray protocol. One µg of DNA from each sample was incubated with Cy5-9mer or Cy3-9mer primer 10D for 10 min at 98°C. Then, 100 pmol of deoxynucleoside triphosphate and 100 U of Klenow fragment were added. The reaction was stopped by adding 0.1 volume of 0.5 mol/L EDTA, and isopropanol/ethanol precipitated the purified labeled DNA. The hybridization of Cy3/5-labeled DNA was performed with Nimblegen Hybridization Buffer/Hybridization Component A in a hybridization chamber at 42°C for 16 h. After hybridization, the DNA was washed with the Nimblegen Wash Buffer Kit. Roche Nimblegen's CpG promoter array was used for array hybridization, a single array design containing all known CpG islands, annotated by UCSC, with all well-characterized RefSeq promoter regions covered by 385,000 probes.
Methylated DNA immunoprecipitation sequencing (MeDIP) coupled to microarray
Log2 (IP/input) and P values were obtained for each probe. log2 (IP/input) indicates the relative enrichment intensity of each probe in MeDIP compared to the input DNA. The P values indicate the probability of a difference between red and green probe signals due to abiotic factors (P < 0.01), with a peak score equal to log10 (P-value) and a peak score >2 indicating that the probe represents a methylation event. The MeDIP method combined with qPCR was used to assess the demethylation status quantitatively. Genomic DNA was extracted and randomly cut to an average length of 0.2-1.0 kb using ultrasound. Dilution buffer and 60 µl of protein G magnetic bead suspension were added to the fragmented DNA and incubated for more than 10 min. The DNA was incubated with 8 µg of anti-5-methylcytosine antibody overnight at 4°C and then incubated with mouse IgG magnetic beads at 4°C for 2 h. The methylated DNA/antibody complexes were washed with 1 ml of cold WB1, WB2 and WB3 buffers. Purified DNA was subjected to qPCR analysis on a 7500 real-time PCR system. The relative change in promoter methylation was determined by measuring the number of promoters in the immunoprecipitated DNA.
Quantitative RT-PCR
Total RNA was extracted from cells with Trizol reagent. Reverse transcription was performed using Takara RT-PCR kit. Fluorescent RT-PCR quantified gene expression levels. The primers used for RT-PCR are shown in Table .
Table 1. Primers and amplicon sizes for selected human genes for RT-PCR.
Statistical analysis
Data are presented as the mean ± standard deviation (SD) of at least three independent experiments. The significance of differences was analyzed using Student’s t-test or ANOVA, followed by Dunnett’s multiple comparisons. A value of P < 0.05 was considered significant.
Results
Colony formation assay
GMA increased the colony-forming capacity of 16HBE cells compared with controls in a dose-dependent manner (Figure ). Con A and soft agar assays confirmed the phenotypic changes in GMA-transformed cells (Figure ). Furthermore, normally only tenth generation 16HBE cells were agglutinated at high concentrations (200µg/ml) of Con A, whereas GMA-transformed cells could be agglutinated at high concentrations of Con A in the first generation (Tables and ). Negative controls failed to grow when suspended in soft agar; however, GMA-transformed cells grew in soft agar.
Figure 2. Soft Agar Colony Formation Assay (A-B). DMSO represents the normal, untransformed cells; GMA-treated represents transformed cells that developed after exposure to four different GMA concentrations. MCA represents the positive control. ** P < 0.01 indicate the cloning efficiency significant difference from control group.
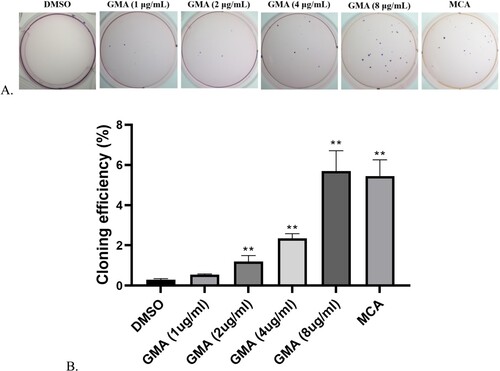
Figure 3. Anchorage-independent growth.
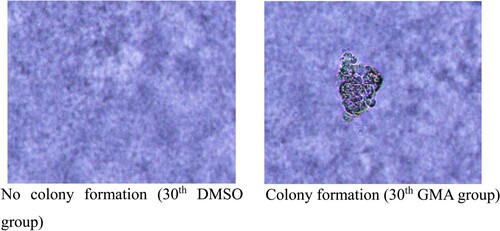
Table 2. Agglutination time of 1st generation cells in Con A.
Table 3. Agglutination time of 10th generation cells in Con A.
DNA methylation-silenced genes
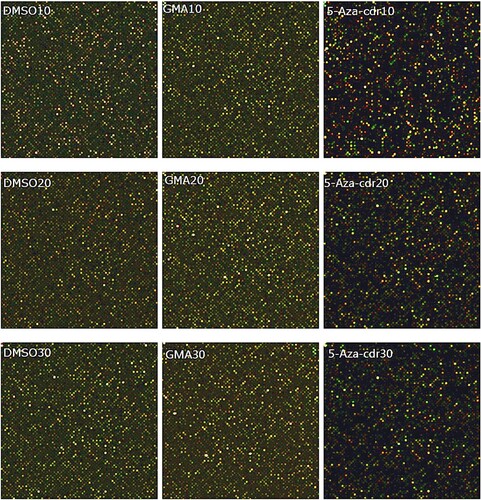
Genes were considered methylation silenced when they were unmethylated in DMSO-treated cells, methylated in GMA-treated cells, and unmethylated in GMA + 5-aza-cdr-treated cells of the same generation. Figure shows the results of methylation microarray scans of malignantly transformed 16HBE cells at different time points after GMA induction. The scanned image shows that each chip has a uniform signal, and there are no scratches on the surface or marginalization effects affecting the signal value. Relative to the control group, the GMA-treated group had a brighter color, representing a higher methylation level, and the methylation level decreased after 5-aza-cdr treatment.
Figure 4. Methylation chip scan of 16HBE cells at different time points after malignant transformation by GMA. The first row is for the 10th generation, the second row is for the 20th generation, and the third row is for the 30th generation. Cy5 is labeled red and cy5 labels IP samples, cy3 is labeled green and cy3 labels input samples. Cy5 and cy3 together are detected as yellow.
During the GMA-induced malignant transformation of 16HBE cells, 801, 66 and 30 genes were silenced in the 10th, 20th and 30th generations, respectively; 8 genes were silenced in the 10th and 20th generations but not in the 30th generation; 14 genes were silenced in the 30th and 10th generations but not in the 20th generation; 1 gene was silenced in the 20th and 30th generations but not in the 10th generation. Twenty-five, one and three important pathways involved in DNA methylation were silenced in the 10th, 20th and 30th generations, respectively (Table ).
Table 4. DNA methylation silencing genes in the process of 16HBE cells malignant transformation induced by GMA at different time points.
During GMA-induced malignant transformation of 16HBE cells, there were 821 methylation-silenced genes, 75, and 44 at the 10th, 20th, and 30th generation time points, respectively. No cells with DNA methylation silencing were found at all transformation stages. There were 30 statistically significant pathways involving DNA methylation silencing genes at different time points. There were 26 in the 10th generation, 1 in the 20th generation and 3 in the 30th generation (Table ).
Table 5. Status of DNA methylation-silenced genes throughout the malignant transformation of 16HBE cells stimulated by GMA.
Whole-genome methylation levels
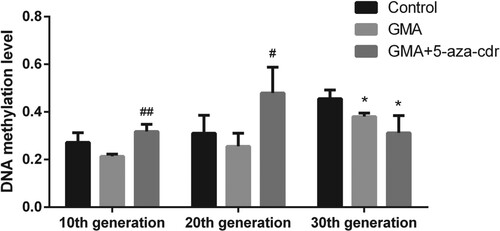
Genome-wide methylation levels were reduced in GMA-treated compared to control cells treated with DMSO at the same stage. However, in the 10th and 20th generation cells, whole-gene methylation levels were increased to higher than the control by 5-aza-cdr treatment (Figure ).
Figure 5. Whole-genome methylation status in 16HBE cells at different time points after malignant transformation by GMA. Methylation levels were determined in untreated control cells and in GMA-treated cells with or without 5-aza-cdr at the 10th, 20th, and 30th generation, by MeDIP coupled with microarray. Expression levels were calculated as a percentage of the control value and presented as the mean ± SD of triplicate tests. *P < 0.05 and **P < 0.01 compared with the untreated control group; #P < 0.05 and ##P < 0.01 compared with the GMA group.
Methylation and relative expression of TRPV1/SOD2
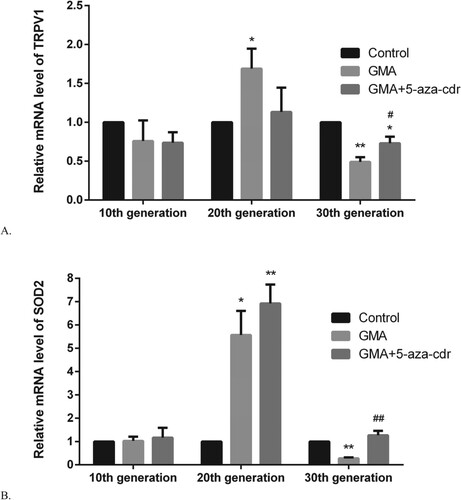
We screened for genes where the DNA methylation of the gene was silenced at 30th generation, yet the gene was non-methylation silenced at 10th and 20th generations. Subsequently, we screened the genes with the most decreased expression levels by whole genome microarray and verified their methylation silencing status by PCR. At 30th generation, TRPV1 and SOD2 genes showed DNA methylation in the GMA-treated group (Figure ). TRPV1 gene expression was lower in the GMA-treated group at 30th generation and higher at 20th generation compared to the DMSO group (P < 0.05). In addition, TRPV1 gene expression was higher in the GMA + 5-aza-cdr group at 30th generation compared to the GMA group (P < 0.05). SOD2 gene expression was lower in the 30th generation of cells treated with GMA compared to the DMSO group (P < 0.001), whereas SOD2 gene expression was higher in the 30th generation of cells treated with GMA + 5-aza-cdr compared to those treated with GMA (P < 0.001) (Figure ).
Figure 6. TRPV1/SOD2 methylation status in 16HBE cells at different time points after malignant transformation by GMA. (A-B) TRPV1/SOD2 methylation levels were determined in untreated control cells and in GMA-treated cells with or without 5-aza-cdr at the 10th, 20th, and 30th generation, by MeDIP coupled to microarray. Expression levels were calculated as a percentage of the control value and presented as the mean ± SD of triplicate tests. *P < 0.05 and **P < 0.01 compared with the untreated control group; #P < 0.05 and ##P < 0.01 compared with the GMA group.
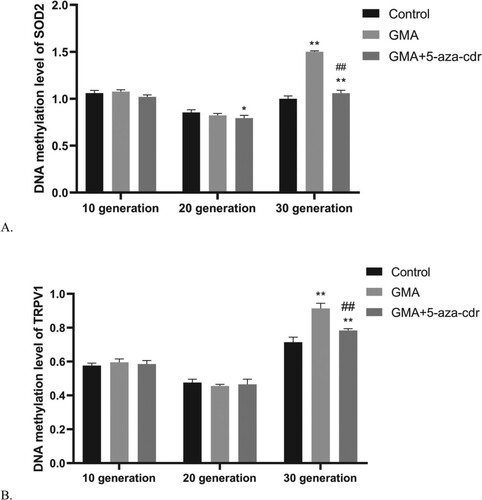
Figure 7. TRPV1/SOD2 mRNA expression levels in 16HBE cells at different time points after malignant transformation by GMA. (A-B) TRPV1/SOD2 mRNA expression levels were determined in untreated control cells and in GMA-treated cells with or without 5-aza-cdr at the 10th, 20th, and 30th generation, by RT-PCR. Expression levels were calculated relative to glyceraldehyde 3-phosphate dehydrogenase gene expression. Values are presented as mean ± SD. *P < 0.05 and **P < 0.01 compared with the untreated control group; #P < 0.05 and ##P < 0.01 compared with the GMA group.
Discussion
Cellular transformation occurs as a result of genetic changes in cells and is a multifactorial, multi-stage process (Wang et al. Citation2014). Through stimulation by chemical carcinogens, it is possible to establish a model of malignant cellular transformation, which could then serve as a basis for studying and understanding the mechanisms of carcinogenesis.
Con A has a wide range of applications including biochemical and immunological research reagents (Nadimpalli et al. Citation2004; Tan et al. Citation2010). Given that malignantly transformed cells exhibit higher agglutination sensitivity to Con A than normal cells, it could also distinguish between normal and tumor cells. The results of the present study show that 10th generation 16HBE cells stimulated with GMA are more sensitive to the aggregation of Con A, suggesting that their cell surface characteristics change at this time point.
DNA methylation could repress gene transcription and cause transcriptional downregulation, which in turn leads to abnormal cell proliferation, migration and invasion (Lin and Wang Citation2014; Meng et al. Citation2015; Ng and Yu Citation2015). Aberrant promoter methylation is one of the most common causes of tumor suppressor gene inactivation, suggesting that DNA methylation plays a crucial role in tumor growth mechanisms (Zhang et al. Citation2017).
In contrast to genetic changes, epigenetic changes have the property of producing genetic effects yet being reversible. Methylation transferase inhibitors such as 5-aza-cdr are demethylating agents that can reactivate the expression and function of methylated genes (including tumor suppressor genes) through demethylation. Therefore, gene methylation has become a research hotspot for new antitumor drugs, and considerable progress has been made in the development of drugs targeting DNA demethylation. 5-aza-cdr can demethylate methylated genes and upregulate their expression levels, thereby restoring the expression of tumor suppressor genes, and thus has been used in the clinical treatment of tumors.
Tumors show genome-wide DNA hypermethylation and hypermethylation of CpG islands in gene promoter regions, both of which play a role in tumorigenesis (Mirza et al. Citation2010). Hypomethylation provides an advantage for cell formation of tumors, and DNA hypomethylation has been shown to promote tumor cell proliferation (Buhmeida et al. Citation2011). Changes in genome-wide DNA methylation levels can affect chromatin structure and thus genome stability (Li et al. Citation2017). Genome-wide methylation can cause chromosomal conformational opening and transcriptional activation, leading to chromosomal instability and abnormal gene expression (Tirado-Magallanes et al. Citation2017). In the current study, genome-wide methylation was reduced by GMA in 10th, 20th, and 30th generation 16HBE cells, while treatment with the methylation transferase inhibitor 5-aza-cdr increased methylation levels in 10th and 20th generation cells. These results demonstrated low genome-wide methylation levels in GMA-treated cells at different points during the malignant transformation process, especially in 10th generation cells. In the current study, genome-wide methylation was reduced by GMA in 10th, 20th and 30th generation 16HBE cells, while methylation levels increased in 10th and 20th generation cells after treatment with the methylation transferase inhibitor 5-aza-cdr. These results suggest that 5-aza-cdr may be reversibly genome-wide methylated at an early stage in the malignant transformation process.
Transient receptor potential vanilloid subfamily member 1 (TRPV1) is a nociceptive receptor in peripheral nerve fibers that is critical in cancer pain (Wan Citation2016). We demonstrated methylation silencing of the TRPV1 gene in 30th generation cells and showed that this change was closely associated with gene expression levels. Previous studies suggest that TRPV1 may be involved in the physiological and pathological processes of tumors. It has anti-tumor effects and promotes apoptosis of tumor cells by inhibiting their proliferation and migration (Zheng et al. Citation2016). Superoxide dismutase (SOD) plays an important role in detoxifying superoxide radicals, and SOD2 protects cells from ROS-stimulated oxidative damage. In addition, SOD2 has been suggested to be a tumor suppressor in prostate cancer cells (Kang et al. Citation2007). It is likely that SOD2 and TRPV1 exert important tumor suppressive functions in the mid-transformation stage, but their expression levels decrease and the suppressive function is diminished in the late transformation stage due to methylation, leading to malignant transformation. In the present study, the expression level of SOD2 was increased in cells treated with GMA + 5-aza-cdr at all time points compared with GMA alone, suggesting that 5-aza-cdr promoted the expression of the SOD2 gene during the GMA-induced malignant transformation of 16HBE cells. Therefore, treatment with methyltransferase inhibitors restored the function of the relevant genes.
Conclusion
This line of research analyzed the expression of DNA methylation silencing genes at different points during the malignant transformation of 16HBE cells. The results help to elucidate the mechanism of GMA-induced malignant transformation and explore potential early biomarkers of this process.
Author contributions
Boshen Wang, Baoli Zhu and Miao Wang were involved in the conception and design of the manuscript. Quankai Wang, Boshen Wang, Jianning Xu, Miao Wang, Xinwei Li, and Huanhuan Li participated in the collection and analysis of samples and analysis and interpretation of the data. Quankai Wang, Boshen Wang, Huanhuan Li, Miao Wang and Xinwei Li wrote the manuscript with assistance from Baoli Zhu and Jianning Xu. Baoli Zhu and Jianning Xu provided administrative oversight. Quankai Wang, Boshen Wang, Jianning Xu, Xinwei Li, and Baoli Zhu revised the manuscript. All authors read and provided input to the final manuscript.
Availability of data and material
The data that support the findings of this study are openly available in figshare at https://doi.org/10.6084/m9.figshare.22642948.
Declaration of conflicting interests
The authors declared no potential conflicts of interest for this article's research, authorship, and/or publication.
Disclosure statement
No potential conflict of interest was reported by the author(s).
Additional information
Funding
References
- Buhmeida A, Merdad A, Al-Maghrabi J, Al-Thobaiti F, Ata M, Bugis A, Syrjanen K, Abuzenadah A, Chaudhary A, Gari M, et al. 2011. RASSF1A methylation is predictive of poor prognosis in female breast cancer in a background of overall low methylation frequency. Anticancer Res 31:2975–2981. Epub 2011/08/27.
- Chamberlain AA, Lin M, Lister RL, Maslov AA, Wang Y, Suzuki M, Wu B, Greally JM, Zheng D, Zhou B. 2014. DNA methylation is developmentally regulated for genes essential for cardiogenesis. J Am Heart Assoc. 3:e000976. Epub 2014/06/21.
- Dobrovolsky VN, Pacheco-Martinez MM, McDaniel LP, Pearce MG, Ding W. 2016. In vivo genotoxicity assessment of acrylamide and glycidyl methacrylate. Food Chem Toxicol. 87:120–127. Epub 2015/12/22.
- Fujita M, Kaneda M. 2017. DNA methylation inhibitor causes cell growth retardation and gene expression changes in feline lymphoma cells. J Vet Med Sci. 79:1352–1358. Epub 2017/06/28.
- group IMV. 2020. Carcinogenicity of some industrial chemical intermediates and solvents. Lancet Oncol 21:25–26. Epub 2019/12/04.
- Kang D, Lee KM, Park SK, Berndt SI, Peters U, Reding D, Chatterjee N, Welch R, Chanock S, Huang WY, et al. 2007. Functional variant of manganese superoxide dismutase (SOD2 V16A) polymorphism is associated with prostate cancer risk in the prostate, lung, colorectal, and ovarian cancer study. Cancer Epidemiol Biomarkers Prev. 16:1581–1586. Epub 2007/07/25.
- Li J, Zhu X, Yu K, Jiang H, Zhang Y, Deng S, Cheng L, Liu X, Zhong J, Zhang X, et al. 2017. Genome-Wide analysis of DNA methylation and acute coronary syndrome. Circ Res. 120:1754–1767. Epub 2017/03/30.
- Lin RK, Wang YC. 2014. Dysregulated transcriptional and post-translational control of DNA methyltransferases in cancer. Cell Biosci. 4:46. Epub 2014/01/01.
- Lyon (FR). 2020. International Agency for Research on Cancer. Some Industrial Chemical Intermediates and Solvents.
- Meng H, Cao Y, Qin J, Song X, Zhang Q, Shi Y, Cao L. 2015. DNA methylation, its mediators and genome integrity. Int J Biol Sci. 11:604–617. Epub 2015/04/22.
- Mirza S, Sharma G, Pandya P, Ralhan R. 2010. Demethylating agent 5-aza-2-deoxycytidine enhances susceptibility of breast cancer cells to anticancer agents. Mol Cell Biochem. 342:101–109. Epub 2010/05/11.
- Nadimpalli SK, Padmanabhan N, Koduru S. 2004. Biochemical and immunological characterization of a glycosylated α-fucosidase from the invertebrate Unio: interaction of the enzyme with its in vivo binding partners. Protein Expr Purif. 37:279–287. Epub 2004/09/11.
- Ng JM, Yu J. 2015. Promoter hypermethylation of tumour suppressor genes as potential biomarkers in colorectal cancer. Int J Mol Sci. 16:2472–2496. Epub 2015/01/27.
- Sharifi-Zarchi A, Gerovska D, Adachi K, Totonchi M, Pezeshk H, Taft RJ, Scholer HR, Chitsaz H, Sadeghi M, Baharvand H, et al. 2017. DNA methylation regulates discrimination of enhancers from promoters through a H3K4me1-H3K4me3 seesaw mechanism. BMC Genomics. 18:964. Epub 2017/12/14.
- Tan ZH, Yu LH, Wei HL, Liu GT. 2010. The protective action of scutellarin against immunological liver injury induced by concanavalin A and its effect on pro-inflammatory cytokines in mice. J Pharm Pharmacol. 59:115–121. Epub 2007/01/18.
- Tirado-Magallanes R, Rebbani K, Lim R, Pradhan S, Benoukraf T. 2017. Whole genome DNA methylation: beyond genes silencing. Oncotarget 8:5629–5637. Epub 2016/11/30.
- Wan Y. 2016. New mechanism of bone cancer pain: tumor tissue-derived endogenous formaldehyde induced bone cancer pain via TRPV1 activation. Adv Exp Med Biol. 904:41–58. Epub 2016/02/24.
- Wang AN, Wang QK, Yang M, Hu J, Dong L, Xu JN. 2014. Experimental study on malignant transformation of human bronchial epithelial cells induced by glycidyl methacrylate and analysis on its methylation. Biomed Environ Sci. 523–530. Epub 2014/07/31.
- Wang H, Feng H, Sun J, Zhou Y, Zhu G, Wu S, Bao W. 2018. Age-associated changes in DNA methylation and expression of the TNFalpha gene in pigs. Genes Genet Syst. 93:191–198. Epub 2018/11/27.
- Wolffe AP, Matzke MA. 1999. Epigenetics: regulation through repression. Science. 286:481–486. Epub 1999/10/16.
- Xie DY, Zhang W, Cao LF, Sun WQ, Li ZS, Gao Q, Wu YL, Gao HL, Yang HF, Zuo J, et al. 1990. Studies of the genotoxicity of glycidyl methacrylate (GMA). Biomed Environ Sci. Sep. 3:281–289. Epub 1990/09/01.
- Zhang Z, Xin S, Gao M, Cai Y. 2017. Promoter hypermethylation of MGMT gene may contribute to the pathogenesis of gastric cancer: a PRISMA-compliant meta-analysis. Medicine (Baltimore). 96:e6708. Epub 2017/04/27.
- Zheng L, Chen J, Ma Z, Liu W, Yang F, Yang Z, Wang K, Wang X, He D, Li L, et al. 2016. Capsaicin enhances anti-proliferation efficacy of pirarubicin via activating TRPV1 and inhibiting PCNA nuclear translocation in 5637 cells. Mol Med Rep. 881–887. Epub 2015/12/10.
- Zhu WG, Otterson GA. 2003. The interaction of histone deacetylase inhibitors and DNA methyltransferase inhibitors in the treatment of human cancer cells. Curr Med Chem Anticancer Agents. 3:187–199. Epub 2003/05/29.