
Abstract
Diabetic peripheral neuropathy (DPN) is a common complication of diabetes mellitus. Recent studies have explored the involvement of long non-coding RNA (lncRNA) in diabetes, but its specific role in DPN development remains unclear. To investigate the association between lncRNAs and DPN, we conducted comprehensive bioinformatics analyses. We obtained gene expression data from the sciatic nerve of 8-week-old and 24-week-old diabetic mice from the Gene Expression Omnibus database (GEO). Weighted gene co-expression network analysis (WGCNA) was performed to identify co-expression modules and hub differentially expressed genes (DEGs). Gene Ontology (GO), Kyoto Encyclopedia of Genes and Genomes (KEGG), and other bioinformatics methods were used to establish the biological processes and functions of the differentially expressed RNAs related to DPN. The identified hub genes were validated using an animal model of DPN and quantitative real-time polymerase chain reaction. Two lncRNAs (DIO3OS and A530053G22Rik) and three mRNAs (FGF18, DUSP3, and DUSP9) were identified as potential DPN-related genes, potentially affecting DPN through the MAPK pathway. Five hub genes were identified as potential biomarkers for the diagnosis and treatment of DPN, based on the GEO database.
1. Introduction
In recent years, the incidence of diabetes has increased sharply, and the incidence of diabetic peripheral neuropathy (DPN) has also shown a significant upward trend (Alexander et al. Citation2016; Saeedi et al. Citation2019). As a type of neuropathy, DPN is characterized by multiple clinical manifestations (American Diabetes Association Citation2020). DPN has a high rate of injury and disability, with studies showing that it can cause 50–70% of non-traumatic amputations and mortality rates of 25–50% within 5–10 years (Vinik Citation2016; Feldman et al. Citation2017; Furukawa et al. Citation2017; Pop-Busui et al. Citation2017; Iqbal et al. Citation2018; Selvarajah et al. Citation2019; Sun et al. Citation2020). The onset of DPN is insidious and slow, and the pathogenesis is complex (Selvarajah et al. Citation2019; American Diabetes Association Citation2020). At present, there are no effective measures to prevent or reverse DPN (Vinik Citation2016; Selvarajah et al. Citation2019; American Diabetes Association Citation2020). Early identification and early appropriate intervention are important for the prevention and treatment of DPN (Selvarajah et al. Citation2019; American Diabetes Association Citation2020). Therefore, the identification of molecular markers of DPN is of great significance for early diagnosis, early detection, early treatment, and exploring the possible pathogenesis of DPN.
In the past two or three decades, studies of DPN have mostly focused on the pathways related to neuronal metabolism and/or redox state. However, due to the complexity of DPN pathogenesis, the pathogenesis is still controversial. In recent years, bioinformatics analysis based on microarray data has provided the possibility to identify disease-related biomarkers. Long non-coding RNAs (lncRNAs) are RNA molecules spanning a length of more than 200 bp (Zhao et al. Citation2016; Marchese and Huarte Citation2017). lncRNAs play a substantial role in cellular processes and molecular signals (Chang and Wang Citation2019; Leung et al. Citation2019), and increasing evidence shows that lncRNAs are also involved in cellular processes related to diabetic microvascular complications (Pande et al. Citation2011; Leti and DiStefano Citation2017; Goyal et al. Citation2018; Leung and Natarajan Citation2018). Therefore, a comprehensive analysis of lncRNAs and messenger RNAs (mRNAs) will help understand the mechanisms underlying the occurrence and development of DPN.
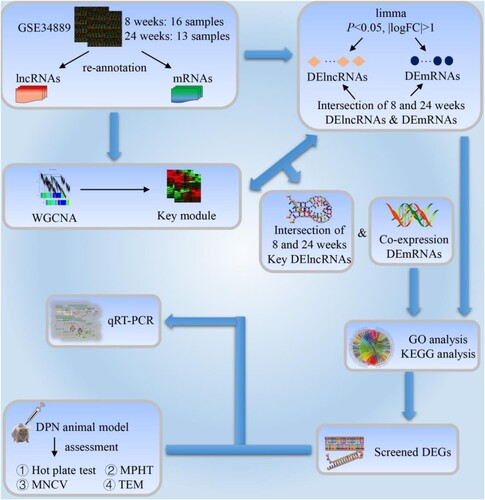
In this study, data from the Gene Expression Omnibus (GEO) database were used to analyze the expression profiles of lncRNAs and mRNAs in the sciatic nerve (SCN) of BKS.Cg-m+/+Leprdb/J mice. Figure shows a flow diagram of the study protocol. The biological processes and functions of differential mRNAs related to DPN were established by Gene Ontology (GO), Kyoto Encyclopedia of Genes and Genomes (KEGG), and other bioinformatics methods. Then, we further constructed the co-expression information of lncRNA-mRNA through weighted gene co-expression network analysis (WGCNA) to determine the possible biological role of hub lncRNAs. Finally, we verified the screened differential expressed genes (DEGs) through experiments.
Figure 1. Study workflow. lncRNAs: long-chain non-coding RNAs; mRNAs: messenger RNAs; DElncRNAs: differential expression lncRNAs; DEmRNAs: differential expression mRNAs; WGCNA: weighted gene co-expression network analysis; GO: Gene Ontology; KEGG: Kyoto Encyclopedia of Genes and Genomes; DPN: diabetic peripheral neuropathy; MPHT: mechanical pain hypersensitivity test; MNCV: motor nerve conduction velocity; TEM: transmission electron microscope; qRT-PCR: quantitative real-time polymerase chain reaction; DEGs: differential expression genes.
2. Materials and methods
2.1. Affymetrix microarray data of genes associated with diabetic neuropathy
The gene expression dataset (GSE34889) was downloaded from GEO, according to a previous study by Pande et al (Pande et al. Citation2011). In this study, BKS.Cg-m+/+Leprdb/J mice were sacrificed at 8 and 24 weeks to obtain their SCN. The mice were divided into 4 groups with 29 samples (8 weeks: db/db (n = 8), db/+ (n = 8); 24 weeks: db/db (n = 6), db/+ (n = 7)). The GPL9746 Affymetrix Gene Chip Mouse Genome 430 2.0 Array (CDF: Mouse4302_Mm_ENTREZG.cdf version 12.0.0) (Affymetrix, ZMF, University Heidelberg, Theodor-Kutzer-Ufer, Mannheim, Germany) was used to download the original files and annotation information files of the dataset simultaneously.
2.2. Gene re-annotation
The R software (version3.6.0, www.r-project.org, hereinafter referred to as R) was used to compare the annotated gene symbol of the platform with the mouse comprehensive gene annotation available in the GENCODE database. Each probe in the annotation platform maps one or more gene names. When a probe mapped multiple gene names, the probe information was deleted, and the average expression value of the probe was calculated when the same gene was mapped by multiple probes. Only protein-coding and long non-coding gene information was retained.
2.3. Identification of co-expression gene networks between hub genes and DPN through WGCNA
The 8-week and 24-week re-annotated gene expression profiles were analyzed by WGCNA (using WGCNA package Langfelder and Horvath Citation2008 in R). Taking lncRNAs as the standard, the modules with the most intersecting lncRNAs were selected for analysis. Simply put, the modules with lncRNAs ≥ 4 at 8 and 24 weeks were compared and intersected, and then the number of intersecting lncRNAs was obtained. Finally, the lncRNAs and their co-expressed mRNAs with the highest number of intersections were selected for further analysis.
2.4. Visualization of gene expression patterns and chromosome locations
The OmicCircos (Hu et al. Citation2014) package in R was used to visualize the expression pattern and chromosome position of the lncRNA co-expression genes selected in WGCNA analysis.
2.5. Functional enrichment analyses
DAVID 6.8 was used for GO enrichment, and pathway enrichment was performed using KEGG.
2.6. Animals and DPN model
2.6.1. Overview of DPN animal model
Since the 1960s, researchers have developed a variety of DPN models in rats, mice, sheep, rabbits, dogs, monkeys and other experimental animals by means of dietary induction, diet combined with chemical induction, chemical induction combined with surgery, simple operation, gene knockout and other methods. Most studies use gene knockout models or diet combined with chemical induction models, and 98.6% of all experimental animal models are constructed with the use of rodents (Wang and Xu Citation2020).
Among the DPN models constructed by gene knockout, the most classic are db/db mice and ob/ob mice, in which db/db mice are widely used animal models of type 2 diabetes. It comes from the Jackson Laboratory and is a homozygous mouse with spontaneous mutation (Leprdb) of diabetes. This model was found by Bar Harbor in C57BLKS/J (BKS) inbred line in 1966. It is called db mouse because its phenotype of hyperglycemia, polyuria and high urine glucose level is similar to that of human diabetic patients (Hummel et al. Citation1966). db/db mice not only have typical clinical manifestations of diabetes but also show diabetic complications such as cardiomyopathy, peripheral neuropathy, diabetic nephropathy, diabetic retinopathy and so on. Due to the sterility of homozygous db/db mice, it is necessary to reproduce by heterozygote mating. There are three phenotypes in the progeny of heterozygous db/+ and db/+ mating: 1/4 obese mice, db/db, used in experiments; 1/2 lean mice, db/+, used in further reproduction or as experimental controls; and 1/4 lean mice, +/+, which can be used as experimental controls. But in experiments, db/+ mice are usually used as controls, instead of +/+ mice. This is due to the fact that the +gene has a great effect on the metabolism of mice. The body length and weight of +/+ mice are significantly lower than those of the control, there is less inguinal fat and complete loss of brown fat (Truett et al. Citation1998). Details of the model can be found in the Jackson Laboratory's breeding guide ‘Breeding Strategies for Maintaining Colonies of Laboratory Mice'. In addition, KK/Upj-Ay mice, Goto-Kakizaki rats and Zucker diabetic fatty rats also play a role in the DPN model constructed by gene knockout.
Diet combined with chemical induction models is popular among researchers because of their low cost. These models are established to simulate the pathogenesis of type 2 diabetes and have a more obvious phenotype than the model established by the gene knockout method (Wright et al. Citation2007). At present, the diet combined with the chemical induction model is mainly induced by a high-fat diet and high-glucose water (HFD-HGW) combined with streptozotocin (STZ) injection, and most of the animals used are Sprague–Dawley rats, Wistar rats, Long-Evans rats, C57BL/6 mice and Balb/c mice. The rat or mouse model based on diet combined with chemical induction is very mature, but the non-human primate model (such as rhesus monkey) is still in its infancy.
2.6.2. Mice model of DPN
Sixteen 8-week-old specific pathogen-free (SPF) male C57BL/6 mice, weighing 18–23 g, were purchased from the Animal Experimental Center of Anhui Medical University, and the mice were healthy and responsive. The mice were acclimatized for a week with free drinking water, food intake, and natural light, with an ambient temperature of 20–22℃ and a humidity of 40–60%.
The diabetic mouse model was established by an HFD-HGW combined with low-dose STZ. The mice were randomly divided into a model group (n = 8) and a control group (n = 8) using the random number table method. On the basis of following the 3R principle of experimental animals, the sample size of animal experiments was estimated by ‘variance analysis degree of freedom (E)', and the value of E was in the range of 10–20. E = total number of experimental animals in each group – number of groups. In addition, we also accounted for losses due to animal model failure or animal death, which was estimated at approximately 20%. The normal group was fed with ordinary mouse feed, and the model group was fed with HFD-HGW, for a total of 2 weeks. After fasting but not abstaining from water for 12 h, the model group was intraperitoneally injected with STZ (Sigma Company, USA). STZ was dissolved in citric acid buffer (0.1M, pH 4.5 at 4℃) and was injected at a dose of 35 mg/kg. The control group was injected with the same amount of citric acid buffer.
On day 3 after STZ injection, the caudal vein blood glucose level was measured by a blood glucose meter (Roche, USA), and a blood glucose level > 16.7 mmol/L was defined as diabetes. Both groups were continuously measured for non-fasting blood glucose levels, body weight, water intake, food intake and urine volume. Urine volume was measured using a metabolic cage to collect 24-hour urine samples. After injecting inducible drugs, the mice were fed for another 8 weeks to establish the DPN model. During this period, all excluded mice were to be anesthetized with 3% barbital sodium and killed.
The animal study protocols were approved by the Experimental Animal Ethics Committee of the Anhui University of Chinese Medicine (AHUCM-rats-2020031). All the operations and experimental procedures were conducted in accordance with the ethical standards of the Laboratory Animal Guideline for review of animal welfare, the National Standard of the People's Republic of China (GB/T35892-2018) and the Guide for the Care and Use of Laboratory Animals: Eighth Edition (ISBN: 9787547812969). Minimization of potential confounding factors was mainly carried out from the following aspects: use of multiple experimental designs to verify the results, such as using multiple behavioral measures to mask the effects of confounding factors; adoption of strict experiment control strategy to ensure the consistency of experimental conditions; random division of the experimental group and the control group to control possible confounding factors; and strict grasping of the experimental process and minimizing of possible influencing factors.
2.7. Assessment of the DPN model
2.7.1. Hot plate test
Each mouse was put on a hot plate maintained at a temperature of 55–56℃, and the time of licking or jumping was recorded in seconds. However, to prevent painful arches of mouse feet, a 30-s cutoff was set.
2.7.2. Determination of temperature threshold of tail swinging in mice
The mice were moderately confined in cages to expose their tails. The water temperature was heated by a constant temperature heater (heated at 2℃ per minute) and when the water temperature reached 40℃, the tail of each mouse was immersed in warm water at a depth of 2 cm. When the mouse tail swung due to the increase in the water temperature, it was lifted out of the water, and the time when the mouse tail was put into the water was recorded. The water temperature at which the tail swing was set as the threshold temperature.
2.7.3. Mechanical pain hypersensitivity test
The withdrawal threshold of the hindfoot in mice was measured by an electronic pain meter (Electronic Von Frey). First, the mice were placed separately in a polymer resin cage with a metal grid on the bottom plate, and the mice were allowed at least 10 min to adapt to the environment or enough time to stop exploring behavior. Then, a device with a metal tip was used to stimulate the posterior soles of the mice from the metal grid at the bottom, and when the mice had a positive reaction, the intensity of the stimulation was recorded. Positive reactions include shrinking, shaking or licking the stimulated soles of the foot, but exclude spontaneous movement. Each mouse was tested 5 times, and the interval between every two times was not less than 2 min. The average of the stimulation intensity obtained by the soles of both posterior feet was used to determine the withdrawal threshold of each mouse foot.
2.7.4. Measurement of SCN motor nerve conduction velocity (MNCV) in mice
The mice were anesthetized by intraperitoneal injection of 4% water and chloral (0.1 mL/10 g), and then the electrode was inserted into the left ischial notch. The recording electrode was inserted between the ankle (distal) and the second toe of the left plantar, respectively, and connected with the Power Lab 8/30 biological signal acquisition and processing system (Australian AD Instruments). The latency of action potential produced by the distal and proximal SCN was recorded, the distance between the two recording electrodes was measured, and the MNCV was calculated using the following formula: MNCV = the distance between electrodes (cm)/action potential latency (s). The parameters of a single rectangular pulse applied by the instrument were as follows: duration 0.2 ms, current 10 mA, frequency 40 Hz. Each mouse was stimulated 5 times, and the interval between every two stimuli was not less than 5 s.
2.7.5. Transmission electron microscope (TEM)
The mice were anesthetized by an intraperitoneal injection of 4% water and chloral after fasting but not forbidding drinking water for 12 h. The mice were perfused and fixed with 4% paraformaldehyde at a uniform speed and slowly, and they were successfully perfused with a stiff tail and hardened liver. Then the SCN tissue was quickly removed on ice and fixed with glutaraldehyde-osmic acid. After gradient dehydration, immersion and embedding, sections were stained, and then observed under a TEM (JEM-1230, Japan).
2.8. Quantitative real-time polymerase chain reaction analyses (qRT-PCR)
Total RNA was isolated from the SCN of mice using the TRIzol method, and the purity of RNA was determined. The cDNA was reverse transcribed using the RevertAid First Strand cDNA Synthesis Kit, and amplification was performed by the SYBR Green method. All the reactions were performed in the ABI7500 fluorescence quantitative PCR reaction instrument. The Ct values of the target gene and the internal reference gene ACT1 were measured, and the average value of the experimental results was taken from three independent experiments. The gene expression level was expressed by the 2−ΔΔCt method, and β-actin served as the internal reference. Primer sequences are shown in supplement 1.
2.9. Statistic analyses
The data were statistically analyzed by SPSS 25.0 and were presented as the mean ± standard deviation. Differences between the two groups were analyzed by a Student's t-test. Statistical significance was set at P < 0.05.
3. Results
3.1. Identification of DPN associated differentially expressed lncRNAs and genes based on probe re-annotation
Because lncRNAs have less microarray annotation data in the GEO, we used the re-annotation method to re-annotate the 8-week and 24-week expression profiles (see method). A total of 28,976 mRNAs (including 14,452 at 8 weeks and 14,524 at 24 weeks) and 372 lncRNAs (including 183 at 8 weeks and 189 at 24 weeks) were obtained (see supplement 2 and figure S1 of supplement 3). According to the reannotated results, we used the limma (Ritchie et al. Citation2015) package in R to analyze the differential genes of DPN and normal group at 8-week and 24-week samples respectively, used a t-test to calculate P-value, and adjusted Benjamini-Hochberg to avoid false positive results. Finally, we obtained the log2–fold–change (logFC) and P-value of the corresponding gene. In this study, only genes with P < 0.05 and |logFC| > 1 were selected as DEGs for analysis. We identified 1861 differentially expressed mRNAs (DEmRNAs), 8-week 494 (up-regulated 303, down-regulated 191), 24-week 1367 (up-regulated 567, down-regulated 800), 16 differentially expressed lncRNAs (DElncRNAs), 8-week 5 (up-regulated 3, down-regulated 2), 24-week 11 (up-regulated 5, down-regulated 6) (see supplement 4 and figures S2-S8 of supplement 3). These DEGs may be potential key genes involved in the occurrence and development of DPN.
3.2. Biological function analyses of DEGs
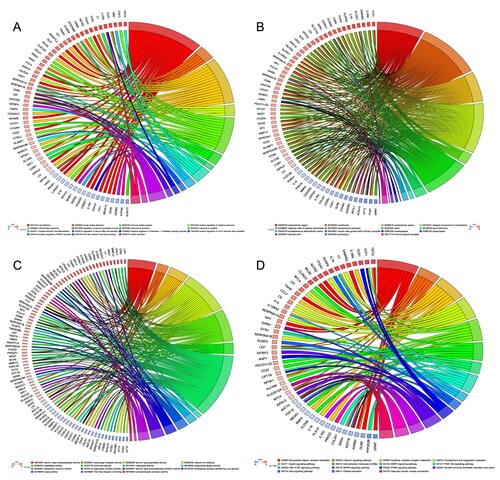
We intersected the DEmRNAs at 8 and 24 weeks to obtain 323 DEGs, and GO and KEGG analyses revealed the biological functions of these DEGs (see supplement 5). GO enrichment showed that a total of 73 biological processes (BPs), 30 cellular components (CCs) and 26 molecular functions (MFs) were enriched in these DEGs. BP enrichment was mainly concentrated in biological functions related to cellular inflammation or immunomodulatory processes, such as ‘cell adhesion (GO:0007155)', ‘immune system process (GO:0002376)', ‘inflammatory response (GO:0006954)' and ‘positive regulation of MAPK cascade (GO:0043410)' (see Figure (A)). CC enrichment was mostly concentrated in the structures related to the composition of membranous cells, such as ‘axon (GO:0030424)', ‘immunological synapse (GO:0001772)' and ‘spindle pole (GO:0000922)' (see Figure (B)). MF enrichment was mainly concentrated in the enzyme activity functions of activating or inhibiting signal pathways such as ‘serine-type endopeptidase activity (GO:0004252)', ‘serine-type peptidase activity (GO:0008236)', ‘serine-type endopeptidase inhibitor activity (GO:0004867)' and ‘calcium ion binding (GO:0005509)' (see Figure (C)). In KEGG analyses, we obtained 213 pathways, including metabolic pathways, neuroactive ligand–receptor interaction, calcium signaling pathway, PI3K–Akt signaling pathway, cAMP signaling pathway, and MAPK signaling pathway (see Figure (D)). Interestingly, these pathways were enriched not only in known and common pathways that affect diabetes, but also in signaling pathways that affect cancer.
Figure 2. GO and KEGG analysis of differential expression genes. (A) CP showing the relationship between genes and GO of biological process. (B) CP showing the relationship between genes and GO of cellular component. (C) CP showing the relationship between genes and GO of molecular function. (D) CP depicts the relationship between genes and KEGG pathways. GO: Gene Ontology; KEGG: Kyoto Encyclopedia of Genes and Genomes; CP: chord plot.
3.3 WGCNA analyses and module selection
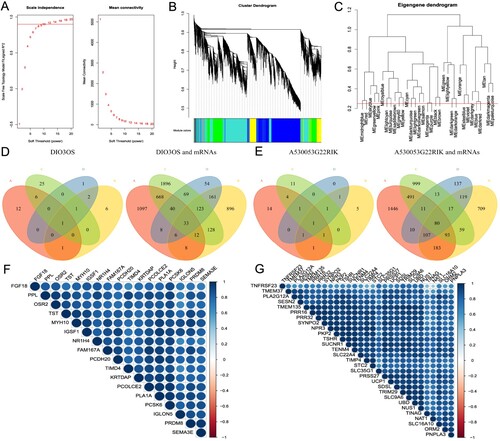
To identify hub genes that may affect the occurrence and development of DPN, we used WGCNA to analyze DEGs. Through the analysis of scale independence and average connectivity, we chose 12 (scale-free R2 = 0.90) as the best soft-threshold power, 0.25 as the cut height and 30 as the minimum module size to build a co-expression module (see Figure (A–C)). We obtained 30 modules in the 8-week reannotated gene expression profile, including 15 modules with lncRNAs-number ≥ 4, and 35 modules in the 24-week reannotated gene expression profile, including 15 modules with lncRNAs-number ≥ 4. We compared the modules with lncRNAs-number ≥ 4 at 8 and 24 weeks to obtain 225 intersections, and then took the intersection in the top-one for follow-up analysis. Then, we obtained the intersection of the 8-week turquoise module and 24-week brown module (7 lncRNA); as well as the 8-week blue module and 24-week turquoise module (7 lncRNA). Finally, we intersected the two top-one intersections with DElncRNAs and DEmRNAs in 3.1 to get lncRNA-DIO3OS and 33 co-expressed and differentially expressed mRNAs (Co-DEmRNAs), lncRNA-A530053G22Rik and 80 Co-DEmRNAs (see Figure (D,E)). Simultaneously, heat maps were generated by Co-DEmRNAs with superior connectivity to lncRNA revealing that their expression levels were in good agreement (see Figure (F,G)).
Figure 3. WGCNA analyses and key module selection. (A) Analysis of the scale independence (left) and the mean connectivity (right) for various soft-thresholding powers. (B) Dendrogram of all genes clustered based on a dissimilarity measure. (C) Clustering of module eigengenes. The red line indicates cut height (0.25). (D) The Venn diagram of DIO3OS and Co-DEmRNAs was obtained with different gene sets. A indicates 24 weeks brown module co-expressed mRNAs; B indicates 24 weeks DEmRNAs; C indicates 8 weeks turquoise module co-expressed mRNAs; D indicates 8 weeks DEmRNAs. (E) The Venn diagram of A530053G22Rik and Co-DEmRNAs was obtained with different gene sets. A indicates 24 weeks turquoise module co-expressed mRNAs; B indicates 24 weeks DEmRNAs; C indicates 8 weeks blue module co-expressed mRNAs; D indicates 8weeks DEmRNAs. (F) A heat map drawn with the Co-DEmRNAs with the highest connectivity to DIO3OS. (G) A heat map drawn with the Co-DEmRNAs with the highest connectivity to A530053G22Rik. WGCNA: weighted gene co-expression network analysis; DEmRNAs: differential expression mRNAs; Co-DEmRNAs: co-expressed and differential expression mRNAs.
3.4. Visualization of gene expression patterns and chromosome locations
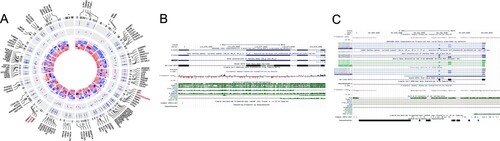
We visualized the co-expressed and differentially expressed genes (Co-DEGs) in step 3.3 to understand their location on mouse chromosomes and Figure (A) shows that DIO3OS and A530053G22Rik are located on chromosomes 12 and 6, respectively. According to UCSC, DIO3OS is highly conserved and has multiple arrangements in 30 species of vertebrates (see Figure (B)), however, A530053G22Rik is less conserved and UCSC shows multiple arrangements in only three species of vertebrates (see Figure (C)). Co-DEGs were enriched on all chromosomes except the Y chromosome, with the highest enrichment on chromosome 7, followed by chromosome 5. According to the corrected P-value, we found that the top-five genes (UBD, IRAK2, SLC9A6, TRIM29, and TMEM135) with the most significant up-regulation were on chromosomes 17, 6, X, 9 and 7, respectively, and the top-five genes (CGREF1, ECE2, CYP2F2, MYH10, and TST) with the most significant down-regulation were on chromosomes 5, 16, 7, 11 and 15, respectively.
Figure 4. (A) Circular visualization of connectivity, expression patterns, and chromosomal positions of Co-DEGs. Red indicates gene up-regulation, blue represents down-regulation, and white denotes genes not present in a given dataset. The outer circle represents chromosomes; lines coming from each gene point to their specific chromosomal locations. The lncRNAs (DIO3OS and A530053G22Rik) are shown in red. (B) The arrangement pattern diagram of vertebrates shown by DIO3OS on UCSC. (C) The arrangement pattern diagram of vertebrates shown by A530053G22Rik on UCSC. Co-DEGs: co-expressed and differential expression genes; UCSC: University of California Santa Cruz Genome Browser.
3.5. Functional enrichment analyses of co-DEGs
Regarding DIO3O, the genes were enriched in GO BP terms such as ‘activation of adenylate cyclase activity', ‘adenylate cyclase-activating G-protein coupled receptor signaling pathway' and ‘negative regulation of angiogenesis', CC terms such as ‘extracellular region', and MF terms such as ‘heparin binding' (see Figure (A) and supplement 6).
Figure 5. Functional enrichment analyses of Co-DEGs. (A) GO enrichment of DIO3OS Co-DEGs. (B) GO enrichment of A530053G22RIK Co-DEGs. (C) The correlation diagram between DIO3OS and A530053G22RIK. (D) The correlation diagram between DIO3OS and FGF18, DUSP3, DUSP9. (E) The correlation diagram between A530053G22RIK and FGF18, DUSP3, DUSP9. The orange GO terms indicate biological process, the light green GO terms represent cellular component, and the blue GO terms denote molecular function. Co-DEGs: co-expressed and differential expression genes; GO: Gene Ontology.
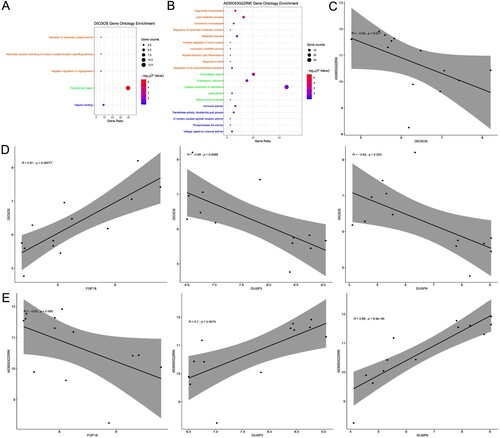
In the case of A530053G22RIK, GO enrichment analysis showed that the results of BP enrichment mainly focused on the regulation of metabolites, such as ‘inactivation of MAPK activity', ‘negative regulation of lipoprotein lipase activity' and ‘myeloid dendritic cell differentiation' and in the case of CC, it was mainly concentrated on the cell membrane or the membrane of some organelles, such as ‘integral component of membrane', ‘endoplasmic reticulum', and ‘mitochondrial envelope'. Meanwhile, it was enriched in MF terms such as ‘hormone activity', ‘transferase activity, transferring acyl groups' and ‘G-protein coupled peptide receptor activity' (see Figure (B) and supplement 6).
In the KEGG pathway analysis, we obtained 87 and 89 pathways for the Co-DEGs of DIO3OS and A530053G22RIK, respectively, of which 36 pathways were common (see supplement 6). Interestingly, these pathways were enriched not only in known and common pathways that affect diabetes, such as ‘MAPK signaling pathway', ‘cysteine and methionine metabolism', and ‘glucagon signaling pathway', but also in signaling pathways that affect cancer. Here, we selected the MAPK signaling pathway, a known and common pathway affecting diabetes, for follow-up analysis. The Co-DEGs enriched in the MAPK signaling pathway were FGF18, DUSP3 and DUSP9, and their expression was strongly correlated with that of the two lncRNAs. The expression of DIO3OS was strongly negatively correlated with that of A530053G22RIK (see Figure (C)). The expression of DIO3OS was positively correlated with that of FGF18, but negatively correlated with that of DUSP3 and DUSP9 (see Figure (D)). Furthermore, the expression of A530053G22RIK was negatively correlated with that of FGF18 but positively correlated with that of DUSP3 and DUSP9 (see Figure (E)).
3.6. DPN mouse model
All DPN mouse models were successful, and there were no exclusions or unexpected animal deaths. The mice in the control group were generally in good condition with healthy appearance, normal appetite, smooth body hair, quick reaction, good mental state, normal food intake, drinking water, and urine volume. In the model group, the body hair lost luster, the hair color was withered and yellow, the response was slow, lazy, depressed, the amount of food intake and drinking water increased significantly, the urine volume increased significantly, and the lower abdomen was wet, and some mice developed lower limb ulcers, decay, and adverse action. We compared the body weight, food intake, water intake, urine volume, blood glucose, hot plate test, temperature threshold of tail swinging, mechanical pain hypersensitivity test and MNCV between the two groups to verify whether the DPN mice were established successfully.
After comparison, we found that the body weight (g) of mice in the model group was significantly lower than that in the control group (25.32 ± 1.67 vs 32.79 ± 1.59, P < 0.001, see Figure (A)). Meanwhile, compared with the control group, the mice in the model group also showed excessive eating behavior (g/24 h) (7.13 ± 0.53 vs 3.86 ± 0.28, P < 0.001, see Figure (B)), polydipsia (mL/24 h) (11.51 ± 0.67 vs 4.34 ± 0.18, P < 0.001, see Figure (C)), polyuria (mL/24 h) (5.02 ± 0.34 vs 1.67 ± 0.16, P < 0.001, see Figure D), and significantly higher blood glucose (mmol/L) (26.78 ± 0.85 vs 6.84 ± 0.32, P < 0.001, see Figure E).
Figure 6. Evaluation of DPN mouse model. (A) body weight. (B) food intake. (C) water intake. (D) urination volume. (E) blood glucose. (F) hot plate test. (G) swinging tail threshold. (H) mechanical pain threshold. (I) MNCV. n = 8 per group, **P < 0.001. DPN: diabetic peripheral neuropathy; SCN: sciatic nerve; MNCV: motor nerve conduction velocity.
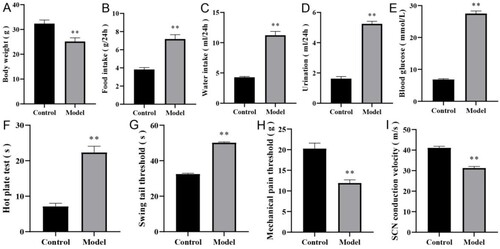
The behavioral test showed that compared with the control group, in the model group, the latent period of hot plate reaction was prolonged (s) (7.23 ± 1.48 vs 21.62 ± 4.91, P < 0.001, see Figure (F)), the temperature threshold of tail swinging was significantly increased (s) (32.52 ± 0.42 vs 50.61 ± 0.47, P < 0.001, see Figure (G)), the mechanical pain threshold was significantly decreased (g) (20.33 ± 2.59 vs 11.87 ± 1.08, P < 0.001, see Figure (H)), and the MNCV was significantly lower (m/s) (41.63 ± 5.37 vs 30.79 ± 3.12, P < 0.001, see Figure (I)).
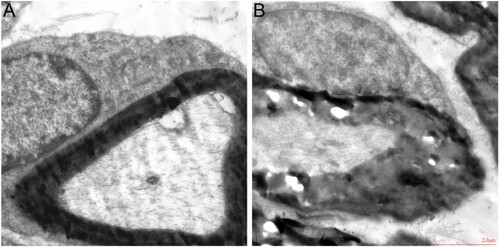
According to TEM analysis, the myelin sheath of SCN myelinated nerve fibers in the control group was dense, uniform, complete, regular and hierarchical, while in the model group, the myelin sheath of SCN myelinated nerve fibers was considerably thickened or loosened, and the matrix in the axon was dense and the microfilaments were disordered (see Figure (A,B)). The above results showed that peripheral neuropathy occurred in diabetic mice.
Figure 7. TEM of SCN of mice (A) control group, (B) model group. Magnification × 3000, scale bar = 2 μm. TEM: transmission electron microscope.
3.7. qRT-PCR validation of the microarray data
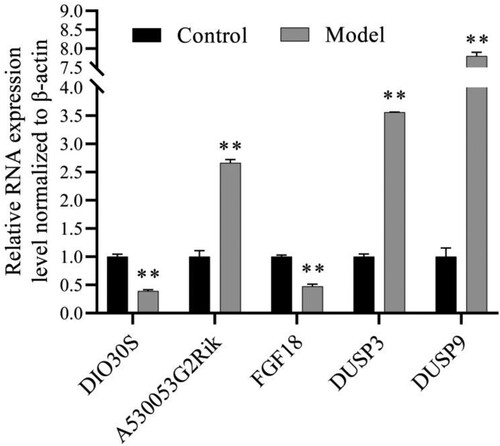
To verify the reliability of the analysis results, we selected 5 genes (2 lncRNAs: DIO3OS and A530053G22Rik, and 3 mRNAs: FGF18, DUSP3. and DUSP9) by qRT-PCR. Figure shows that their expression is consistent with the analysis results.
Figure 8. qRT-PCR analyses to validate the results of bioinformatics analyses. **P < 0.001. qRT-PCR: quantitative real-time polymerase chain reaction.
4. Discussion
The incidence of type 2 diabetes has increased in recent years, making it a global public health problem. DPN is a common consequence of diabetes that causes significant impairment and mortality (Selvarajah et al. Citation2019; American Diabetes Association Citation2020). It not only poses a huge economic burden to society but also affects the daily work and life of patients, resulting in a serious decline in the quality of life of patients (Selvarajah et al. Citation2019; American Diabetes Association Citation2020). Because of the complex pathogenesis of DPN, there is no effective diagnosis and treatment strategy at present. The rapid development of gene sequencing technologies has helped in the identification of DPN-related markers and therapeutic targets. At present, many studies have analyzed the role of RNAs in the pathogenesis of diabetic nephropathy, diabetic retinopathy, or other complications through microarrays (Pande et al. Citation2011; Leti and DiStefano Citation2017; Goyal et al. Citation2018; Leung and Natarajan Citation2018), and at the same time, these studies have achieved certain results and clinical benefits.
In this study, we reannotated the Affymetrix microarray data of DPN mouse SCN and conducted further bioinformatics analysis. We identified five hub genes as potential biomarkers for the diagnosis and treatment of DPN. In addition, we constructed an STZ-induced DPN mouse model to verify these hub genes, which increased the reliability of our analysis results. Previous studies have demonstrated that the physiological and pathological changes of DPN include nerve fiber loss, axonal degeneration, inflammation, disorder of cell metabolism and redox, increased capillary permeability, nerve ischemia, microvascular damage, nerve degeneration, and nerve conduction disorder (Goncalves et al. Citation2017; Jin and Park Citation2018; Richner et al. Citation2018; Zilliox and Russell Citation2019). The clinical features of DPN patients are hyperalgesia, dysesthesia and other nerve fiber damage. Many experiments have confirmed that STZ-induced diabetic mouse models can observe similar changes as human DPN, including slowing of nerve conduction velocity, hyperalgesia, myelin sheath swelling, loss and axonal degeneration. The ‘hot plate test' and ‘swinging tail threshold’ are mainly behavioral measurements from the sensory aspect, while the ‘mechanical pain threshold’ is mainly behavioral measurements from the pain perception aspect. The specific transmission mechanism of sensation and pain is very complex and needs further study. Furthermore, the measurement of sensation also involves the transmission mechanism of temperature sensation and touch sensation, while pain sensation also involves the content of touch, but the current scientific community has not yet elucidated their specific mechanisms. It is encouraging that our findings are consistent with previous studies and further enhance the reliability of these conclusions.
High-glucose levels can not only activate the complement system directly but also cause abnormal regulation and indirect activation of the complement system. Both of them will contribute to the formation of membrane attack complex (MAC), lytic target cells, or mediate the inflammatory response, resulting in target organ and tissue damage (Ajjan and Schroeder Citation2019). Some studies have shown that MAC inserted into the plasma membrane of target cells will release monocyte chemoattractant protein-1 (MCP-1), platelet-derived growth factor (PDGF), interleukin-1 (IL-1), and other growth factors or cytokines, which cause biological effects such as inflammation, thrombosis, and cell proliferation, and participate in the occurrence and development of diabetic microangiopathy (Ghosh et al. Citation2015). Cytochrome P450 metabolites in metabolic pathways can raise intracellular Ca2+ levels to enhance insulin production in cells, improve diabetes insulin resistance via the IR/IRS-1 and PI3K/AKT pathways, and boost glucose absorption via the HO-1/adiponectin/GLUT-435 pathways (Das Citation2018). Cell adhesion molecules (CAMs) are related to the interaction between circulating leukocytes and endothelial cells. The high expression of CAMs can enhance the expression of adhesion molecules of endothelial cells and blood cell components, especially monocytes. In patients with diabetes, monocytes are activated by exposure to high levels of plasma cytokines, resulting in increased expression of growth factors, cytokines, and oxygen free radicals in injured endothelial cells, causing platelet adhesion and thrombosis, and also promoting the proliferation of vascular smooth muscle cells. Microvascular occlusion causes peripheral nerve ischemia and hypoxia, which leads to DPN (Jude et al. Citation1998). The PI3K/AKT signal pathway can participate in the regulation of glucose metabolism in vivo and is a part of the intracellular targets of hyperglycemia and apoptosis (Huang et al. Citation2018). Studies have shown that the apoptosis of peripheral nerve cells is a significant factor leading to the pathogenesis of DPN and that the PI3K/AKT signal pathway can regulate apoptosis by regulating the phosphorylation of the caspase family (Yang et al. Citation2014). In the PI3K/AKT signaling pathway, insulin-like growth factor I can markedly inhibit the splicing activation of precursors including caspase-9 and caspase-3, thus blocking the apoptosis induced by high-glucose levels (Chen et al. Citation2017). Bilir et al. (Citation2016) found that the level of serum apelin in patients with DPN was significantly increased and that apelin might be related to endothelial dysfunction and microvascular changes in patients with diabetes. Apelin-13 and hypoxia-treated peripheral blood monocytes can significantly improve blood perfusion and restore vascular function by promoting angiogenesis and migration and can treat peripheral ischemic diseases, suggesting that apelin may treat DPN (Wu et al. Citation2017). In addition, many studies have shown that changes in metabolic status caused by a high-glucose environment activate the MAPK signaling pathway in the spinal cord and peripheral nerves, which then activate neurons and glial cells and promote the release of various inflammatory mediators and pain transmitters, thereby causing central pain sensitization and leading to diabetic neuropathic pain (Dewanjee et al. Citation2018).
DIO3OS is located on 12F1 and 14q32.31 on the mouse and human chromosomes, respectively, and is highly expressed during pregnancy or development. Its main function is to regulate thyroid hormones (THs) and inactivate them (Hernandez et al. Citation2006). THs are very important for the normal development of vertebrates, especially for cell proliferation and differentiation (Calza et al. Citation2015). Many genes encoding proteins related to cell terminal differentiation are regulated by THs, such as cytoskeleton proteins, neurotrophin and neurotrophin receptors, and extracellular matrix proteins, which play an important role in neuronal migration and differentiation, as well as axonal growth, guidance, and bunching (Calza et al. Citation2015). Some studies have demonstrated that the expression of DIO3OS is decreased in inflammatory-mediated diseases, which is consistent with the results of our analysis (Wang et al. Citation2018). Previous studies have shown that DIO3OS is not only associated with the risk of type I diabetes (Wallace et al. Citation2010), but also its SNPrs8008758 site can interact with alcohol, increasing the body mass index (Velez Edwards et al. Citation2013). These findings imply that DIO3OS may have diagnostic relevance in the identification of DPN, and that it might be used as a biomarker for DPN diagnosis. A530053G22Rik, which is located on mouse chromosome 6B3, is highly expressed in the reproductive system of adult mice, and its co-expressed DEmRNAs regulate the development of immune and nervous systems.
FGF18, a member of the fibroblast growth factor family, plays an important role in regulating cell proliferation, differentiation, and migration. FGF18 can induce the growth of synaptic cells. Moore and Elseworth (Citationn.d.) found that FGF18 had advantages in the treatment of IL-1-mediated diseases, finding that in the treatment of IL-1-mediated disease, the use of both FGF18 and IL-1 antagonists enhanced the therapeutic effect of FGF18. This in turn not only relieves the symptoms of the disease, but also repairs cartilage, bone, or nerve tissue damage caused by the disease, facilitating the treatment of diabetes. A vast number of prior studies have shown that dephosphorylation of DUSP3 and DUSP9 can limit the production of p-ERK, p-JNK, and p-P38, and that activation of the MAPK/ERK/JNK/P38 signaling pathway can lead to DPN or other diabetic complications. Tautz et al. (Citation2015) found that DUSP3 can be used as a new specific drug for the treatment of vascular embolism; hence, the blockage of microvessels in DPN may promote the high expression of DUSP3 and lead to a vicious circle. Meanwhile, a large number of studies have shown that the DUSP9 locus on chromosome X is a susceptibility locus for type 2 diabetes (Voight et al. Citation2010; Fukuda et al. Citation2012). The MAPK signaling pathway regulates various basic cellular activities, including embryonic development, cell proliferation, cell differentiation, and apoptosis, through various signals from the cell surface, internal environment, and metabolic state. A large number of studies have confirmed that a disorder of the cascade regulation of this signal pathway can lead to the occurrence and development of diabetes. In the constructed diabetic mice, the expression of two lncRNAs (DIO3OS and A530053G22Rik) and three mRNAs (FGF18, DUSP3, and DUSP9) was consistent with the results of bioinformatics analysis. DIO3OS and A530053G22Rik may affect the occurrence and development of DPN through the MAPK signaling pathway; however, this still needs to be confirmed by further research in the future.
Although we screened out the abnormally expressed lncRNAs and mRNAs, and discussed the mechanism by which they may participate in the occurrence and development of DPN, this study has some limitations. First, our sample size was limited, which may have affected our inference of the research results. Second, we only used WGCNA to screen the co-expressed mRNAs to analyze the function of lncRNA without further in-depth verification. Moreover, we only analyzed the SCN tissues of 8-week and 24-week-old mice and did not study the gene expression in other time periods or other tissues (such as the dorsal root nerve). In addition, strict blinding was not involved in this study, and the researchers testing the animals knew which group the animals belonged to. It will be important to address these constraints in future studies, as well as to conduct proper verification in human tissues.
5. Conclusion
In the study, we identified five hub genes, 2 lncRNAs: DIO3OS and A530053G22Rik, and 3 mRNAs: FGF18, DUSP3 and DUSP9, as potential biomarkers for the diagnosis and treatment of DPN, followed by experimental verification. In general, our analysis of lncRNA and mRNA expression profiles in SCN of DPN mice at 8 and 24 weeks provided novel insights into the occurrence and development of DNP and provided a reference for further studies on the exact molecular mechanism underlying DPN.
Supplemental Material
Download Zip (5.9 MB)Acknowledgements
(I) Conception and design: D Yu, L You; (II) Administrative support: L You, G Shen; (III) Provision of study materials or patients: D Yu, S Ye, G Shen; (IV) Collection and assembly of data: D Yu, Y Wang, F Ma; (V) Data analysis and interpretation: D Yu, Y Wang, Y Guan; (VI) Manuscript writing: All authors; (VII) Final approval of manuscript: All authors.
Disclosure statement
No potential conflict of interest was reported by the authors.
Data availability statement
The data that support the findings of this study are available in Gene Expression Omnibus at https://www.ncbi.nlm.nih.gov/gds, reference number [GSE34889]. The raw data on mice are available at https://doi.org/10.6084/m9.figshare.22723654.v2.
Additional information
Funding
References
- Ajjan RA, Schroeder V. 2019. Role of complement in diabetes. Mol Immunol. 114:270–277. doi:10.1016/j.molimm.2019.07.031.
- Alexander J, Edwards R, Mahdavi A, Baggio T, Parsons B. 2016. Development of an agent-based modeling and simulation platform for improving therapeutic outcomes in patients with painful diabetic peripheral neuropathy. J Pain. 17(4):S19. doi:10.1016/j.jpain.2016.01.077.
- American Diabetes Association. 2020. Microvascular complications and foot care: standards of medical care in diabetes-2020. Diabetes Care. 43(Suppl 1):S135–s151. doi:10.2337/dc20-S011.
- Bilir B, Ekiz Bilir B, Yilmaz I, Soysal Atile N, Yildirim T, Kara SP, Gumustas SA, Orhan AE, Aydin M. 2016. Association of apelin, endoglin and endocan with diabetic peripheral neuropathy in type 2 diabetic patients. Eur Rev Med Pharmacol Sci. 20(5):892–898.
- Calza L, Fernandez M, Giardino L. 2015. Role of the thyroid system in myelination and neural connectivity. Compr Physiol. 5(3):1405–1421. doi:10.1002/cphy.c140035.
- Chang W, Wang J. 2019. Exosomes and their noncoding RNA cargo are emerging as new modulators for diabetes mellitus. Cells. 8(8). doi:10.3390/cells8080853
- Chen C, Bai X, Bi Y, Liu G, Li H, Liu Z, Liu H. 2017. Insulin-like growth factor-1 attenuates apoptosis and protects neurochemical phenotypes of dorsal root ganglion neurons with paclitaxel-induced neurotoxicity in vitro. Nutr Neurosci. 20(2):89–102. doi:10.1179/1476830514y.0000000147.
- Das UN. 2018. Arachidonic acid in health and disease with focus on hypertension and diabetes mellitus: a review. J Adv Res. 11:43–55. doi:10.1016/j.jare.2018.01.002.
- Dewanjee S, Das S, Das AK, Bhattacharjee N, Dihingia A, Dua TK, Kalita J, Manna P. 2018. Molecular mechanism of diabetic neuropathy and its pharmacotherapeutic targets. Eur J Pharmacol. 833:472–523. doi:10.1016/j.ejphar.2018.06.034.
- Feldman EL, Nave KA, Jensen TS, Bennett DLH. 2017. New horizons in diabetic neuropathy: mechanisms, bioenergetics, and pain. Neuron. 93(6):1296–1313. doi:10.1016/j.neuron.2017.02.005.
- Fukuda H, Imamura M, Tanaka Y, Iwata M, Hirose H, Kaku K, Maegawa H, Watada H, Tobe K, Kashiwagi A, et al. 2012. A single nucleotide polymorphism within DUSP9 is associated with susceptibility to type 2 diabetes in a Japanese population. PLoS One. 7(9):e46263–e46263. doi:10.1371/journal.pone.0046263.
- Furukawa S, Sakai T, Niiya T, Miyaoka H, Miyake T, Yamamoto S, Maruyama K, Ueda T, Senba H, Todo Y, et al. 2017. Diabetic peripheral neuropathy and prevalence of erectile dysfunction in Japanese patients aged <65 years with type 2 diabetes mellitus: the Dogo study. Int J Impot Res. 29(1):30–34. doi:10.1038/ijir.2016.40.
- Ghosh P, Sahoo R, Vaidya A, Chorev M, Halperin JA. 2015. Role of complement and complement regulatory proteins in the complications of diabetes. Endocr Rev. 36(3):272–288. doi:10.1210/er.2014-1099.
- Goncalves NP, Vaegter CB, Andersen H, Ostergaard L, Calcutt NA, Jensen TS. 2017. Schwann cell interactions with axons and microvessels in diabetic neuropathy. Nat Rev Neurol. 13(3):135–147. doi:10.1038/nrneurol.2016.201.
- Goyal N, Kesharwani D, Datta M. 2018. Lnc-ing non-coding RNAs with metabolism and diabetes: roles of lncRNAs. Cell Mol Life Sci. 75(10):1827–1837. doi:10.1007/s00018-018-2760-9.
- Hernandez A, Martinez ME, Fiering S, Galton VA, St Germain D. 2006. Type 3 deiodinase is critical for the maturation and function of the thyroid axis. J Clin Invest. 116(2):476–484. doi:10.1172/jci26240.
- Hu Y, Yan C, Hsu CH, Chen QR, Niu K, Komatsoulis GA, Meerzaman D. 2014. Omiccircos: a simple-to-use R package for the circular visualization of multidimensional omics data. Cancer Inform. 13:13–20. doi:10.4137/cin.S13495.
- Huang X, Liu G, Guo J, Su Z. 2018. The PI3K/AKT pathway in obesity and type 2 diabetes. Int J Biol Sci. 14(11):1483–1496. doi:10.7150/ijbs.27173.
- Hummel KP, Dickie MM, Coleman DL. 1966. Diabetes, a new mutation in the mouse. Science. 153(3740):1127–1128. doi:10.1126/science.153.3740.1127.
- Iqbal Z, Azmi S, Yadav R, Ferdousi M, Kumar M, Cuthbertson DJ, Lim J, Malik RA, Alam U. 2018. Diabetic peripheral neuropathy: epidemiology, diagnosis, and pharmacotherapy. Clin Ther. 40(6):828–849. doi:10.1016/j.clinthera.2018.04.001.
- Jin HY, Park TS. 2018. Role of inflammatory biomarkers in diabetic peripheral neuropathy. J Diabetes Investig. 9(5):1016–1018. doi:10.1111/jdi.12794.
- Jude EB, Abbott CA, Young MJ, Anderson SG, Douglas JT, Boulton AJ. 1998. The potential role of cell adhesion molecules in the pathogenesis of diabetic neuropathy. Diabetologia. 41(3):330–336. doi:10.1007/s001250050911.
- Langfelder P, Horvath S. 2008. WGCNA: an R package for weighted correlation network analysis. BMC Bioinform. 9:559. doi:10.1186/1471-2105-9-559.
- Leti F, DiStefano JK. 2017. Long noncoding RNAs as diagnostic and therapeutic targets in type 2 diabetes and related complications. Genes (Basel). 8(8):207. doi:10.3390/genes8080207.
- Leung A, Amaram V, Natarajan R. 2019. Linking diabetic vascular complications with LncRNAs. Vascul Pharmacol. 114:139–144. doi:10.1016/j.vph.2018.01.007.
- Leung A, Natarajan R. 2018. Long noncoding RNAs in diabetes and diabetic complications. Antioxid Redox Signal. 29(11):1064–1073. doi:10.1089/ars.2017.7315.
- Marchese FP, Huarte M. 2017. A long noncoding RNA in DNA replication and chromosome dynamics. Cell Cycle (Georgetown, Tex). 16(2):151–152. doi:10.1080/15384101.2016.1241604.
- Moore EE, Ellsworth JL. n.d. Pharmaceutical composition comprising FGF18 and IL-1 antagonist and method of use. https://patents.google.com/patent/US8084426B2/en.
- Pande M, Hur J, Hong Y, Backus C, Hayes JM, Oh SS, Kretzler M, Feldman EL. 2011. Transcriptional profiling of diabetic neuropathy in the BKS db/db mouse: a model of type 2 diabetes. Diabetes. 60(7):1981–1989. doi:10.2337/db10-1541.
- Pop-Busui R, Boulton AJ, Feldman EL, Bril V, Freeman R, Malik RA, Sosenko JM, Ziegler D. 2017. Diabetic neuropathy: a position statement by the American diabetes association. Diabetes Care. 40(1):136–154. doi:10.2337/dc16-2042.
- Richner M, Ferreira N, Dudele A, Jensen TS, Vaegter CB, Goncalves NP. 2018. Functional and structural changes of the blood-nerve-barrier in diabetic neuropathy. Front Neurosci. 12:1038. doi:10.3389/fnins.2018.01038.
- Ritchie ME, Phipson B, Wu D, Hu Y, Law CW, Shi W, Smyth GK. 2015. Limma powers differential expression analyses for RNA-sequencing and microarray studies. Nucleic Acids Res. 43(7):e47. doi:10.1093/nar/gkv007.
- Saeedi P, Petersohn I, Salpea P, Malanda B, Karuranga S, Unwin N, Colagiuri S, Guariguata L, Motala AA, Ogurtsova K, et al. 2019. Temporary removal: global and regional diabetes prevalence estimates for 2019 and projections for 2030 and 2045: results from the international diabetes federation diabetes atlas, 9(th) edition. Diabetes Res Clin Pract. 107843. doi:10.1016/j.diabres.2019.107843.
- Selvarajah D, Kar D, Khunti K, Davies MJ, Scott AR, Walker J, Tesfaye S. 2019. Diabetic peripheral neuropathy: advances in diagnosis and strategies for screening and early intervention. Lancet Diabetes Endocrinol. 7(12):938–948. doi:10.1016/s2213-8587(19)30081-6.
- Sun J, Wang Y, Zhang X, Zhu S, He H. 2020. Prevalence of peripheral neuropathy in patients with diabetes: A systematic review and meta-analysis. Prim Care Diabetes. doi:10.1016/j.pcd.2019.12.005.
- Tautz L, Senis YA, Oury C, Rahmouni S. 2015. Perspective: tyrosine phosphatases as novel targets for antiplatelet therapy. Bioorg Med Chem. 23(12):2786–2797. doi:10.1016/j.bmc.2015.03.075.
- Truett GE, Tempelman RJ, Walker JA, Wilson JK. 1998. Misty (m) affects growth traits. Am J Physiol. 275(1):R29–R32. doi:10.1152/ajpregu.1998.275.1.R29.
- Velez Edwards DR, Naj AC, Monda K, North KE, Neuhouser M, Magvanjav O, Kusimo I, Vitolins MZ, Manson JE, O'Sullivan MJ, et al. 2013. Geneenvironment interactions and obesity traits among postmenopausal African-American and Hispanic women in the Women's Health Initiative SHARe study. Hum Genet. 132(3):323–336. doi:10.1007/s00439-012-1246-3.
- Vinik AI. 2016. Clinical practice. diabetic sensory and motor neuropathy. New Engl J Med. 374(15):1455–1464. doi:10.1056/NEJMcp1503948.
- Voight BF, Scott LJ, Steinthorsdottir V, Morris AP, Dina C, Welch RP, Zeggini E, Huth C, Aulchenko YS, Thorleifsson G. 2010. Twelve type 2 diabetes susceptibility loci identified through large-scale association analysis. Nat Genet. 42(7):579. doi:10.1038/ng.609.
- Wallace C, Smyth DJ, Maisuria-Armer M, Walker NM, Todd JA, Clayton DG. 2010. The imprinted DLK1-MEG3 gene region on chromosome 14q32.2 alters susceptibility to type 1 diabetes. Nat Genet. 42(1):68–71. doi:10.1038/ng.493.
- Wang S, Hou Y, Chen W, Wang J, Xie W, Zhang X, Zeng L. 2018. KIF9–AS1, LINC01272 and DIO3OS lncRNAs as novel biomarkers for inflammatory bowel disease. Mol Med Report. 17(2):2195–2202. doi:10.3892/mmr.2017.8118.
- Wang X, Xu B. 2020. Establishment and validation of animal models of peripheral diabetic neuropathies. Zhongguo Yi Xue Ke Xue Yuan Xue Bao. 42(5):658–666. doi:10.3881/j.issn.1000-503X.12001.
- Wright DE, Johnson MS, Arnett MG, Smittkamp SE, Ryals JM. 2007. Selective changes in nocifensive behavior despite normal cutaneous axon innervation in leptin receptor-null mutant (db/db) mice. J Peripher Nerv Syst. 12(4):250–261. doi:10.1111/j.1529-8027.2007.00144.x.
- Wu L, Chen L, Li L. 2017. Apelin/APJ system: a novel promising therapy target for pathological angiogenesis. Clin Chim Acta. 466:78–84. doi:10.1016/j.cca.2016.12.023.
- Yang RH, Lin J, Hou XH, Cao R, Yu F, Liu HQ, Ji AL, Xu XN, Zhang L, Wang F. 2014. Effect of docosahexaenoic acid on hippocampal neurons in high-glucose condition: involvement of PI3K/AKT/nuclear factor-kappaB-mediated inflammatory pathways. Neuroscience. Aug. 274:218–228. doi:10.1016/j.neuroscience.2014.05.042.
- Zhao Y, Liu W, Zeng J, Liu S, Tan X, Aljohi H, Hu S. 2016. Identification and analysis of mouse non-coding RNA using transcriptome data. Sci China Life Sci. 59(6):589–603. doi:10.1007/s11427-015-4929-x.
- Zilliox LA, Russell JW. 2019. Physical activity and dietary interventions in diabetic neuropathy: a systematic review. Clin Auton Res. 29(4):443–455. doi:10.1007/s10286-019-00607-x.