
 ?Mathematical formulae have been encoded as MathML and are displayed in this HTML version using MathJax in order to improve their display. Uncheck the box to turn MathJax off. This feature requires Javascript. Click on a formula to zoom.
Abstract
Organic agriculture (OA) claims to have the potential to address future ecological challenges in food production. However, there is a need to scale up OA in order to meet increasing consumer demand for organic foods. Against this background, this study examined the factors driving farmers to adopt organic vegetable production (OVP) and how much acreage they commit to it. We used structured questionnaires to gather data from 400 farmers in the northern regions of Ghana. To analyze the data, we used Heckman selection model in comparison to Cragg’s double hurdle regression and standard Tobit regression models. The results show that sex, age, education, extension visits, farmer association membership, the timing of production, and access to marketing information are the key factors influencing farmers to adopt OVP. The farmer's age, land ownership, economic status, and farmer association membership are the key factors influencing how much acreage farmers commit to OVP. In order to expand OVP adoption and the organic share of total cropland, strategies are needed to support farmer associations and encourage farmer participation.
Introduction
With the advent of conventional intensive agriculture (CIA), agricultural productivity increased dramatically due to the massive use of chemicals, but at the expense of human and environmental health (Pingali Citation2012; FAO Citation2017; Muller et al. Citation2017; Bhagat and Magda Citation2021; Paudel and Crago Citation2021; Raimondo et al. Citation2021; Xu et al. Citation2021). Ntow (Citation2008) discovered traces of certain chemical residues in the breast milk of female vegetable farmers and vegetable products in Ghana as a result of incorrect pesticide application to achieve high yields. Between 2010 and 2011, pesticide-induced food poisoning killed fifteen people in the Upper East Region and seventeen persons in the North East Region of Ghana (NPAS Citation2012). Cognizant of this, many people are hindered from consuming conventionally produced vegetables since they jeopardize their health (Amfo et al. Citation2019).
Organic agriculture (OA) is thus important not only to achieve food safety in agriculture but also to avoid future environmental damage, since it relies on biological processes and inputs rather than costly synthetic inputs. Organic foods are becoming more popular and attracting higher premiums from consumers, providing a great opportunity to increase farmers’ income and food security (Mishra et al. Citation2018; Yu et al. Citation2018). Regardless, organic production is insufficient to fulfill increasing consumer demand (Willer et al. Citation2021). Yields from OA are lower than those from conventional, intensive agriculture, implying that the organic land area should be increased to compensate for yield shortfalls (Seufert et al. Citation2012). Consequently, there has been extensive research to identify the factors that improve farmers’ adoption of OA and the organic share of the total cropland (Hattam and Holloway Citation2005; López and Requena Citation2005; Koesling et al. Citation2008; Kallas et al. Citation2010; Khaledi et al. Citation2010; Läpple Citation2010; Radwan et al. Citation2011; Thapa and Rattanasuteerakul Citation2011; Adesope et al. Citation2012; Rana et al. Citation2012; Läpple and Kelley Citation2013; Soltani et al. Citation2014; Mrinila et al. Citation2015; Shaban Citation2015; Sodjinou et al. Citation2015; Kerdsriserm et al. Citation2016; Ma et al. Citation2017; Pradhan et al. Citation2017; Haris et al. Citation2018; Azam and Shaheen Citation2019; Digal and Placencia Citation2019; Liu et al. Citation2019; Cakirli and Theuvsen Citation2020; Avane et al. Citation2021; Bui and Nguyen Citation2021; Hoang Citation2021; Hou et al. Citation2022).
Policymakers and development agencies have also recently devised plans to increase the organic share (1.5%) of global cultivatable land (Willer et al. Citation2021). European Commission, for example, has produced an Action Plan to boost organic production in Europe from 8.5% to 25% by 2030 (European Commission Citation2021). The Action Plan is consistent with the European Green Deal, Farm to Fork, and Biodiversity Strategies to make Europe’s climate neutral by 2050 (European Commission Citation2021). The African Union Commission (AUC) also has the goal of promoting and scaling up ecological and organic agriculture (EOA) to achieve continental and national development by 2063 (African Union Citation2018). The AUC thinks that EOA would help Africa achieve several Sustainable Development Goals (SDGs), including gender equality, food security, poverty reduction, and climate change mitigation (African Union Citation2018). In Ghana, the Ministry of Food and Agriculture (MoFA) has engaged stakeholders on ways to improve the productivity, profitability, and sustainability of organic farming in the country (http://mofa.gov.gh/site/media-centre/latest-news/item/590-agric-sector-stakeholders-advocate-for-organic-farming). Currently, only 0.2% of overall agricultural production is organic, managed by 3,147 Ghanaian farmers (Willer et al. Citation2021). However, little attention has been given to examining the drivers of OA adoption in Ghana (see, Djokoto et al. Citation2016; Opoku et al. Citation2020; Avane et al. Citation2021).
This study contributes to the country’s agenda to expand OA, as well as the empirical literature on OA adoption by analyzing the factors that influence the likelihood and extent of organic vegetable production (OVP) adoption. Relatedly, in Ghana, Opoku et al. (Citation2020) assessed farmers’ willingness-to-adopt organic production and how much land they would be willing to allocate to it. However, there is a distinction between what farmers claim they would do in a hypothetical case and what they do. Hence, this study examines farmers’ existing production decisions regarding OVP and the actual land area under OVP. The remainder of this study is described below, including the materials and methods, the results, discussion, and conclusion.
Materials and methods
Study area, sampling procedure, and data collection
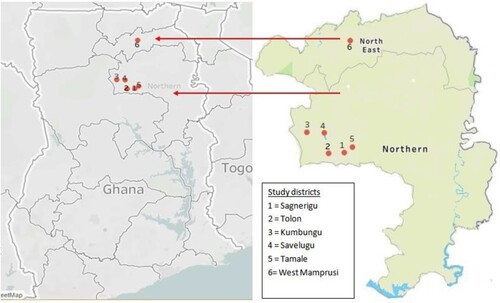
The study area comprises the Northern and North East Regions of Ghana (see Figure ). We chose these areas because they produce a lot of vegetables such as tomatoes, cucumbers, sweet and hot peppers, green beans, carrots, cabbages, spring onions, amaranthus, roselle (‘bra’), white jute (‘ayoyo’), and okra (Boateng et al. Citation2018).
Figure 1. Map of the study area. Source: Author's construct.
The sample size, according to Yamane's (Yamane Citation1967) formula, is approximately 393 (Equation [1]). However, we conducted eight additional interviews to increase the sample size to 400 vegetable farmers. The data comprised 50% organic producers and 50% conventional. We selected the same numbers for comparison sake. We used the multi-stage sampling approach to select respondents for the study. In the first stage, the study purposively sampled four leading vegetable-producing districts, including Tamale, Tolon, Kumbungu, and West Mamprusi. Also, we used a probability proportion by size (PPS) random sampling in the second stage to select twenty communities; six from Tamale, seven from West Mamprusi, four from Tolon, and three from Kumbungu. In the third stage, we used a stratified sampling approach to select ten organic vegetable farmers and ten conventional vegetable farmers from each of the twenty communities. Organic farmers are those who own organic vegetable farms. Such farmers rely solely on organic inputs and bio-chemicals to grow vegetables, and they have an established market for their ‘safe vegetables’. We used secondary data from Ghana's Ministry of Food and Agriculture (MoFA) to sample communities and farmers doing organic vegetable production. According to secondary data, 514 organic farmers engaged in organic vegetable production in 2014 in the study area (MoFA Regional Report Citation2015). We used a pretested semi-structured questionnaire to obtain primary data for the study. Yamane's formula for computing the sample size is as follows:
(1)
(1) where N is the total number of vegetable farmers (23,512) obtained from the GLSS 6th Report, e is the margin of error (taken as 5%), and n is the sample size. Equation 1 gives rise to 393.31 vegetable farmers.
Ethical consideration and permission
At the time the research was undertaken, the institution (University for Development Studies) did not have an Institutional Review Board in place to provide formal ethical approval. As per the practice at the time, the survey instrument (questionnaire) for data collection was approved by the supervisors of the research project. In the survey instrument, a consent form involving the purpose of the study was presented, requesting the respondent's permission to participate in the research. We assured the respondents of the confidentiality of their information and the purpose of the data collection.
Data analysis
Econometric analysis
For our study, the adoption of OVP is a nonrandom variable that leads to a corner solution outcome (i.e. the organic share of the total cropland). In other words, the proportion of the total cropland under OVP contains missing observations for some part of the dataset. Positive values are observed only for those who adopt OVP. Ordinary least squares (OLS) can lead to several econometric problems when applied to estimate the unknown parameters of a regression model for such economic data (Humphreys Citation2013). However, Type I Tobit, Heckman selection, or Cragg's double hurdle regression models can produce efficient estimates for limited dependent variables. The standard (Type) I Tobit model proposed by Tobin (Citation1958) is used to analyze a censored dependent variable (Amemiya Citation1984). However, censored data ignore some parts of the sample, which may not completely reflect the actual features of the organic share of the total cropland and probably lead to erroneous estimation results (Xu et al. Citation2017). The standard Tobit model assumes that the same variables determine the likelihood and extent of adoption (Burke Citation2009).
Theoretically, double hurdle models are appropriate for dependent variables that contain true zeros. In our case, the farmer decides to allocate no land to OVP. Double hurdle models assume that individuals must pass two hurdles before being observed with a positive organic share of the total cropland. However, farmers make both decisions simultaneously. According to Lin and Schmidt (Citation1984), Cragg's model allows one set of parameters to determine the probability of a limit observation and a second set of parameters to determine the density of the non-limit observations. Cragg's double hurdle regression proposed by Cragg (Citation1971) also overcomes the restrictive assumption of the Type I Tobit model. Cragg's model employs the probit model to analyze the probability of OVP adoption and the truncated normal model for positive values of the organic share of the total cropland.
Heckman's selection model developed by Heckman (Citation1979) was initially applied to explain the effect of labor participation on women's wages. Unlike Cragg’s double hurdle model, the Heckman selection model assumes that part of the outcome variable is unobserved due to non-adoption or self-selection (Heckman Citation1979). The selectivity bias problem arises from farmers’ deliberate choices (self-selection) or nonrandom circumstances in research. Thus, farmers who failed to adopt OVP because of their risk preference, inherent managerial skills, ability, and resource endowment had missing outcomes
or unobserved zeros. Instead, we observed Y only if
. Hence,
and
are jointly estimated. The selection equation is analyzed using a probit model, while the outcome equable is estimated using OLS. In the first stage, the dependent variable indicates whether a farmer grows organic vegetables or not. In the second stage, the dependent variable (the organic share of the total cropland) indicates the proportion of farmers’ total cropland OVP. The selection and outcome equations have separate independent covariates. Considering our dataset, a farmer has a positive share of OVP in the total cropland once he adopts OVP, with different factors determining each choice. Heckman selection model is a two-stage model. First, the OLS equation (Equation 2), which is used to explain the organic share of the total cropland:
(2)
(2) Second, the selection or probit equation (Equation 3), which is used to explain the probability of OVP adoption:
(3)
(3) where
is the underlying latent variable denoting farmers’ adoption of OVP;
is the vector of variables explaining OVP adoption;
is the continuous variable explaining the organic share of the total cropland;
is the vector of factors explaining the organic share of the total cropland,
and
are vectors of unknown parameters to be estimated,
and
are the error terms. Heckman selection model assumes that
and
are jointly distributed as bivariate normal, with 0 means and correlation ρ. Because of the joint distribution of the error terms, the expectation of
conditional on
> 0 is expressed in Equation [4] such that the inverse Mill's ratio (IMR), which is calculated from the probit regression model, enters the second-stage OLS model to control selectivity bias:
(4)
(4) where
and
, σ is the standard deviation of
, ϕ(.) is the standard normal density function, and Φ(.) is the standard normal distribution function.
(inverse Mill’s ratio) is a nonlinear function of the set of regressors for
.
The empirical model for analyzing the determinants of OVP adoption is given as:
(5)
(5) while the empirical model for analyzing the organic share of total cropland is given by:
(6)
(6)
The description of the explanatory variables used in the regression models is given in Table .
Table 1. Description of the explanatory variables in regression models.
Results
Descriptive characteristics
Table shows the summary statistics of dummy variables (sex, farmer’s location, off-farm work, land ownership, time of production, household economic status, membership in association, access to credit, and marketing information) used in this study. According to the results, the majority of the vegetable farmers were men and rural folks. This result implies that vegetable production is a male-dominated activity in the rural parts of Ghana's northern region. This study is congruent with Chagomoka et al. (Citation2015), who revealed that vegetable production is higher in rural areas than in urban areas. This phenomenon may be because farmers in rural areas have easy access to land, cheap labor, and organic materials for vegetable production than those in urban areas (Bugri et al. Citation2017). As revealed by Amfo and Ali (Citation2021), Opoku et al. (Citation2020), and Tsiboe et al. (Citation2019), men engage in vegetable production because they have the resources to do so. Women engage in vegetable marketing (Boateng et al. Citation2016). Also, in contrast, Bugri et al. (Citation2017) found that vegetable production is a female-dominated activity in the northern region of Ghana. According to Bugri et al. (Citation2017), women produce vegetables to supplement household food supply and income.
Table 2. Chi-square () test results of the dummy variables by adoption.
We also assessed the economic status of the farmer's household and found that the majority (52.8%) of the vegetable farmers were within the lower-income group, with 22.0% and 25.2% in the high-income and middle-income household groups, respectively. This finding is because most vegetable farmers in lower-income households reside in rural areas and are smallholders who use limited capital and basic farm implements on their farms (Osei et al. Citation2022).
Approximately 53.5% of the vegetable farmers were engaged in off-farm work. This finding is not consistent with Opoku et al. (Citation2020) who revealed that the majority of the vegetable farmers had no off-farm jobs. However, farmers with off-farm jobs have extra income to supplement production (Diiro Citation2013). Households with more off-farm income may be able to boost their investments in OVP without borrowing (Massresha et al. Citation2021). Seventy-eight percent of vegetable producers had possession of land (either via inheritance or purchase). This finding is consistent with Tsiboe et al. (Citation2019) who revealed that the majority (71%) of vegetable farmers in Ghana are landowners. Farmers who grew vegetables in both wet (rainy) and dry (dry) seasons made up 25.0% and 30.0% of the total sample, respectively.
According to the results, farmer group membership is less than 50% (43.3%). We discovered that just 4.3% of vegetable farmers had access to credit for vegetable production, suggesting that the majority of the farmers in the research region (95.7%) appear to be credit constrained. This finding corroborates Tsiboe et al. (Citation2019) who revealed that less than 20% of vegetable farmers in Ghana had access to credit. Amfo and Ali (Citation2021) also found that less than half of their vegetable farmers belonged to farmer based organizations (F BOs) and had extension contacts.
Approximately 66.5% of vegetable farmers had access to market information for selling their produce. We also learned from the chi-square tests that OVP adoption differs significantly based on farmers’ gender, the time of vegetable production, membership of a farmer group, and access to marketing information.
Table also shows the summary statistics of continuous variables (age, household size, education, and extension visits) used in this study. According to the results, the mean age of farmers in the overall sample was 38.033 years. This finding points to an economically active vegetable farmer group, but not youth. This finding is consistent with Opoku et al. (Citation2020) and Tsiboe et al. (Citation2019) who revealed that the majority of the vegetable farmers in Ghana are within the productive and economically active age bracket but above youth. The farmer's age depicts his strength, experience, and risk-taking behavior. Age directly correlates with the productivity of one's workforce and level of farming knowledge. Compared to older farmers, younger farmers are inexperienced yet risk-takers who are open to new ideas. However, according to Opoku et al. (Citation2020), youth in Ghana regard agriculture as less profitable and are less likely to pursue it.
Table 3. Sample t-test results of the continuous variables by adoption.
The mean education was approximately five years, indicating that farmers have a primary (elementary) school education. This study is congruent with Tsiboe et al. (Citation2019), who revealed that the mean education of vegetable farmers in Ghana, according to the Ghana Living Standard Survey Six (GLSS 6) is four years. Education equips farmers with the knowledge and skills to study and comprehend new agricultural techniques compared to those who are uneducated (Opoku et al. Citation2020). On the contrary, our finding suggests that vegetable farmers require information from several sources to adopt OVP to their low level of education.
The average household size of vegetable farmers was 8.66 people. This finding is consistent with Opoku et al. (Citation2020), who revealed that close to 80% of vegetable farmers in the Bono and Ahafo regions have household sizes ranging from 4 to 9 people. Household members are an important source of labor in rural agriculture. Households with more economically engaged individuals have a better chance of meeting their labor needs for agricultural and non-farm activities.
The average farmer received approximately two extension visits in a season. This finding agrees with Tsiboe et al. (Citation2019), who found that most vegetable farmers did not have access to extension services. The t-test results revealed a significant relationship between OVP adoption and farmers’ education and extension visits.
Distribution of cultivatable land area for vegetable production (vegetable farm size)
Figure shows the distribution of vegetable farm size by OVP adoption (Ι), land ownership status (ΙΙ), and time (season) of vegetable production (ΙΙΙ).
Figure 2. Vegetable farm size by OVP adoption, land ownership status, and timing (season) of vegetable production. Source: Field data, 2015.
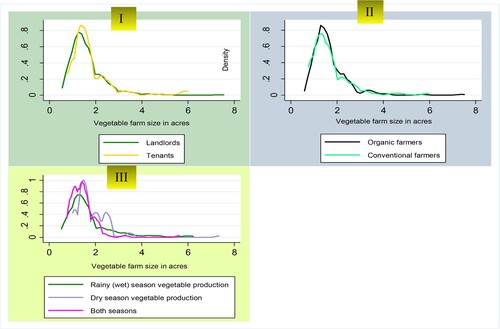
As shown in Figure Ι, the shape of the distribution of vegetable farm size for organic vegetable farmers and conventional vegetable farmers was not symmetric. The normal densities of vegetable farm size by OVP adoption (Figure Ι), landownership (Figure ΙΙ), and timing of vegetable production (Figure ΙΙΙ) for OVP and CVP farmers were very much skewed to the right, implying that the majority of vegetable farmers cultivate smaller plots between 2 and 3 acres. This finding indicates that vegetable production is a small-scale activity in the study area. This finding is in line with that of (Assibey-Yeboah and Koomen Citation2019), who found that the average farm size for vegetables in Ghana is less than 1 ha. Amfo and Ali (Citation2021) also revealed that the average farm size of vegetable producers in Ghana was about half an acre.
The share of the total cropland under OVP
Before delving into the determinants of the organic vegetable share of total farmland, we compared the organic share of the total cropland allocated to OVP by the number of years of adoption (i.e. experience in OVP). According to Table , the majority (177 or 88.5%) of the organic vegetable farmers spent between 2 and 10 years producing organic vegetables. Only 23 organic vegetable farmers (11.5%) spent more than ten (10) years in OVP. Organic farmers had an average of 6.77 years of experience in OVP. The organic percentage of total farmland was 0.36% on average. However, our figure was significantly higher than the national average of 0.2%. This discovery comes as no surprise given the vast land in the research area that farmers might convert into OVP.
Table 4. Current organic share of the total cropland by farmer experience on the OVP.
Determinants of the likelihood of OVP adoption
Here, we discuss the results of the Heckman selection model (Table ) because it fits the data more than the Cragg's double hurdle model and the Tobit regression model. Hence, we discuss the results of only (Table ). We present Cragg's double hurdle regression model and Tobit model results in the appendix (Table A1 and Table A2). The inverse Mill’s ratio was statistically significant, rendering Heckman selection model the appropriate approach to rectify any potential selection bias. The probit regression results reveal that sex, age, age-squared, formal education, farmer group membership, extension visits, marketing information access, wet season vegetable production, and dry season vegetable production significantly influenced OVP adoption.
Table 5. Results of the Heckman selection model.
At the 10% significance level, sex had a significant and positive influence on OVP adoption, meaning that male farmers were more likely to adopt OVP than female farmers. Age had a significant marginal effect that is positively associated with the probability of OVP adoption. At the 5% significance level, an extra year of age increased the likelihood of OVP adoption. However, at a 10% significance level, age-squared reduced OVP adoption, suggesting that farmers may find OVP unattractive after their economic age due to a nonlinear effect. Formal education was significant and positively linked to OVP adoption. At the 5% significance level, an extra year of schooling increased OVP adoption. Extension visits also had a positive effect on OVP adoption at the 1% significance level. An additional visit to the farmers’ vegetable farm increased OVP adoption. At the 1% significance level, farmers who belonged to a farmer association were more likely to adopt OVP than non-members of a farmer association. Access to marketing information had a significant and positive marginal effect on OVP adoption. At the 1% significance level, farmers who had access to marketing information were more likely to adopt OVP than those who did not. Cultivating vegetables in one season (either wet or dry season) increased OVP adoption compared to all-year vegetable production at the 1% significance level.
Factors driving the organic share of the total cropland
The OLS regression results in Table also reveal that age, age-squared, land ownership, lower-and middle-income status, and membership of farmer association significantly influenced the organic share of the total cropland. Age had a significant effect that is positively associated with the organic share of the total cropland. At the 5% significance level, an extra year of age increased the organic share of the total cropland by 0.012%. However, at a 10% significance level, age-squared reduced the organic share of the total cropland by 0.002%, suggesting that age also has a nonlinear effect on the organic share of the total cropland. The share of OVP in the total cropland was positively affected by land ownership at the 10% significance level. Land ownership increased the organic share of the total cropland increased by 0.051%. At the 1% and 5% significance levels, the organic share of the total cropland was reduced by 0.080% and 0.65% for farmers in lower-income and middle-income households, respectively, compared to those in high-income households. Membership of a farmer association had a positive significant effect on the organic share of the total cropland at the 5% level, suggesting that farmers who belonged to a farmer association had a higher organic share of the total cropland (0.056%) than those who do not belong to a farmer association.
Discussion
According to this study, vegetables are grown on smaller plots, typically less than one hectare in size. Additionally, OVP assumes a small portion of farmers’ total cropland, reflecting the need to identify the determinants of OVP adoption and the organic share of the total cropland. The study found that male farmers had a higher probability of OVP adoption than female farmers. This finding is consistent with previous studies in Ghana (Djokoto et al. Citation2016; Avane et al. Citation2021) but contradicts the overwhelming majority of prior studies outside Ghana (Sriwichailamphan and Sucharidtham Citation2014; Kerdsriserm et al. Citation2016; Hoang Citation2021). Previous research (Sodjinou et al. Citation2015) found that OA increased women's economic independence. However, this study found that women are less likely to adopt OA. In northern Ghana, men have more access to information and production resources, including the capital required to implement OVP, than women (Agula et al. Citation2018). Additionally, men are the primary decision-makers and participants in technological trials, providing them with enough information about new farming techniques.
The study also revealed that older farmers embraced OVP and allocated a larger proportion of their total cropland to OVP than younger farmers. Older farmers have more expertise and have better contacts and access to information, allowing them to learn about new farming practices and technologies than younger farmers (Mgale and Yunxian Citation2020). However, as farmers aged beyond the economic years (age squared), the likelihood of OVP adoption and the organic share of the total cropland decreased. Farmers lose strength outside of economic years, making them less competent to manage or maintain a large farm. The economic age in Ghana is 60 years. Farmers reach the formal retirement age or inactive age when they are 60 years old. Even though they have land to pursue commercial production, the individual may be regarded as incapacitated and less fit to engage in commercial business ventures at old age. Chatzimichael et al. (Citation2014) also found a nonlinear influence of age on the probability of OA adoption, but most prior studies (Adesope et al. Citation2012; Rana et al. Citation2012; Mrinila et al. Citation2015; Liu et al. Citation2019) found a contradictory result. Education was an important factor explaining OVP adoption. Farmers adopt a new production method based on its perceived and actual pros and cons compared with an alternative. Education is crucial in any process that requires intensive knowledge, such as OA. Education also helps one to become creative or innovative in using technologies. With education, farmers can evaluate the limitations, costs, and advantages of OVP and minimize the hurdles of information access (Radwan et al. Citation2011; Ma et al. Citation2017). Education, in our opinion, also helped farmers know the demand gap and market potential of organic foods, thus increasing their adoption. This result is consistent with the findings of most prior studies (Koesling et al. Citation2008; Läpple and Kelley Citation2013; Avane et al. Citation2021) but contradicts that of Sodjinou et al. (Citation2015).
Extension visits positively influenced OVP adoption because they enabled smallholder farmers to acquire information and training on OVP. This finding is consistent with most previous studies (Wollni and Andersson Citation2014; Sodjinou et al. Citation2015; Ma et al. Citation2017). Access to extension services allows farmers to learn about new technologies. Extension agents are more likely to teach farmers about organic practices, thus increasing OVP adoption (Tsiboe et al. Citation2019). Membership of a farmer association was also positive and influential towards OVP adoption and organic share of the total cropland. This finding is consistent with Amfo and Ali (Citation2021), Wollni and Andersson (Citation2014), and López and Requena (Citation2005) but contrary to Saoke (Citation2011). Farmer associations act as social capital, providing members with information, capital (credit), technology, and on-farm training for production (Vu et al. Citation2020). The knowledge obtained by training can alter their perceptions and ultimately stimulate their adoption (Amfo and Ali Citation2021). Several development agencies, NGOs, and financial institutions may support farmer associations with technical advice and inputs to adopt socially, economically, and environmentally viable production systems, including OA (Amfo and Ali Citation2021).
Farmers with marketing information adopted OVP. This finding is consistent with Ma et al. (Citation2017) and Sodjinou et al. (Citation2015) but contrary to Rana et al. (Citation2012). Amfo and Ali (Citation2021) also revealed that information access directly influences farmers to use organic fertilizers. Farmers who have access to marketing information are in the business of OVP because they can plan and make informed decisions about their business, such as how much to produce and which market niche to target than those without access to marketing information (Mgale and Yunxian Citation2020). Farmers with greater access to agricultural information tend to be more knowledgeable about OA, which enhances their likelihood of adoption (Amfo and Ali Citation2021). Access to marketing information also reduces the overall transaction costs of marketing produce (Mmbando et al. Citation2015). Farmers, particularly in Ghana, require information about potential consumers and pricing before OVP, as there are limited data on the country's organic food industry. Marketing information directs farmers to markets where goods are in high demand and at a favorable price. The organic food market in Ghana is still in its infancy. Hence, farmers with access to marketing information will be more likely to adopt and expand the acreage under OVP.
Organic manure and compost keep enough moisture in the soil to support plant development even in the dry season, allowing for all-year-round vegetable production. Organic foods also have constant demand and high market value. Hence, farmers who produce vegetables in both seasons will have a higher likelihood of OVP adoption. However, our results revealed that farmers who engaged in seasonal vegetable production (wet season vegetable production or dry season vegetable production) were more likely to adopt OVP than those who produced throughout the year.
Farmers who possess land allocated a larger share of their acreage to OVP because they have the security and freedom to invest in organic practices. This finding agrees with Amfo and Ali (Citation2021), who revealed that the cultivation of vegetables on individual farmlands increased the adoption of organic fertilizers. Possession of land reduces farmers’ risk aversion, allowing them to invest in organic inputs that will provide greater returns in the long run. Hattam and Holloway (Citation2005) also revealed the same result. Farmers in higher-income households allocated a larger share of their acreage to OVP since the transition from business as usual to large-scale production requires sufficient capital to buy more inputs. This finding agrees with Pradhan et al. (Citation2017) but disagrees with Amfo and Ali (Citation2021) who revealed that income increases inorganic fertilizer adoption rather than organic fertilizer. Lack of finance continues to be a major impediment to the adoption of new technologies. Income is critical to the success of every business. Wealthier farmers have the financial capacity to make costly investments and raise the organic share of the total farmland. According to Kisaka-Lwayo (Citation2008), increased income enabled farmers to rent land, adopt new technology, and purchase production inputs. Organic vegetable producers earn a higher income than inorganic producers because of the premium for organic vegetables on the international and domestic markets (Amfo and Ali Citation2021).
Conclusions and recommendations
The study has policy implications for the growth of Ghana's organic food sector, as it brings to light the factors stimulating OVP adoption and the organic share of the total cropland. The study found that OVP assumes a minute share of farmers’ overall cropland, even though the average organic share of the total cropland is above the national average of 0.2%. The farmer's sex, age, education, extension visits, group participation, the timing of production, and access to marketing information are the key factors influencing farmers to adopt OVP. Similarly, the farmer's age, land ownership, economic status, and group participation are the key factors influencing how much acreage farmers commit to OVP. In order to expand OVP adoption and the organic share of total cropland, strategies are needed to support farmer associations and encourage farmer participation. Farmers can learn about OVP through farmer groups and agricultural extension staff. To avoid the risk of excluding potential farmers, both young and older farmers should be targeted in programs promoting OA because farmers’ age had a nonlinear (varying) effect on OVP adoption and the organic share of the total cropland. Future research should focus on factors that drive the dis-adoption and growth of organically farmed land. Every season brings opportunities and challenges, which influence farmers’ adoption decisions and the amount of acreage dedicated to OVP.
Authors’ contributions
VFB was involved in the conception of the work, data collection, analysis, and interpretation of the results; SAD was involved in the conception of the work, data collection, analysis, and writing of the manuscript, and MTC was also involved in the design of the work, data collection, analysis, and writing of the manuscript. All authors read, revised, and approved the final manuscript before submitting it for publication, making us accountable for the originality of the work.
Acknowledgments
We thank vegetable farmers who agreed to provide information for this study and personnel of Ghana's Ministry of Food and Agriculture who assisted in the data collection. This work was undertaken as part of the PhD project of author VFB between 2015 and 2019.
Disclosure statement
No potential conflict of interest was reported by the author(s).
Data availability
Data supporting the findings of this study are openly available and can be found at https://doi.org/10.6084/m9.figshare.22743437.v1.
Additional information
Funding
References
- Adesope OM, Matthews-Njoku EC, Oguzor NS, Ugwuja VC. 2012. Effect of socio-economic characteristics of farmers on their adoption of organic farming practices. In: Sharma P, Abros V, editors. Crop Prod Technologies. Intech: Rijeka; p. 211–220.
- African Union. 2018. THE SALY 2018 DECLARATION ON ECOLOGICAL AND ORGANIC AGRICULTURE STRATEGIES FOR VIABLE CONTINENTAL AND NATIONAL DEVELOPMENT IN THE CONTEXT OF THE AFRICAN UNION'S AGENDA 2063. Paper read at Declaration of the 4th African Organic Conference, November 5–8, 2018, Saly, Senegal, at Senegal.
- Agula C, Akudugu MA, Dittoh S, Mabe FN. 2018. Promoting sustainable agriculture in Africa through ecosystem-based farm management practices: evidence from Ghana. Agric Food Secur. 7(1):1–11.
- Amemiya T. 1984. Tobit models: a survey. J Econom. 24(1–2):3–61.
- Amfo B, Ali EB. 2021. Beyond adoption: the interaction between organic and inorganic fertilizer application, and vegetable productivity in Ghana. Renewable AgricFood Syst. 36(6):605–621.
- Amfo B, Ansah IGK, Donkoh SA. 2019. The effects of income and food safety perception on vegetable expenditure in the Tamale Metropolis, Ghana. J Agribusiness Dev Emerg Econ. 9(3):276–293. https://doi.org/10.1108/JADEE-07-2018-0088
- Assibey-Yeboah S, Koomen I. 2019. Horticulture business opportunities in Ghana: 2019: Sector report 1: Wageningen University & Research.
- Avane A, Amfo B, Aidoo R, Mensah JO. 2021. Adoption of organic fertilizer for cocoa production in Ghana: perceptions and determinants. Afr J Sci Technol Innov Dev. 14(3):1–12.
- Azam MS, Shaheen M. 2019. Decisional factors driving farmers to adopt organic farming in India: a cross-sectional study. Int J Soc Econ. 46(4):562–580.
- Bhagat PR, Magda R. 2021. Food security in the era of sustainable organic farming: a comparison between the Visegrad Group and India. Visegrad J Bioeconomy Sustain Dev. 10(1):14–18.
- Boateng VF, Amfo B, Abubakari AH, Yeboah OB. 2016. Do marketing margins determine local leafy vegetable marketing in the Tamale Metropolis? Afr J Bus Manage. 10(5):98–108.
- Boateng VF, Donkoh SA, Al-Hassan S. 2018. Output effect of organic vegetable production in the Northern Region Of Ghana. Ghana J Agric Econ Agribusiness. 1:64–94.
- Bugri JT, Yeboah E, Knapman C. 2017. Shifts in the landscape: increased pressure on rural land and livelihoods in Ghana. Briefing. IIED, London. http://pubs.iied.org/17355IIED.
- Bui HTM, Nguyen HTT. 2021. Factors influencing farmers’ decision to convert to organic tea cultivation in the mountainous areas of northern Vietnam. Organic Agric. 11(1):51–61.
- Burke WJ. 2009. Fitting and interpreting Cragg's Tobit alternative using Stata. Stata J. 9(4):584–592.
- Cakirli AN, Theuvsen L. 2020. The impact of behavioral drivers on the adoption of sustainable agricultural practices: the case of organic farming in Turkey. Sustainability. 12(17):6875.
- Chagomoka T, Drescher A, Glaser R, Marschner B, Schlesinger J, Nyandoro G. 2015. Vegetable production, consumption, and its contribution to diets along the urban-rural continuum in Northern Ghana. Afr J Food Agric Nutr Dev. 15(4):10352–10367.
- Chatzimichael K, Genius M, Tzouvelekas V. 2014. Informational cascades and technology adoption: evidence from Greek and German organic growers. Food Policy. 49:186–195.
- Cragg JG. 1971. Some statistical models for limited dependent variables with application to the demand for durable goods. Econometrica: J Econ Soc. 39(5):829–844.
- Digal LN, Placencia SGP. 2019. Factors affecting the adoption of organic rice farming: the case of farmers in M’lang, North Cotabato, Philippines. Organic Agric. 9(2):199–210.
- Diiro GM. 2013. Impact of off-farm income on agricultural technology adoption intensity and productivity evidence from rural maize farmers in Uganda.
- Djokoto JG, Owusu V, Awunyo-Vitor D. 2016. Adoption of organic agriculture: evidence from cocoa farming in Ghana. Cogent Food & Agriculture. 2(1):1242181.
- European Commission. 2021. European Green Deal: Commission presents actions to boost organic production: European Commission, 1–3.
- FAO. 2017. The future of food and agriculture – trends and challenges. Rome: Food and Agriculture Organization.
- Haris M, Bahiah N, Garrod G, Gkartzios M, Proctor A. 2018. The Decision to Adopt Organic Practices in Malaysia; a Mix-method Approach.
- Hattam CE, Holloway GJ. 2005. Adoption of certified organic production: Evidence from Mexico.
- Heckman JJ. 1979. Sample selection bias as a specification error. Econometrica: J Econ Soc. 47(1):153–161.
- Hoang HG. 2021. Determinants of adoption of organic rice production: a case of smallholder farmers in Hai Lang district of Vietnam. Int J Soc Econ. 48(10):1463–1475.
- Hou Y, Luo T, Hao J. 2022. Analysis of determinants affecting organic production: state evidence from the United States. Sustainability. 14(1):503.
- Humphreys BR. 2013. Dealing with zeros in economic data. Univ Alberta, Department Econ. 1:1–27.
- Kallas Z, Serra T, Gil JM. 2010. Farmers’ objectives as determinants of organic farming adoption: the case of catalonian vineyard production. Agric Econ. 41(5):409–423.
- Kerdsriserm C, Suwanmaneepong S, Mankeb P. 2016. Factors affecting adoption of organic rice farming in sustainable agriculture network, Chachoengsao Province, Thailand. Int J Agric Technol. 12:1227–1237.
- Khaledi M, Weseen S, Sawyer E, Ferguson S, Gray R. 2010. Factors influencing partial and complete adoption of organic farming practices in Saskatchewan, Canada. Can J Agric Econ/Revue canadienned'agroeconomie. 58(1):37–56.
- Kisaka-Lwayo M. 2008. A discriminant analysis of factors associated with the adoption of certified organic farming by smallholder farmers in Kwazulu-Natal, South Africa.
- Koesling M, Flaten O, Lien G. 2008. Factors influencing the conversion to organic farming in Norway. Int J Agric Res Gov Ecol. 7(1–2):78–95.
- Läpple D. 2010. Adoption and abandonment of organic farming: an empirical investigation of the Irish drystock sector. J Agric Econ. 61(3):697–714.
- Läpple D, Kelley H. 2013. Understanding the uptake of organic farming: accounting for heterogeneities among Irish farmers. Ecol Econ. 88:11–19.
- Lin T-F, Schmidt P. 1984. A test of the Tobit specification against an alternative suggested by Cragg. Rev Econ Stat. 66(1):174–177.
- Liu X, Pattanaik N, Nelson M, Ibrahim M. 2019. The choice to go organic: evidence from small US farms. Agric Sci. 10(12):1566–1580.
- López CP, Requena JC. 2005. Factors related to the adoption of organic farming in Spanish olive orchards. Spanish J Agric Res. 1:5–16.
- Ma W, Ma C, Su Y, Nie Z. 2017. Organic farming: does acquisition of the farming information influence Chinese apple farmers’ willingness to adopt? China Agric Econ Rev. 9(2):211–224.
- Massresha SE, Lema TZ, Neway MM, Degu WA. 2021. Perception and determinants of agricultural technology adoption in North Shoa Zone, Amhara Regional State, Ethiopia. Cogent Econ Financ. 9(1):1–19.
- Mgale YJ, Yunxian Y. 2020. Marketing efficiency and determinants of marketing channel choice by rice farmers in rural Tanzania: evidence from Mbeya region, Tanzania. Aust J Agric Res Econ. 64(4):1239–1259.
- Mishra AK, Kumar A, Joshi PK, D'Souza A, Tripathi G. 2018. How can organic rice be a boon to smallholders? evidence from contract farming in India. Food Policy. 75:147–157.
- Mmbando FE, Wale EZ, Baiyegunhi LJ. 2015. Determinants of smallholder farmers’ participation in maize and pigeon pea markets in Tanzania. Agrekon. 54(1):96–119.
- MoFA. 2015. Vegetable production statistics in the northern regions of Ghana. Ministry of Food and Agriculture. Regional Agriculture Report. Unpublished.
- Mrinila S, Keshav LM, Bijan M. 2015. Factors impacting adoption of organic farming in Chitwan district of Nepal. Asian J Agric Rural Dev. 5(393-2016-24015):1–12.
- Muller A, Schader C, Scialabba NE-H, Brüggemann J, Isensee A, Erb K-H, Smith P, Klocke P, Leiber F, Stolze M. 2017. Strategies for feeding the world more sustainably with organic agriculture. Nat Commun. 8(1):1–13.
- Northern Presbyterian Services (NPAS). 2012. Ghana pesticide crisis.https://www.christianaid.org.uk/sites/default/files/2017-08/ghanas-pesticide-crisis-april-2012.pdf.
- Ntow WJ. 2008. The use and fate of pesticides in vegetable-based agroecosystems in Ghana. Ph.D. Research at Wageningen University and Research.
- Opoku PD, Bannor RK, Oppong-Kyeremeh H. 2020. Examining the willingness to produce organic vegetables in the Bono and Ahafo regions of Ghana. Int J Soc Econ. 47(5):619–641.
- Osei MK, Ofori PA, Adjebeng-Danquah J, Nketia SO, Frimpong-Anin K, Osei-Bonsu I, Puozaa D. 2022. Harnessing technologies for vegetable cultivation: a panacea for food and nutrition insecurity in Ghana. In Vegetable Crops-Health Benefits and Cultivation.IntechOpen.
- Paudel J, Crago CL. 2021. Environmental externalities from agriculture: evidence from water quality in the United States. Am J Agric Econ. 103(1):185–210.
- Pingali PL. 2012. Green revolution: impacts, limits, and the path ahead. Proc Natl Acad Sci USA. 109(31):12302–12308.
- Pradhan M, Tripura B, Mondal T, Darnnel R, Murasing J. 2017. Factors influencing the adoption of organic farming by the farmers of the North District of Sikkim. Int J Adv Sci Res Dev. 4(2):1–7.
- Radwan A, Gil JM, Diab YA, Abo-Nahoul MA. 2011. Determinants of the adaption of organic agriculture in Egypt using a duration analysis technique.
- Raimondo M, Nazzaro C, Marotta G, Caracciolo F. 2021. Land degradation and climate change: global impact on wheat yields. Land Degrad Dev. 32(1):387–398.
- Rana S, Parvathi P, Waibel H. 2012. Factors affecting the adoption of organic pepper farming in India. Poster presented at Tropentag.
- Saoke LA. 2011. Organic Farming in the Kibera Slum in Nairobi, Kenya, Master’s Thesis, Wageningen University, Wageningen, The Netherlands, 2011.
- Sarker MA, Itohara Y, Hoque M. 2009. Determinants of adoption decisions: the case of organic farming (OF) in Bangladesh. Extension Farming Sys J. 5(2):39–46.
- Seufert V, Ramankutty N, Foley JA. 2012. Comparing the yields of organic and conventional agriculture. Nature. 485(7397):229–232.
- Shaban AA. 2015. Factors influencing farmers’ decision to shift to organic farming: the case of Gaza Strip. J Econ Manage Trade. 5(1):78–87.
- Sodjinou E, Glin LC, Nicolay G, Tovignan S, Hinvi J. 2015. Socioeconomic determinants of organic cotton adoption in Benin, West Africa. Agric Food Econ. 3(1):1–22.
- Soltani S, Azadi H, Mahmoudi H, Witlox F. 2014. Organic agriculture in Iran: farmers’ barriers to and factors influencing adoption. Renewable Agric Food Syst. 29(2):126–134.
- Sriwichailamphan T, Sucharidtham T. 2014. Factors affecting adoption of vegetable growing using organic system: a case study of Royal Project Foundation, Thailand. Int J Econ Manag Sci. 3(179):2.
- Thapa GB, Rattanasuteerakul K. 2011. Adoption and extent of organic vegetable farming in Mahasarakham province, Thailand. Appl Geogr. 31(1):201–209.
- Tobin J. 1958. Estimation of relationships for limited dependent variables. Econometrica: J Economet Soc. 26(1):24–36.
- Tsiboe F, Asravor J, Osei E. 2019. Vegetable production technical efficiency and technology gaps in Ghana. Afr J Agric Res Econ. 14(311-2020-259):255–278.
- Vu HV, Ho H, Le QH. 2020. Impact of farmers’ associations on household income: evidence from tea farms in Vietnam. Economies. 8(4):92.
- Willer H, Jan T, Cluadia M, Bernhrd SE. 2021. The world of Organic Agriculture. Statistics and Emerging Trends 2021.Research Institute of Organic Agriculture FiBL, Frick, and IFOAM-Organics International, Bonn. Germany: FiBL/IFOAM.
- Wollni M, Andersson C. 2014. Spatial patterns of organic agriculture adoption: evidence from Honduras. Ecol Econ. 97:120–128.
- Xu X, Sharma P, Shu S, Lin T-S, Ciais P, Tubiello FN, Smith P, Campbell N, Jain AK. 2021. Global greenhouse gas emissions from animal-based foods are twice those of plant-based foods. Nature Food. 2(9):724–732.
- Xu X, Wong SC, Zhu F, Pei X, Huang H, Liu Y. 2017. A Heckman selection model for the safety analysis of signalized intersections. PLoS One. 12(7):e0181544.
- Yamane T. 1967. Statistics: An introductory analysis.
- Yu X, Guo L, Jiang G, Song Y, Muminov MA. 2018. Advances of organic products over conventional productions with respect to nutritional quality and food security. Acta Ecologica Sinica. 38(1):53–60.
Appendix I
Table A1. Results of Cragg’s double hurdle regression model.
Table A2. Results of the Standard Tobit regression model.