
Abstract
Renal fibrosis is a crucial pathological phenomenon of chronic kidney disease (CKD) that contributes to the progressive loss of renal function. Monocarboxylate transporter 1 (MCT1) plays an important role in clear cell renal cell carcinoma; however, the role of the MCT1 inhibitor alpha-cyano-4-hydroxycinnamic acid (α-CHCA) in renal fibrosis remains unclear. In this study, we evaluated the role of α-CHCA, an MCT1 inhibitor, in treating renal fibrosis associated with CKD. We used α-CHCA in a CKD mouse model of unilateral ureteral obstruction (UUO), and mouse proximal tubular epithelial cells (mPTCs) stimulated by transforming growth factor-β1 (TGF-β1). In vivo, administration of α-CHCA improved tubulointerstitial fibrosis, which was consistent with the reduced expression of collagen I/III, fibronectin (FN1), and α-smooth muscle actin (α-SMA) in the kidneys of UUO mice. Similarly, the overexpression of inflammatory factors in UUO kidneys decreased in response to α-CHCA treatment. In vitro, α-CHCA pretreatment inhibited the induction of collagen I/III, FN1, and α-SMA production in mPTCs treated with TGF-β1. Collectively, these findings indicate that α-CHCA may play a therapeutic role in renal fibrosis associated with CKD by inhibiting collagen deposition and subsequent fibrosis and inflammation.
Highlights
Chronic kidney disease (CKD) mice have increased MCT1 expression.
α-CHCA, a MCT1 inhibitor, alleviates renal fibrosis in CKD mice.
α-CHCA improves the inflammation in CKD mice.
α-CHCA inhibits TGF-β1-induced extracellular matrix secretion of proximal tubular epithelial cells.
Introduction
Increasing incidence of chronic kidney disease (CKD) has become a significant health burden worldwide. CKD results in mineral metabolism disorder and pathological damage, which are the main factors of morbidity and mortality in patients with end-stage renal disease (ESRD) (Egli-Spichtig et al. Citation2019). Moreover, the number of pediatric cases of ESRD has increased globally, along with the number of patients requiring dialysis and renal transplant over the past 30 years (Kaspar et al. Citation2016). However, so far, there has been no effective method to prevent the occurrence and development of CKD. Renal tubulointerstitial fibrosis (RIF) is characterized by myofibroblast aggregation and excessive deposition of extracellular matrix (ECM), and plays an important role in the CKD (Bai et al. Citation2019). It has been proposed that attenuating RIF could delay the progression of CKD to ESRD, highlighting the need to explore promising therapies for ameliorating renal fibrosis and treating CKD. An increasing number of studies have indicated that metabolic alterations play important roles in the pathogenesis of fibrosis. Hewitson et al. showed that injured kidneys release the pro-fibrotic signals that could induce metabolic reprogramming to meet the high bioenergy and biosynthetic requirements of (myo)fibroblasts (Hewitson and Smith Citation2021). In addition, damaged tubular epithelial cells (TECs) tend to exhibit enhanced glycolysis and suppressed fatty acid oxidation (Lovisa et al. Citation2020). However, some studies have proven that suppressing glycolysis could reduce renal fibrosis (Lee et al. Citation2020). Therefore, metabolic targeted therapies may be a promising strategy to improve renal fibrosis.
Monocarboxylate transporters (MCTs) comprise 14 members that mainly catalyze the bidirectional proton-linked transport of short-chain monocarboxylates such as L-lactate, ketone bodies, and pyruvate (Zhang et al. Citation2018b; Allen et al. Citation2020). The role of MCT1, the first member to be identified, has been extensively studied in glycolytic metabolism (Drozdzik et al. Citation2020). The oncogenic role of MCT1 has been identified in multiple cancers. Moreover, MCT1 expression is up-regulated in clear cell renal cell carcinoma (ccRCC) and has a significant correlation with the poor prognosis of ccRCC patients (Guo et al. Citation2019). These observations provide a new direction for the targeted treatment of patients with renal cancer. However, the role of MCT1 in renal fibrosis has not been elucidated.
In view of the importance of MCT1 in glycolysis and lactic acid metabolism, we hypothesized that MCT1 may play a potential role in renal fibrosis. Alpha-cyano-4-hydroxycinnamic acid (α-CHCA) is a typical MCT inhibitor that exhibits a high selectivity for MCT1 (Miranda-Goncalves et al. Citation2013). α-CHCA binds to extracellular MCT1 by non-competitive binding and inhibits its function (Miranda-Goncalves et al. Citation2013). Studies have indicated that α-CHCA treatment significantly reduces glucose consumption and lactic acid production in some cell lines. It has been reported that mice given continuous intraperitoneal injection of α-CHCA for 20 days (25 µmol in 200 µl, approximately 200 mg/kg) showed no significant symptoms, suggesting that MCT1 inhibition does not induce overt toxicity (Sonveaux et al. Citation2008). In the present study, we explored the role of α-CHCA-targeted inhibition of MCT1 in renal fibrosis in an attempt to provide a novel therapeutic option for the treatment of CKD.
Materials and methods
Materials
Reagents and antibodies: DMEM/F12 medium (C11330500CP) and fetal bovine serum (FBS, 10099-141C) were purchased from GIBCO (Waltham, MA, USA). α-CHCA (S8612) was purchased from Selleck (Shanghai, China). The antibodies specific for fibronectin (FN1, ab2413), collagen I (ab34710), and α-smooth muscle actin (α-SMA, ab7817) were purchased from Abcam (Cambridge, MA, USA). Anti-MCT1 (A3013) antibody was obtained from Abclonal (Wuhan, China), while anti-collagen III (bs-0549R) antibody was procured from Bioss (Beijing, China); anti-GAPDH antibody was purchased from Santa Cruz Biotechnology Inc (Santa Cruz, CA, USA).
In vivo studies
A total of 24 male C57BL/6J (eight-week-old) mice were purchased from the Laboratory Animal Center of the Nanjing Medical University and randomly (random number method) divided into three groups: Sham group (control group), unilateral ureteral obstruction (UUO) group and UUO+α-CHCA group. Eight mice were eventually included in sham group and six mice in UUO or UUO + CHCA groups because some died during the modeling process. The appropriate number of in vivo mouse model groups was determined based on our previous experience and in consultation of the study leader. All mice were kept on a 12-hour light–dark cycle in a temperature-controlled (19–21°C) room, fed a standard rodent diet, and allowed to drink freely. The UUO surgery was performed as follows: Mice were anesthetized with 5% isoflurane for 5 min. The left kidney was exposed and the left ureter was ligated at the ureteropelvic junction with 4–0 silk thread. The other steps were identical in the sham group except for ureteral ligation. In UUO+α-CHCA group, α-CHCA was injected into mice intraperitoneally (i.p.) on the day before UUO surgery and injected i.p. each day for the next 7 days. According to literature reports, we selected the concentration of CHCA to be 200 mg/kg (Del Prete et al. Citation2004; Sonveaux et al. Citation2008). Injection of the same volume of saline (0.9%) served as control in UUO group. Researchers were blinded to the treatment group. Seven days after the surgery, mice were euthanized; the kidneys were harvested, and analyzed. All animal studies were approved by the Nanjing Medical University Institutional Animal Care and Use Committee (IACUC-2102005-4).
Kidney histopathological analysis
Renal tissues were fixed with 4% paraformaldehyde, embedded in paraffin, and sectioned transversely. Kidney sections (3 µm) were stained with Masson’s trichrome stain according to standard procedures.
Hematoxylin–eosin (HE) staining
Renal tissues were fixed with 4% paraformaldehyde, embedded in paraffin, and sectioned transversely. Before immunostaining, 3-µm thick kidney tissue sections were dewaxed in xylene, rehydrated with reduced ethanol concentration, and washed with PBS. They were then stained with hematoxylin and eosin (HE). Then the sections were dehydrated with 70%, 85%, 95% and 100% alcohol in turn for 2–3 min at each level and then transferred into xylene for transparency twice, about 10 min in total. Finally, they were sealed with neutral gum.
Immunohistochemistry
Kidney sections (3 µm thick) were deparaffinized and rehydrated using xylene and a graded series of ethanol as per standard method. The sections were boiled twice in modified citrate antigen retrieval solution (Beyotime, P0086) for 1-2 min. Next, sections were incubated in 3% hydrogen peroxide for 20 min and incubated overnight at 4°C with primary antibody against MCT1 (1:400). After washing with phosphate buffer saline (PBS), the sections were incubated with the secondary antibody, and the signals were detected using a DAB detection system (PV9000, ZSGB-BIO, Beijing, China).
Cell culture
Mouse proximal tubular epithelial cells (mPTCs) were cultured in DMEM-F12 medium supplemented with 10% FBS. In certain experiments, the cells were pre-treated with α-CHCA (1.25 mM) for half an hour, then stimulated with transforming growth factor-β1 (TGF-β1, 15 ng/mL) for 24 h.
RNA extraction and quantitative real-time (RT)-qPCR
Total RNA was extracted from tissues or cells using the TRIzol (Invitrogen, Carlsbad, CA) according to the manufacturer’s instructions. One microgram of total RNA from each sample was used. cDNA was reverse transcribed according to the instructions of the Takara kit. RT-qPCR was conducted on an ABI Prism 7500 Sequence Detection System (Foster City, USA) using AceQ qPCR SYBR Green Master Mix (cat: Q131-02, Vazyme Biotechnology) and the total volume was 20µl. Temperature cycling conditions were 95°C for 10 min, followed by 40 cycles of 95°C for 15 s and 60°C for 1 min. The relative mRNA expression level of targeted genes was normalized to the relative expression of GAPDH and calculated using the 2−ΔΔCt method. The sequences of the primers used are listed in Table .
Table 1. Primer’s sequence
Western blot
Equal amounts (20 µg) of protein were loaded onto a 10% SDS-PAGE gel. After electrophoresis, the proteins were transferred to a PVDF membrane by electroblotting and blocked with 5% skim milk in PBS for 1.5 h at room temperature (25°C). Membranes were incubated with primary antibodies overnight at 4°C. The next day, the following primary antibodies were used: anti-collagen I, anti-FN1, anti-α-SMA, and anti-GAPDH. After washing with PBS, the membranes were incubated with HRP-labeled secondary antibodies at room temperature for 75 min. The blots were visualized using the Amersham Biosciences ECL detection system (Amersham, Little Chalfont, UK). Densitometric analysis was performed using Quantity One software (Bio-Rad).
Immunofluorescence staining
mPTCs were cultured on glass-bottom cell culture dishes (NEST, China) and pre-treated with α-CHCA (1.25 mM) for half an hour, then stimulated with transforming growth factor-β1 (TGF-β1, 15 ng/mL) for 24 h. Then, after several washes with PBS, the cells were fixed with 4% paraformaldehyde for 20 min at room temperature, extensively washed with PBS and blocked with 2% BSA for 1 h. The primary antibody FN1 was added to the dish at a 1:100 dilution and incubated in a humid chamber overnight at 4°C; the secondary antibody and DAPI were applied after washing with PBST.
Cell viability
Cell viability was determined using the CCK-8 assay kit (MedChemExpress, China). mPTCs were seeded in a 96-well plate in 100 µL of culture medium and were treated with various concentrations of α-CHCA (0–5 mM). After 24 h incubation, 10 µL of CCK-8 reagent per well was added to the medium and the cells incubated for 1 h. The absorbance was detected at 450 nm using a microplate reader (Yuan et al. Citation2022).
Statistical analysis
All data are presented as the mean ± standard error of mean (SEM). Differences between the two groups were analyzed by performing the two-tailed Student’s t-test and analyzed using GraphPad Prism 6 software (GraphPad). Analysis of variance was performed for comparisons among multiple groups. Results with P < 0.05 were considered statistically significant.
Results
The expression of MCT1 is increased in UUO mice
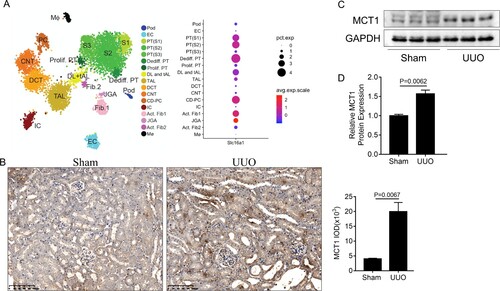
Using Kidney Interactive Transcriptomics (http://humphreyslab.com/SingleCell/), an online analyzer for kidney single cell datasets, we found that MCT1 was expressed in multiple cell populations of the kidneys of UUO mice, and its expression was more pronounced in the proximal tubule cells (Figure A). Moreover, immunohistochemical staining showed MCT1 overexpression in obstructed kidneys of the UUO mice, mainly in the proximal tubules (Figure B). Western blot analysis also confirmed the increased MCT1 expression in UUO model (Figure C,D).
Figure 1. The expression of MCT1. (A) MCT1 expression in multiple cell populations in the kidneys of Mouse UUO d14 dataset by using an online analyzer for kidney single cell datasets Kidney Interactive Transcriptomics. (B) Representative immunohistochemical staining images of MCT1 in obstructed kidneys (n = 3). (C-D) Western blot and of semiquantitative analysis of MCT1 in UUO mice (n = 3). The values represent means ± SEM.
α-CHCA treatment reduces extracellular matrix (ECM) deposit and attenuated the damages in obstructed kidneys of UUO mice
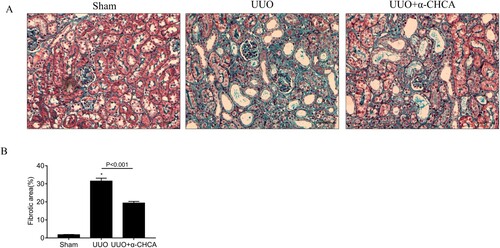
To determine the role of MCT1 in renal fibrosis, mice were intraperitoneally injected with the MCT1 inhibitor α-CHCA. The results of Masson’s trichrome staining showed disordered renal structures and extensive collagen deposition in the renal interstitial area of the UUO mice. However, α-CHCA treatment reduced the deposition of ECM and rescued the pathological damage in obstructed kidneys to a certain extent (Figure ).
Figure 2. α-CHCA ameliorated histologic changes induced by UUO. (A) Deposition of total fibrosis in kidney tissues was determined by Masson's trichrome staining (×200). (B) The relative fibrotic area (%), based on Masson's trichrome staining. Scale bar, 50 µm. The values represent means ± SEM (n = 6-8). For the UUO group vs. the sham group, *indicates P < 0.05.
α-CHCA treatment alleviated renal tubulointerstitial fibrosis (RIF) in UUO mice
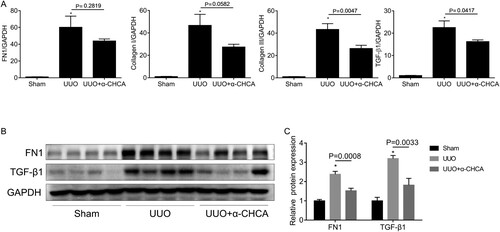
Consistent with Mason’s trichrome staining, RT-qPCR analysis revealed that the mRNA levels of FN1, collagen I, collagen III, and TGF-β1 were down-regulated after α-CHCA treatment (Figure A). Furthermore, western blot analysis showed that α-CHCA administration inhibited the protein expression of FN1 and TGF-β1 (Figure B, C). Taken together, these results provided convincing evidence that α-CHCA ameliorates renal fibrosis induced by UUO.
Figure 3. α-CHCA reduced renal interstitial fibrosis in UUO animals. (A) qPCR analysis of FN1, collagen I, collagen III and TGF-β1 (n = 6-8). (B) Western blot of FN1 and TGF-β1 (n = 4 per group). (C) Semiquantitative analysis of average optical density of FN1 and TGF-β1 (n = 4 per group). The values represent means ± SEM. For the UUO group vs the sham group, *indicates P < 0.05.
α-CHCA repressed renal inflammation induced by UUO
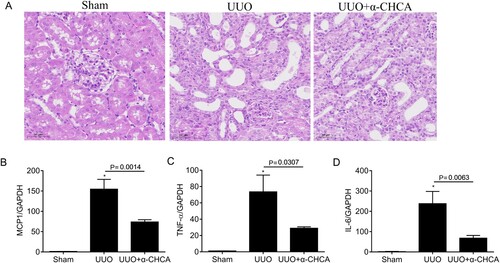
Renal inflammation is a characteristic phenomenon of CKD. Therefore, we evaluated the inflammatory state of obstructed kidneys in UUO mice treated with or without α-CHCA. We performed HE staining and found α-CHCA inhibited the inflammatory cell infiltration of the kidney tissues (Figure A). We also found that the mRNA expression of MCP1, TNF-a, and IL-6 decreased significantly after α-CHCA treatment (Figure B–D), suggesting that α-CHCA could improve renal inflammation in UUO mice.
Figure 4. α-CHCA ameliorated renal inflammation in UUO animals. (A) HE staining of the kidney tissues. (B-D) qPCR analysis of MCP-1, TNF-α and IL-6 (n = 6-8). The values represent means ± SEM. For the UUO group vs the sham group, *indicates P < 0.05.
α-CHCA prevented the pro-fibrotic response in TGF-β1-stimulated mPTCs
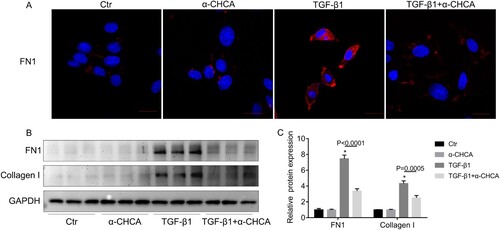
As α-CHCA profoundly inhibited renal fibrosis in the UUO model, we evaluated the direct inhibitory effect of α-CHCA on the fibrotic response of mPTCs. In order to determine whether α-CHCA alone had certain effects on mPTCs, α-CHCA was added to the mPTCs for 24 h. CCK8 assay was used to monitor the cell viability after treatment with different concentrations of α-CHCA; based on the results and previously reported(Miranda-Goncalves et al. Citation2013), 1.25 mM were found to be appropriate concentrations for the subsequent experiments (Figure A). The mRNA expression of FN1, collagen I, collagen III and α-SMA decreased significantly after α-CHCA treatment (Figure B–E). Immunofluorescence staining and western analysis showed the protein levels of FN1 and collagen I also inhibited by α-CHCA treatment (Figure A–C). Collectively, these data indicate that during renal fibrosis, α-CHCA suppresses the tubular cells switching to the secretory phenotype and inhibits ECM production.
Figure 5. α-CHCA suppressed TGF-β1-induced fibrotic response in mPTCs at the mRNA level. (A) CCK8 assay of the cell viability after treatment with different concentrations of α-CHCA. (B-E) qPCR analysis of FN1, collagen I, collagen III and α-SMA (n = 6 per group). mPTCs were pre-treated α-CHCA (1.25 mM) for half an hour, then treated with TGF-β1 (15 ng/ml) for 24 h. The values represent means ± SEM. For the TGF-β1 group vs the control group, *indicates P < 0.05.
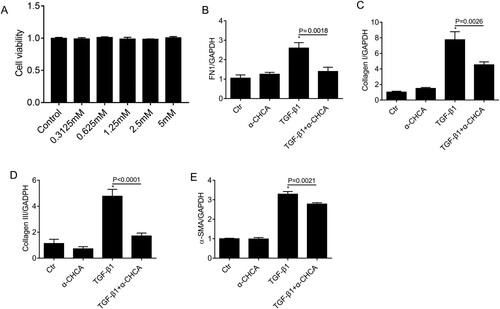
Figure 6. α-CHCA suppressed TGF-β1-induced fibrotic response in mPTCs at the protein level. (A) Immunofluorescence staining of FN1. (B) Western blots of FN and collagen I. (C) Semiquantitative analysis of average optical density of FN1 and collagen I (n = 3 per group). mPTCs were pre-treated α-CHCA (1.25 mM) for half an hour, then treated with TGF-β1 (15 ng/ml) for 24 h. The values represent means ± SEM. For the TGF-β1 group vs the control group, *indicates P < 0.05.
Discussion
Lactic acid is mainly transported by two H (+)/ lactate transporters, MCT1/MCT4 (Le Floch et al. Citation2011). The MCT family, particularly MCT1 and MCT4, are involved in lactate-pyruvate exchange and metabolism (Wang et al. Citation2020). MCT1 enables energy metabolites such as lactic acid and pyruvate to shuttle between cells, thus playing a critical role in glycolytic metabolism. α-CHCA is a known reversible inhibitor of MCT1, with an approximately 10-fold higher selectivity compared to other MCTs (Manning Fox et al. Citation2000). In the present study, we firstly proved α-CHCA had the effect of anti-fibrosis in animal models. Since single cell sequencing and our immunohistochemical results showed that the increased of MCT1 mainly located in proximal tubular cells, we hypothesized that α-CHCA plays the role of anti-fibrosis in UUO mainly through renal tubular epithelial cells, so we validated the function of α-CHCA in cultured mPTCs. To the best of our knowledge, this is the first study to investigate the role of targeted inhibition of MCT1 through α-CHCA in renal fibrosis. Our results showed that α-CHCA-targeted inhibition of MCT1 improved renal fibrosis in vivo and in vitro.
Previously, it was shown that A549 cells stimulated with TGF-β1 could induce pulmonary fibrosis, leading to the enhanced expression of MCTI at mRNA and protein levels (Uddin et al. Citation2020). This observation is consistent with the increased expression of MCT1 observed in UUO mice in our study. These results indicate that the change in MCT1 expression plays an important role in fibrosis. Here, we used TGF-β1 to induce mPTCs to establish an in vitro model of renal fibrosis (Ai et al. Citation2020), and constructed a mouse model of UUO to simulate renal fibrosis in vivo. We observed that α-CHCA significantly inhibited the accumulation of collagen I, collagen III, and FN1 in the UUO model as well as the TGF-β1-treated renal cells. In addition, we also observed that the mRNA level of TGF-β1 was significantly down-regulated after α-CHCA treatment. TGF-β1 is an important mediator of renal fibrosis and CKD (Zhang et al. Citation2020). We proposed that the targeted inhibition of MCT1 may mitigate the production and deposition of ECM via regulating TGF-β1. Fibrosis and inflammation constitute a deleterious loop, and both contribute to the development of CKD. In our study, α-CHCA treatment reduced the mRNA levels of pro-inflammatory cytokines such as MCP-1, IL-6, and TNF-α in obstructed kidneys. TNF-α was initially described as a circulating factor that induces hemorrhagic necrosis in tumors. It is now clear that TNF-α plays different functions in cancer biology. In addition to causing cancer cell death, TNF-α can also activate cancer cell survival and proliferation pathways, trigger inflammatory cell infiltration, and stimulate angiogenesis and tumor cell migration and invasion (Waters et al. Citation2013; Baradaran Ghavami et al. Citation2017; Cruceriu et al. Citation2020). The decreased expression of TNF-α after α-CHCA treatment may be explained by the subsequent response to the alleviated renal fibrosis. However, the off-target effect of α-CHCA cannot be excluded. Thus, our study demonstrated the anti-fibrotic effects of the targeted inhibition of MCT1 with α-CHCA, suggesting that the inhibition of MCT function can affect the development of renal fibrosis via impaired glycolytic metabolism.
Metabolic reprogramming affects the severity of organ dysfunction and progression of fibrosis after kidney injury (Ding et al. Citation2017; Tan et al. Citation2021) and inhibition of glycolysis may alleviate renal fibrosis (Zhou et al. Citation2019). Fatty acid oxidation is the primary energy pathway employed by the kidney, especially by the proximal tubular epithelial cells. Employing RNA sequencing of kidneys from 38 patients diagnosed with various forms of CKD, Lemos et al. identified a metabolic gene signature of fibrotic kidneys, including decreased mitochondrial and oxidative phosphorylation gene expression, as well as the increased expression of glycolytic enzymes and regulators (Lemos et al. Citation2018). Under many pathological conditions, regardless of the presence of oxygen, pyruvate is metabolized to lactate in the cytoplasm, rather than entering mitochondria for oxidative metabolism (Rowe et al. Citation2013; Zhang et al. Citation2018a). Baumann et al. showed that lactic acid up-regulates the expression of TGF-β2 (Baumann et al. Citation2009). The TGF-β family can promote the production of IL-6 in human fibroblasts (Dufour et al. Citation2018) and can also promote the expression of ECM such as collagen and FN1, and inhibit the degradation of ECM. Therefore, targeting renal cell metabolism may be a potential therapeutic approach to reverse renal fibrosis and delay the progression of CKD in the future.
Conclusion
Renal fibrosis, as a common pathological feature of a wide variety of CKDs, is a pathophysiological change, which leads to kidney injury and loss of kidney function (Perretta-Tejedor et al. Citation2019). At present, there is no effective method to delay the occurrence and development of renal fibrosis. Our data suggest that the targeted blockade of MCT1 by α-CHCA could improve renal fibrosis and reduce inflammatory response. Therefore, α-CHCA is a potential agent to prevent and treat CKD. However, further studies are necessary to elucidate the potential upstream or downstream mechanisms involved in CKD-related renal fibrosis.
Acknowledgements
Weisong Jin conceived and designed the research; Meng Pan and Hua Wang performed experiments; Weixian Chen interpreted results of experiments; Meng Pan drafted of the paper and revised it critically for intellectual content; Weisong Jin approved the final version to be published. All authors agree to be accountable for all aspects of the work.
Disclosure statement
No potential conflict of interest was reported by the author(s).
Data availability statement
All necessary experimental raw data were uploaded to Zenodo Database via link below https://doi.org/10.5281/zenodo.7851522.
Additional information
Funding
References
- Ai K, Zhu X, Kang Y, Li H, Zhang L. 2020. Mir-130a-3p inhibition protects against renal fibrosis in vitro via the tgf-beta1/smad pathway by targeting snon. Exper Mol Pathol. 112:104358. doi:10.1016/j.yexmp.2019.104358.
- Allen AE, Martin EA, Greenwood K, Grant C, Vince P, Lucas RJ, Redfern WS. 2020. Effects of a monocarboxylate transport 1 inhibitor, azd3965, on retinal and visual function in the rat. Brit J Pharmacol. 177(20):4734–4749. doi:10.1111/bph.15239.
- Bai M, Lei J, Wang S, Ding D, Yu X, Guo Y, Chen S, Du Y, Li D, Zhang Y, et al. 2019. Bmp1 inhibitor UK 383,367 attenuates renal fibrosis and inflammation in CKD. Amer J Physiol Renal Physiol. 317(6):F1430–F1438. doi:10.1152/ajprenal.00230.2019.
- Baradaran Ghavami S, Chaleshi V, Derakhshani S, Aimzadeh P, Asadzadeh-Aghdaie H, Zali MR. 2017. Association between tnf-alpha rs1799964 and raf1 rs1051208 microrna binding site snp and gastric cancer susceptibility in an Iranian population. Gastroenterol Hepatol Bed Bench. 10(3):214–219.
- Baumann F, Leukel P, Doerfelt A, Beier CP, Dettmer K, Oefner PJ, Kastenberger M, Kreutz M, Nickl-Jockschat T, Bogdahn U, et al. 2009. Lactate promotes glioma migration by tgf-beta2-dependent regulation of matrix metalloproteinase-2. Neurooncology. 11(4):368–380. doi:10.1215/15228517-2008-106.
- Cruceriu D, Baldasici O, Balacescu O, Berindan-Neagoe I. 2020. The dual role of tumor necrosis factor-alpha (tnf-alpha) in breast cancer: Molecular insights and therapeutic approaches. Cell Oncol (Dordr). 43(1):1–18. doi:10.1007/s13402-019-00489-1.
- Del Prete E, Lutz TA, Scharrer E. 2004. Inhibition of glucose oxidation by alpha-cyano-4-hydroxycinnamic acid stimulates feeding in rats. Physiol Behav. 80(4):489–498. doi:10.1016/j.physbeh.2003.10.007.
- Ding H, Jiang L, Xu J, Bai F, Zhou Y, Yuan Q, Luo J, Zen K, Yang J. 2017. Inhibiting aerobic glycolysis suppresses renal interstitial fibroblast activation and renal fibrosis. Amer J Physiol Renal Physiol. 313(3):F561–F575. doi:10.1152/ajprenal.00036.2017.
- Drozdzik M, Szelag-Pieniek S, Grzegolkowska J, Lapczuk-Romanska J, Post M, Domagala P, Mietkiewski J, Oswald S, Kurzawski M. 2020. Monocarboxylate transporter 1 (mct1) in liver pathology. Intern J Mol Sci. 21(5) doi:10.3390/ijms21051606
- Dufour AM, Alvarez M, Russo B, Chizzolini C. 2018. Interleukin-6 and type-i collagen production by systemic sclerosis fibroblasts are differentially regulated by interleukin-17a in the presence of transforming growth factor-beta 1. Front Immunol. 9:1865. doi:10.3389/fimmu.2018.01865.
- Egli-Spichtig D, Imenez Silva PH, Glaudemans B, Gehring N, Bettoni C, Zhang MYH, Pastor-Arroyo EM, Schonenberger D, Rajski M, Hoogewijs D, et al. 2019. Tumor necrosis factor stimulates fibroblast growth factor 23 levels in chronic kidney disease and non-renal inflammation. Kidney Intern. 96(4):890–905. doi:10.1016/j.kint.2019.04.009.
- Guo C, Huang T, Wang QH, Li H, Khanal A, Kang EH, Zhang W, Niu HT, Dong Z, Cao YW. 2019. Monocarboxylate transporter 1 and monocarboxylate transporter 4 in cancer-endothelial co-culturing microenvironments promote proliferation, migration, and invasion of renal cancer cells. Cancer Cell Intern. 19:170. doi:10.1186/s12935-019-0889-8.
- Hewitson TD, Smith ER. 2021. A metabolic reprogramming of glycolysis and glutamine metabolism is a requisite for renal fibrogenesis-why and how? Front Physiol. 12:645857. doi:10.3389/fphys.2021.645857.
- Kaspar CD, Bholah R, Bunchman TE. 2016. A review of pediatric chronic kidney disease. Blood Purif. 41(1-3):211–217. doi:10.1159/000441737.
- Lee M, Harley G, Katerelos M, Gleich K, Sullivan MA, Laskowski A, Coughlan M, Fraser SA, Mount PF, Power DA. 2020. Mutation of regulatory phosphorylation sites in pfkfb2 worsens renal fibrosis. Sci Rep. 10(1):14531. doi:10.1038/s41598-020-71475-z.
- Le Floch R, Chiche J, Marchiq I, Naiken T, Ilc K, Murray CM, Critchlow SE, Roux D, Simon MP, Pouyssegur J. 2011. Cd147 subunit of lactate/h+ symporters mct1 and hypoxia-inducible mct4 is critical for energetics and growth of glycolytic tumors. Proc Nat Acad Sci U.S.A. 108(40):16663–16668. doi:10.1073/pnas.1106123108.
- Lemos DR, McMurdo M, Karaca G, Wilflingseder J, Leaf IA, Gupta N, Miyoshi T, Susa K, Johnson BG, Soliman K, et al. 2018. Interleukin-1beta activates a myc-dependent metabolic switch in kidney stromal cells necessary for progressive tubulointerstitial fibrosis. J Amer Soc Nephrol. 29(6):1690–1705. doi:10.1681/ASN.2017121283.
- Lovisa S, Fletcher-Sananikone E, Sugimoto H, Hensel J, Lahiri S, Hertig A, Taduri G, Lawson E, Dewar R, Revuelta I, et al. 2020. Endothelial-to-mesenchymal transition compromises vascular integrity to induce myc-mediated metabolic reprogramming in kidney fibrosis. Sci Signal. 13(635) doi:10.1126/scisignal.aaz2597
- Manning Fox JE, Meredith D, Halestrap AP. 2000. Characterisation of human monocarboxylate transporter 4 substantiates its role in lactic acid efflux from skeletal muscle. J Physiol. 529(Pt 2):285–293. doi:10.1111/j.1469-7793.2000.00285.x.
- Miranda-Goncalves V, Honavar M, Pinheiro C, Martinho O, Pires MM, Pinheiro C, Cordeiro M, Bebiano G, Costa P, Palmeirim I, et al. 2013. Monocarboxylate transporters (mcts) in gliomas: Expression and exploitation as therapeutic targets. Neuro Oncol. 15(2):172–188. doi:10.1093/neuonc/nos298.
- Perretta-Tejedor N, Munoz-Felix JM, Duwel A, Quiros-Luis Y, Fernandez-Martin JL, Morales AI, Lopez-Hernandez FJ, Lopez-Novoa JM, Martinez-Salgado C. 2019. Cardiotrophin-1 opposes renal fibrosis in mice: Potential prevention of chronic kidney disease. Acta Physiol. 226(2):e13247. doi:10.1111/apha.13247.
- Rowe I, Chiaravalli M, Mannella V, Ulisse V, Quilici G, Pema M, Song XW, Xu H, Mari S, Qian F, et al. 2013. Defective glucose metabolism in polycystic kidney disease identifies a new therapeutic strategy. Nat Med. 19(4):488–493. doi:10.1038/nm.3092.
- Sonveaux P, Vegran F, Schroeder T, Wergin MC, Verrax J, Rabbani ZN, Saedeleer D, Kennedy CJ, Diepart KM, Jordan C, F B, et al. 2008. Targeting lactate-fueled respiration selectively kills hypoxic tumor cells in mice. J Clin Invest. 118(12):3930–3942. doi:10.1172/JCI36843.
- Tan C, Gu J, Li T, Chen H, Liu K, Liu M, Zhang H, Xiao X. 2021. Inhibition of aerobic glycolysis alleviates sepsisinduced acute kidney injury by promoting lactate/sirtuin 3/ampkregulated autophagy. Intern J Mol Med. 47(3) doi:10.3892/ijmm.2021.4852
- Uddin M, Kawami M, Yumoto R, Takano M. 2020. Effect of transforming growth factor-beta1 on functional expression of monocarboxylate transporter 1 in alveolar epithelial a549 cells. Naunyn-Schmiedeberg's Arch Pharmacol. 393(5):889–896. doi:10.1007/s00210-019-01802-3.
- Wang L, Zhu R, Wang J, Yu S, Wang J, Zhang Y. 2020. Nrf2 activation enhances muscular mct1 expression and hypoxic exercise capacity. Med Sci Sports Exerc. 52(8):1719–1728. doi:10.1249/MSS.0000000000002312.
- Waters JP, Pober JS, Bradley JR. 2013. Tumour necrosis factor and cancer. J Pathol. 230(3):241–248. doi:10.1002/path.4188.
- Yuan B, Peng Q, Cheng J, Wang M, Zhong J, Qi J, Gao GF, Shi Y. 2022. Structure of the ebola virus polymerase complex. Nature. 610(7931):394–401. doi:10.1038/s41586-022-05271-2.
- Zhang G, Darshi M, Sharma K. 2018a. The warburg effect in diabetic kidney disease. Sem Nephrol. 38(2):111–120. doi:10.1016/j.semnephrol.2018.01.002.
- Zhang G, Zhang Y, Dong D, Wang F, Ma X, Guan F, Sun L. 2018b. Mct1 regulates aggressive and metabolic phenotypes in bladder cancer. J Cancer. 9(14):2492–2501. doi:10.7150/jca.25257.
- Zhang Y, Dai Y, Raman A, Daniel E, Metcalf J, Reif G, Pierucci-Alves F, Wallace DP. 2020. Overexpression of tgf-beta1 induces renal fibrosis and accelerates the decline in kidney function in polycystic kidney disease. Amer J Physiol Renal Physiol. 319(6):F1135–F1148. doi:10.1152/ajprenal.00366.2020.
- Zhou HL, Zhang R, Anand P, Stomberski CT, Qian Z, Hausladen A, Wang L, Rhee EP, Parikh SM, Karumanchi SA, et al. 2019. Metabolic reprogramming by the s-nitroso-coa reductase system protects against kidney injury. Nature. 565(7737):96–100. doi:10.1038/s41586-018-0749-z.