 ?Mathematical formulae have been encoded as MathML and are displayed in this HTML version using MathJax in order to improve their display. Uncheck the box to turn MathJax off. This feature requires Javascript. Click on a formula to zoom.
Abstract
In this article, we explore the drivers of students’ success in a first-year university statistics course. Using a unique sample from Westminster International University in Tashkent, we discover that student engagement with their studies is reflected in their class attendance and in the use of online resources, which continue to play an important role in their academic performance. Moreover, we discovered that socio-demographic factors such as age, gender, marital status, employment, and language of instruction of prior schooling are significant in explaining student academic outcomes. These factors have important policy implications for both the university and the broader national level.
1 Introduction
Managing student success is an integral part of educational management at all levels. In higher education, effective student success management strategies may enhance a university’s reputation and improve student satisfaction, and thus improve recruitment and retention outcomes. One popular measure of students’ success is their academic performance,Footnote1 because this is closely linked with their satisfaction and perceived success in their studies (Boatright-Horowitz and Arruda Citation2013). Indeed, academic grades in undergraduate studies impact student ability to embark on graduate studies and, in many cases, student competitiveness in employment recruitment processes upon graduation. Many factors that may affect students’ performance in their studies can be classed as exogenous, that is, largely beyond the control of the university. However, some factors are endogenous—linked with the organization of academic processes within the institution. Clearly identifying such factors is a key step in student success management by a university.
A university can alter teaching and learning processes with the aim of improving student engagement and the overall effectiveness of the pedagogical process. It can also adjust its student recruitment and support policies, especially where certain socio-economic or demographic groups need additional support. In other instances, where relevant factors may be beyond the scope of an individual institution, advocacy for broader policy change might be employed.
Mishra (Citation2020) provided evidence that social factors play an important part in students’ academic achievement. Aspects of socio-economic status, race/ethnicity, gender, family values, religious community, and other background-related issues, can influence the successful completion of a university degree. These are important matters for universities to consider because they impact a variety of student success metrics, such as attrition, progress and completion rates, grade distribution, student satisfaction and graduate employability (Tertiary Education Quality and Standard Agency (TEQSA) Citation2020).
In today’s increasingly information-obsessed and data-driven society, statistical literacy has never been more important in discerning the factual basis of reports and deriving meaningful and accurate conclusions about what is presented in data. Whether students undertake a business or economics degree, or choose to study humanities or sciences, the growing significance of statistics in the workplace and in everyday life has highlighted the need for better statistical education in the university curriculum.
The main goal of this article is to investigate student success in a statistics course. The term “student success” is a broad concept and incorporates various metrics, one such being academic performance. In this article, academic performance is measured via the overall student grades achieved in the course. Our analysis investigates what factors (institutional, socio-economic, and/or aptitude) might influence student academic performance in a first-year statistics course at Westminster International University in Tashkent, capital of Uzbekistan. This university is a branch of Westminster University (UK) and was the first educational institution in Uzbekistan to offer Western-style education in English as the language of instruction. This is the first paper of its kind to focus on education in this post-Soviet Central Asian republic, and reveals some important findings as to the relative impact of various learning and teaching strategies as well as the socio-economic characteristics of the students. Some of these findings are associated with the cultural and demographic peculiarities of the region, but may also be relevant to countries with similar demographic traits. At the same time, broader generalizations of some of our findings can be made because they reflect issues that are present in countries around the globe.
2 What Determines Students’ Performance in University Studies?
2.1 Theoretical Foundation
The taxonomy of student learning is closely linked with the theoretical notions of teaching and instruction, creating a constant interaction between learning and teaching. It is hardly surprising, then, to find that among the most direct influences on student performance are the characteristics of teaching styles, classroom activities, and instructor interactions with students. Using a meta-analysis study, Wang, Haertel, and Walberg (Citation1993) developed a conceptual framework for the most significant influences on student learning. Relevant variables were grouped into six categories: Student Aptitudes, Classroom Instruction and Climate, Home and Peers Context, Program Design, School Organization, and State/District Characteristics. The results of the study revealed that direct influences (psychological, instructional, and contextual) had the most impact on learning. As a group, Student Aptitudes were the most influential on learning, while the highest scores for individual variables were attributable to classroom management (teachers’ strategies to maintain active participation by all students), metacognitive processes (planning, testing, revising, and evaluating learning strategies), cognitive processes (level of specific academic knowledge in subject area), home environment/parental support (parental involvement in ensuring homework is completed), and student and teacher social interactions (positive student interactions with teachers and other students). The study highlighted how important to student performance were student and teacher interactions, and the home environment.
An important factor in the learning process is how students approach their studies. Ramsden (Citation2003) believed learning is acquired by using a surface and depth approach. Before progressing into deeper learning, students needed to first learn abstract facts that must be remembered or recalled later. Meyer and Land (Citation2003) called this a “threshold” concept, akin to a portal that opens new levels of understanding. This is similar to the “constructivism” theory of Fry, Ketteridge, and Marshall (Citation2003), where learning was described to be done by bringing new understanding and knowledge to bear on extending or surpassing existing knowledge. Lizzio, Wilson, and Simons (Citation2002) found that perceptions of heavy workload and inappropriate assessment encouraged a superficial learning process, while perceptions of good teaching encouraged students to adopt a deeper approach to learning.
To characterize the student learning experience, more contemporary frameworks on how students learn have identified additional dimensions in the form of alienation and engagement. Thus, Case (Citation2008) argued that how students learn depends on: (a) their reason(s) for participating in higher education; (b) their experience of fitting into the higher education community; (c) how they meet the course and assessment requirements. In this theoretical framework, the traditional surface and depth approaches to learning relate to the third of these dimensions, wherein students attempt to achieve the learning outcomes of a course via its assessment systems. Case (Citation2008) suggested that to address the first two dimensions of her alternative framework, the impact of current social context on students’ lives also had to be considered, enabling students to find meaning in their chosen career paths and to experience a sense of belonging in the community of higher education.
In parallel to the learning processes and strategies adopted by students, research has also identified three teaching functions that promote high-quality student learning. Thus, from a teacher’s perspective, the processing function relates to the way subject content is presented and clarified, the affective function refers to the creation and maintenance of a positive, motivational and emotional climate for learning, while the regulation function involves the way in which teachers guide students’ learning processes (Vermunt and Vermetten Citation2004). Thus, good teaching activities are those that promote a “deep” approach to learning and include explanation of the relationship to the subject matter, giving examples, planning, monitoring students’ progress, and motivating students (Rosenshine and Stevens Citation1986). Consequently, teaching styles and practices should be adapted and structured according to progressive student learning stages, and be “scaffolded” as students advance through their courses and programs (Biggs and Tang Citation2011).
2.2 Empirical Evidence
There is extensive empirical literature on the factors that determine academic performance in university courses. In this literature review, we broadly group them as student aptitude factors, student engagement factors, factors related to organization and the use of learning and teaching strategies, and, finally, socio-economic and demographic factors.
Student aptitude factors, such as students’ entrance exam scores, grade point averages (GPAs), and analytical abilities, have been used extensively as explanatory and control variables and have generally been found to have a positive relationship to performance (Johnson and Kuennen Citation2006; Asarta and Schmidt Citation2017). Johnson and Kuennen (Citation2006) found that GPAs and basic mathematical skills were among the most important indicators of academic performance in an introductory business statistics course. This is confirmed by Asarta and Schmidt (Citation2017), who found that GPA was a powerful determinant of performance in a blended statistics course. Similarly, Lunsford, Poplin, and Pederson (Citation2018) showed that students with basic mathematical skills were more likely to be successful in an introductory statistics course.
Student class attendance as a measure of student engagement is among the most examined determinants of student performance. Again, most studies have found a positive impact on students’ academic results for student engagement through lecture attendance and study time. Akimov, Kobinger, and Malin (Citation2018), Marburger (Citation2001), Chen and Lin (Citation2008a), Cohn and Johnson (Citation2006), Stanca (Citation2006), and Dobkin, Gil, and Marion (Citation2010) all reported that attendance had a positive impact on course grades, while Andrietti and Velasco (Citation2015) showed that lecture attendance and study time significantly improved academic performance in an econometrics course. Similarly, Stinebrickner and Stinebrickner (Citation2008), and Bonesrønning and Opstad (Citation2012), investigated the causal effect of study time (as an alternative measure of student engagement) on grades and showed that effort spent on studying is an important determinant of performance. All these studies confirm the well-established understanding that, in general, the most hardworking and motivated students attend lectures more regularly and achieve higher grades.
Among factors related to organization and the use of learning and teaching strategies, Arias and Walker (Citation2004) and Kokkelenberg, Dillon, and Christy (Citation2008) showed that class size had a negative effect on student grades, while the availability and download of lecture material (e.g., PowerPoint slides) before instruction led to an increase in student performance of 3.84% (Chen and Lin Citation2008b). Research comparing students’ performance between blended and traditional-style courses revealed that prior academic achievement, aptitude, and preparation in the subject area had the greatest influences on student results (Dowling, Godfrey, and Gyles Citation2003; Riffell and Sibley Citation2005; Baepler, Walker, and Driessen Citation2014). Investigating whether flipped statistics and econometrics classes improve learning, Becker and Proud (Citation2018) found that students valued flipped-style tutorials because they develop higher-level cognitive skills by working in groups to solve problems. Using QT clickers (real-time audience-response devices) in combination with a flipped-style class in a first-year statistics module, Reyneke, Fletcher, and Harding (Citation2021) documented improved face-to-face classroom engagement as well as higher examination scores. Similarly, a systematic review and meta-analysis of 11 studies investigating the benefits of flipping the classroom in introductory statistics classes found that, overall, this teaching method increased final exam performance in non-math majors (Farmus, Cribbie, and Rotondi Citation2020). Another strategy that proved successful in statistics courses was the adoption of peer tutoring: Dancer, Morrison, and Tarr (Citation2015) and Leppink et al. (Citation2013) found that Peer-Assisted Study Sessions (PASS) improved conceptual understanding of statistics, especially for international and low-achieving students.
From a teachers’ perspective, Hoyt and McGoldrick (Citation2019) overview of five decades of economics education showed the evolution of economics and statistics pedagogy, from the “chalk and talk” method of the early days to the clickers, simulations, digital ink, blogs, and podcast techniques of recent years. Similarly, Picault (Citation2019) provided a review of effective teaching methods that specifically target millennials and pointed out that, owing to the different skills and mindset of today’s younger generation, economics and statistics instruction needed to be adapted to different students’ needs. Other studies confirmed that long-term retention of course content was enhanced and student achievement improved by experiential-based instruction in the form of lecture-plus,Footnote2 interactive role play, demonstrations, dramatizations, and games (Wentland Citation2004; Salemi and Walstad Citation2010; Hoyt and McGoldrick Citation2012; Akimov and Malin Citation2017), as well as collaborative problem-solving, and peer and group learning (McGoldrick, Battle, and Gallagher Citation2000; Munley, Garvey, and McConnell Citation2010; Algan, Cahuc, and Shleifer Citation2013). Technological disruptions and online teaching enabled the use of digital ink, clickers, students’ own devices, and various apps to provide more classroom interaction and facilitate successful learning (Scott Citation2011; Imazeki Citation2014; Cochran et al. Citation2015). Statistical software packages (SPSS, SAS, R, StatCrunch and GenStat), educational software (Fathom, TinkeraPlots and InspireData), applets (Monty Hall problem, ReesesPieces), multimedia materials, and case-study videos that combine real-world problems with statistical application have helped students understand abstract statistical concepts and enriched their learning experience (Chance et al. Citation2007; Kaplan Citation2011; Harraway Citation2012; Reston Citation2013).
Picault (Citation2019) summarized a range of alternative teaching methods and practices that have been adopted successfully in economics and statistics instruction. Videos and podcasts were shown to increase understanding of economics concepts (Moryl Citation2013; Vazquez and Chiang Citation2014), while the use of social media, such as Facebook, as a discussion platform led to significant improvements in economics final exam scores (Harmon, Alpert, and Histen Citation2014). In recent years, the use of student-crafted outputs in the form of music videos, such as Rockonomix (Holder et al. Citation2015) and Econ Beats (Al-Bahrani et al. Citation2017), video scrapbooking (Al-Bahrani, Dowell, et al. Citation2016), and ECONSelfies (Al-Bahrani, Holder, et al. Citation2016) were well-received by students and can be used as forms of assessment.
Among the key socio-economic and demographic factors that have been shown to influence performance is gender. Research on the effect of gender on performance in statistics courses has produced mixed results (Scheaffer and Stasny Citation2004; Alldredge and Brown Citation2006; Haley, Johnson, and Kuennen Citation2007). Only one study showed females achieving higher scores than males (Johnson and Kuennen Citation2006), but Orlov and Roufagalas (Citation2012) found that female students achieved results about 3% better than males in an economics course. More recently, Van Es and Weaver (Citation2018) reported that although females have lower confidence in their ability and a less positive attitude toward statistics, there was no significant difference between the two genders in the final grades received in an introductory statistics course. Research has also revealed that various cultural aspects influence the outcomes and success of statistics education. Thus, for example, female students from some minority groups may bear additional familial burdens and expectations that, in combination with marital status, prevent them achieving their full potential for success (Clark Citation2006). By contrast, Smith and Naylor (Citation2001) showed that both male and female married students in the United Kingdom performed better than non-married ones, a finding confirmed by Al-Mutairi (Citation2011), while Al-Shammari et al. (Citation2018) found no effect of marital status on academic performance.
Studies on age group in relation to academic performance have revealed that, as might be expected, mature students outperform young undergraduates in their first year (McKenzie and Gow Citation2004) and across their degrees as a whole (Cantwell, Archer, and Bourke Citation2001; Sheard Citation2009). Salamonson and Andrew (Citation2006) in their study on the academic achievement of nursing students in Australia also revealed that older students performed better than their younger counterparts.
Irrespective of gender or age, McKenzie and Schweitzer (Citation2001) showed that academic performance is influenced by the level of enrollment (full- or part-time) in combination with employment status. Among various combinations of full- and part-time study and employment, students with a full-time study load and part-time employment had the lowest GPAs. Similarly, Johnson and Kuennen (Citation2006) found that as the number of employment hours increase, the course grade achieved in a statistics course decreases. Salamonson and Andrew (Citation2006) showed that working more than 16 hr per week had a negative influence on the academic achievement of nursing students in Australia; the study also revealed that students from a non-English-speaking background underperformed in the two courses investigated.
Investigating whether contextual background characteristics have an impact on student performance, Thiele et al. (Citation2016) found that although students from disadvantaged backgrounds underperformed in comparison to those with affluent upbringings, students from low-performing schools were more likely to achieve higher performance at university. Similarly, students who attended state schools had better results than those from private schools (Hoare and Johnston Citation2010). Several studies, such as those of Erwin and Binder (Citation2020) and Sten-Gahmberg (Citation2020), reported that financial incentives may affect students’ performance and course completion rates during their studies.
In relation to background characteristics, Van Es and Weaver (Citation2018) found that students’ ethnicity plays a role in performance, expectations, and how they engage in learning. Although the actual grade received was lower than that expected for all students, the largest difference was observed for Latino and African American students. In terms of engagement, Asian students studied in groups and had less separation between academic and social life, White students worked more independently, although sought help easily from others, while African Americans were intensely independent. Similarly, Asian students outperformed all other groups in both meeting their personal expectations and attaining a significantly higher final grade.
This literature review has focused on the identification of determinants of academic performance in the specific context of statistics and econometrics courses. Our study is designed to enrich the existing evidence on this topic. It provides an original contribution by applying analysis to a unique dataset from Westminster International University in Tashkent. Existing literature on higher education in Uzbekistan and post-Soviet Central Asia is scarce. This study contributes to filling the gap in this knowledge. Moreover, it offers some methodological improvements to such analysis by introducing new learning, teaching, and demographic variables.
3 Data and Methodology
The Fundamentals of Statistics (FoS) module is a core first-year course in three undergraduate programsFootnote3 at Westminster International University in Tashkent (WIUT): BSc in Economics with Finance (BEF), BA in Business Administration (BA), and BSc in Business Information Systems (BIS). It has an annual enrollment of around 700–800 students.
3.1 Course Delivery
FoS is a year-long module delivered over the course of 24 teaching weeks (12 teaching weeks per semester) with two contact hours per week, comprising a one-hour lecture and a one-hour tutorial/seminar. The lectures introduce statistical concepts needed for analyses of economic and business information. The seminars, on the other hand, focus on the application of statistical techniques to “real world” problems in the economic and business spheres. Some of the seminars were conducted in computer labs and made use of Microsoft Excel. The course has used the McClave, Benson, and Sincich (Citation2012) Statistics for Business andEconomics textbook and covered typical topics of fundamental statistics such as data collection, presentation and analysis, probability, distributions, sampling, point and interval estimations, analysis of variance, and simple linear and multiple regressions.
Because of the large number of students enrolled in the module, teaching was split into multiple face-to-face sessions, with both lectures and seminars delivered to groups of about 25–27 students. These groupings remained the same throughout the academic year; students within a group typically belonged to the same degree program (i.e., BA, BIS, or BEF). The module is usually delivered by five or six lecturers (during our survey year, five lecturers were involved) and, for each group, lectures and seminars are delivered by the same instructor. Each instructor typically taught students from several degree programs, to better ensure consistent teaching quality across the programs.
The assessment for the module consists of three parts: two time-constrained exams, one toward the end of each semester, and one home assignment consisting of a problem set that must be submitted during the second semester. The two exams comprise 80% of the total grade (40% each), with the remaining 20% of the grade derived from the take-home problem set. In both exams, students are expected to use appropriate statistical methods in examining the relationships between variables, and to show an understanding of statistical concepts as applied to practical, real-world examples. The take-home problem set is assessed in terms of accuracy, consistency, and timeliness.
There are a variety of resources available to students to help them in their learning process. First, the course materials, including lecture slides, weekly exercises presented during the weekly seminars, and their solutions, are uploaded to the internal online system (Intranet) of the university. These course materials are uploaded on a weekly basis at the end of the week in which they have been presented in class. Second, all of the textbooks used in the course are available to borrow from the university’s library.
The university also has several computer labs with appropriate software wherein the students are introduced to Excel spreadsheets (used in this course) and statistical packages such as EViews, Stata, and SPSS (used in more advanced courses), and to the application of these packages in solving various statistical problems. These computer labs are also made available for students to use outside class time.
3.2 Data and Sample
For this study we have combined data from a variety of sources. For instance, the data on some characteristics of students, such as their age, International English Language Testing System (IELTS) score, mathematics entrance score, and gender, were obtained from the academic registrar’s office of the university.
Data for several other variables of interest were obtained through a short survey, which we distributed among the students at the end of their final exam. These surveyed variables included students’ marital status, whether they live with their parent(s), ethnic background, and the city in which they spent most of their schooling years. We also asked students to state whether they had any form of employment, either full- or part-time.
Finally, data relating to students’ engagement in the course, including their degree program, class attendance, and the scope and timing of their access to online course resources, was obtained from the IT department of the university.
Overall, there were 750 students registered for the course in the 2018–2019 academic year, out of which 606 students answered the voluntary questionnaireFootnote4 distributed at the end of the final exam. Students were advised that the surveyed data would be used for research purposes.
A description of the variables used in this study is presented in .
Table 1 Description of collected variables.
As is evident from the exploratory data analysis shown in , there was large variation in the values for dependent and independent variables, with the exception of the binary ones such as enrollments in certain programs, marital status, and so on.
Table 2 Exploratory data analysis.
Even though the IELTS and math entrance scores were obtained from the registrar’s office of the university, we can see in a substantial number of missing values for these variables. This derives from the fact that more than 100 students registered on the course demonstrated their aptitude in English and quantitative skills by means other than the IELTS and math entrance tests. To maintain consistency, we excluded the data for these students from our analysis.
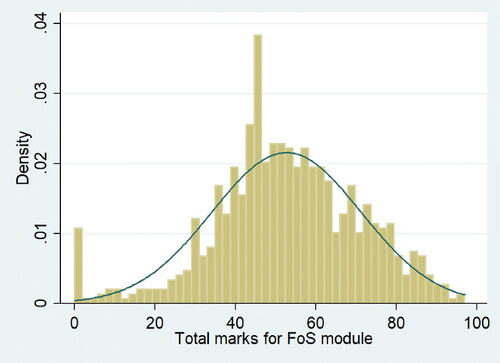
The overall results of the students for the FoS module varied from as little as 3% up to 97% of the maximum possible score, with the average being 53.81% (the pass mark being set at 40%). The distribution of these results is represented in . This high degree of variability is not surprising because some students were completely disengaged from the course, not attending any classes and not using the online resources, whereas others recorded full attendance and downloaded all of the online learning materials. At the time of the survey, the university operated a voluntary attendance policy for students and there were no sanctions for missing classes. Therefore, the average attendance rate of 40% reported in our study was quite typical at that time.
Fig. 1 Distribution of FoS overall scores.
Looking at socio-demographic factors, we can see that most of the students were clustered within the 19–23 age range. Just over two-thirds of the students enrolled in the course were male. Nearly 79% of students still lived with their parent(s), and just over 2.2% of all students were married. This reflects the cultural preferences of the native population, with children generally living with their parents until they get married. Most of the remaining 21% of students not living with their parents were students from regional areas of Uzbekistan.
There has been ongoing debate about the quality of high-school education in Uzbekistan in relation to the language of instruction. During the Soviet time, because of an abundance of resources and better teacher training, Russian-language schools were perceived as providing better education than those using the Uzbek language (DeYoung and Constantine Citation2009). During the subsequent 30 years of independence, the scope and scale of Russian use in education has declined dramatically (Ismatov Citation2019), and there has recently been a prominent debate as to whether the quality of high-school instruction delivered in Russian is better (see, e.g., Gazeta.Uz Citation2021). Although we could not obtain the data necessary to test this hypothesis directly, we used students’ ethnicity as a proxy for the effect. This is because students from a non-Uzbek background tend to choose Russian-language schools/classes where possible, whereas most ethnic natives had their high-school education in the Uzbek language.
The proportion of female students in the cohort is relatively small, at around 32%. This is not surprising given that a common orientation in female education has been to the areas of health and education. Within families, opportunities in those disciplines perceived as offering better job outcomes (such as finance, economics, and business) were often reserved for boys (DeYoung and Constantine 2009). Over 52% of students in the cohort were full-time students with no work commitments, 41% had part-time work commitments, and only a small percentage (less than 7%) worked full-time.
Having information on the timing of downloads, we could construct a measure of “study consistency” (SD Ndays) for each of the students. This was calculated as the standard deviation of the average number of days between the student’s downloads of study materials. The measure was designed to differentiate between students who studied the material regularly throughout the study periods, and those who clustered their study around the time of major assessment items. The potential pitfall of the measure might be an inability to differentiate between those studying consistently and frequently and those studying consistently but rarely. However, this is not a major issue here because the study materials were published online on a weekly basis: as such, accessing the online material only once a week should not be materially different from accessing the material more frequently. In our sample, we have not observed consistent engagement with the material on a higher-than-weekly frequency.
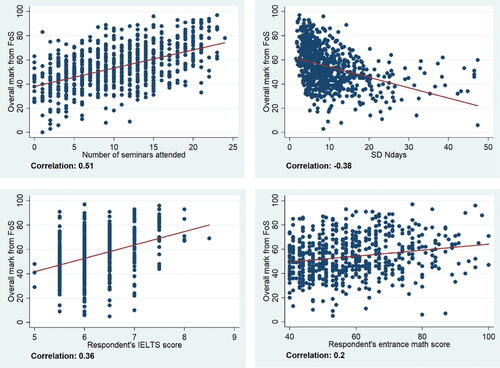
shows correlations of the overall FoS course scores with the key explanatory and control variables. The correlation between the overall score and the attendance rate appears to be particularly strong. Similarly, consistency of students’ engagement with online resources (SD Ndays) seems to have some correlation with the overall course results. Control variables of students’ mathematical abilities and English language proficiency also show positive correlation, albeit the slope of the graph for the relationship between math score and overall mark is less steep than that of the other graphs. Overall, there are early indications of strong explanatory power for the major independent variables.
Fig. 2 Scatterplots and correlations of overall course scores with four key variables.
To explore whether multicollinearity is a problem among the explanatory variables, we examined pair-wise correlations and calculated variance inflation factors (VIFs). Most pair-wise correlations in the sample were low, with the exception of the lecture- and solution-downloads variables, and the capital-city and living-with-parents variables, which showed somewhat higher correlation coefficients of 0.58 and 0.57, respectively. However, VIFs for all variables did not betray any multicollinearity issues, with all values being below 2.
4 Do Student Characteristics Affect their Academic Performance?
4.1 Does Student Engagement Matter?
We start our analysis by examining whether learning and teaching factors help students to perform better in the course. The principal factor in this regard is typically class attendance, but student engagement with online resources—downloaded lecture notes and practical solutions—may also be significant. We controlled for students’ language ability by using scores from an English language entrance test, and controlled for cognitive and computational ability by using scores from a math entrance test. In addition, we partially controlled for student motivation by including the regional dummy variable Capital city in the regression. This dummy variable separates students who spent most of their schooling years in the Tashkent capital from those schooled outside the capital. In its economic development, Uzbekistan is regionally heterogeneous and, as evident from indicators of economic activity (CEIC Citation2021), the difference between the capital city and other major regional centers within the country is substantial. Thus, we believe the levels of motivation of students arriving from the regions of Uzbekistan are influenced by similar factors to those determining the motivation of rural students seeking new opportunities in big cities. Literature in this area indicates that students seeking college education in big cities have additional motivation to succeed as they leave their home (regional) community to pursue bigger financial and economic opportunities. Encouragement from, and expectations of, family and community members adds to the motivation of such students (see Beckwith and Hirshfield Citation2021; Stone and Évora Citation2021). According to Stone and Évora (Citation2021), rural communities not only invest in and prepare their highest performing students for higher education but also encourage them to move away and pursue it. In addition to differences in motivation, students moving to Tashkent from the other regions of Uzbekistan are more likely to have developed the critical skills necessary for independent living, including time management and multitasking, which can also contribute to academic success.
As outlined previously, we also sought to introduce an original variable to the model to reflect students’ consistency of effort in relation to the course. Our hypothesis was that if students engage consistently with the course content throughout the teaching semesters, they should obtain better final course outcomes. Using records of students’ engagement with the online course resources, we estimated the standard deviation in days between students’ accesses of online content (SD Ndays).
As can be seen in , in the full model (Model 1) we found that student engagement plays an important role in student course outcomes. The number-of-lessons-attended variable (N lessons) is positive and statistically discernible in the analysis, which is consistent with the findings of Andrietti and Velasco (Citation2015), and Asarta and Schmidt (Citation2017), with each additional class attended adding, on average, one point to a student’s overall course score. Student use of online resources—downloads of lectures and workshop solutions—also produced statistically discernible results at 5% and 10% levels. In relative terms, downloaded practical solutions seem to add more value to student outcomes than downloads of lecture notes. Students who have downloaded practical solutions are more likely to be engaged in active problem-based learning, which in turn can help to enhance their learning outcomes (Barrows Citation1996; Hayat Citation2014). Thus, the regression result is not surprising. As hypothesized, the consistency-of-effort variable (SD Ndays) produced negative coefficients, but proved statistically indiscernible at conventional levels, perhaps because it relates closely to student attendance and online resource use. Overall, the results clearly demonstrate that student engagement through class attendance and online resource utilization are positively associated with enhanced student course outcomes.
Table 3 Estimation results.
In addition, we checked for any systematic difference in student cohorts, that is, between students enrolled in the three different degree programs (BEF, BA, and BIS). Somewhat unexpectedly, the dummies for the program in which a student was enrolled were statistically discernible and exhibited large coefficients even after controlling for students’ cognitive, computational, and linguistic abilities, and partially controlling for motivation. Based on the authors’ own observations, students on economic and finance programs are usually more quantitatively inclined, and thus might be expected to perform better in a statistics course. However, given that our regression specification includes a control for the math entrance score, it seems that there may be other explanations of why the students of the BA and BIS programs perform more poorly in the FoS course. Indeed, the performance gap may be attributable to a variety of factors, including self-selection of students in relation to certain unobservable characteristics. For instance, unlike students in economics and finance programs, students in the BA and BIS program faculties may consider statistics to be a “non-core” course of secondary importance to their respective programs, and so dedicate less independent study effort to it. Unfortunately, we have not had an opportunity to survey students in the sample as to whether this was indeed the case. This might be a valuable exercise for future studies.
4.2 Do Demographic and Socio-Economic Circumstances Play a Role in Student Performance?
The next part of our analysis aimed to find out whether demographic factors such as age, gender, language of school instruction, and marital status play a role in determining students’ FoS course outcomes.
In terms of age, two contributing factors may be relevant in this respect. On the one hand, more mature (older) students might take their studies more seriously, thus, performing better. On the other hand, such students might have experienced a gap in their formal studies, potentially affecting their “study fitness” in a negative manner, leading to inferior outcomes. Interestingly, as can be seen in , there was more evidence for the latter than the former in our sample. However, given that the age range within our sample was rather small, age played only a minor role in the final outcome.
The gender variable (Female) for the sample is positive and statistically discernible at the 5% level, with female students performing better than their male counterparts. This could be due, to some extent, to a selection bias: female students constituted just over 30% of the cohort, and it is likely that to enroll in the programs many female students had to overcome additional cultural barriers by means of extra motivation, dedication and intelligence (Asian Development Bank Asian 2018). It follows that attracting more females would be beneficial in maintaining and improving standards within the university.
On its own, marital status does not appear to have a significant impact on the relative performance within the class. However, we also tested for the potential impact that marital status might have on the performance of female students, given the substantial household burden placed on young married women in the region (DeYoung and Constantine 2009). There were only 11 married females in the sample; however, the impact is strong and statistically discernible at the 95% level. The predicted negative impact on female students of marriage averaged to 9.4 points; the university might, therefore, consider establishing some additional support mechanisms to assist such students.
The variable indicating whether students were living with their parents produced statistically indiscernible outcomes. The result is not surprising because this dummy variable is strongly correlated with the Capital city control variable.
We found some evidence in support of the hypothesis that students with a Russian-language schooling perform better than those whose school language of instruction was the native one; the impact is modest with the coefficient for the schooling language proxy being equal to 3 and statistically discernible at the 95% level. This finding aligns well with the UNICEF (Citation2019) study, which found better academic outcomes in science, and the USAID (Citation2022) report that found better literacy for primary school children, in Russian-language schools.
Finally, as expected and in line with the findings of Salamonson and Andrew (Citation2006), we found a negative impact for student employment on their study outcomes. This impact is strong and statistically discernible for students who work full-time, with a coefficient of –7.6. However, the impact of part-time work was not statistically discernible at conventional levels, albeit the coefficient remained negative in the estimations.
Unsurprisingly, the control variables for students’ command of the English language and cognitive and computational abilities are also positive and statistically discernible, which aligns with earlier studies by Johnson and Kuennen (Citation2006) and Akimov, Kobinger, and Malin (Citation2018). The correlation with the English language test score is particularly strong, with every additional point on the IELTS score being associated with more than nine extra points in the final FoS course score. The variable that is designed to partially control for student motivation (Capital city) is also positive and statistically discernible: students who must relocate to the capital city to study are likely to be more motivated and driven to succeed in their studies (Asian Development Bank Asian Citation2018).
4.3 Robustness Tests
A potential threat to validity in work on educational performance comes from unobserved heterogeneity associated with key covariates of interest. Because students have a range of characteristics that are (i) difficult to measure (motivation, cognitive and language skills, etc.), (ii) potentially correlated with learning styles, and (iii) plausibly predictive of outcomes, the parameter estimates in standard econometric models may be biased.
In this section, we explore the possibility that unobserved cognitive and language skills may account for some of the correlations presented above. We do so by considering regression models that include or exclude our measures of cognition/computation and language, as captured by performance in mathematics and English language tests. If estimates of the effects of educational modes are nonzero and stable in the presence of these controls, then it is unlikely that additional controls for ability drawn from an unobserved set would have much effect. Conversely, if our estimates move sharply toward zero when we partially control for cognitive and language skills, then it is likely that a fuller set of controls could attenuate our estimates entirely. In such an instance the results would not be robust and could be the result of endogeneity in the form of unobserved confounding. To assess stability in this way, we use the method newly derived by Oster (Citation2019), which takes into account R-squared movements; she suggested a standard for a robustness test that could be implemented easily by researchers. Thus, we tested robustness by incorporating R-squared movements into the assessment of coefficient stability. The adjusted coefficients for the statistically discernible variables are shown in .
Table 4 Robustness tests of stability of the explanatory variables of Model 1.
As is evident from , the adjusted coefficients for learning and teaching variables that reflect students’ choices under two scenarios, as recommended by Oster (Citation2019), remain mostly stable. In particular, class attendance and program enrollment variables exhibit very robust results. The coefficients of the variables that reflect the downloading of online materials are less stable, albeit they remain positive. For variables reflecting students’ socio-economic characteristics, the coefficients are generally less stable than for the teaching and learning variables, although the signs of the coefficients remain the same for all such variables following the adjustments. The most robust results in this category are for the variables that reflect schooling language and full-time work status, while the least robust results are observed for the age variable and the dummy variable for married women.
To further test whether our control variables are good counters to potential underlying confounders, we follow Pei, Pischke, and Schwandt (Citation2019) and individually test two major controls (Math test and IELTS test) against explanatory variables. The results are included in , in the form of Models 3 and 4. They indicate that the choice of control variables in our estimations is appropriate, because most of the explanatory variables used in the estimation do not show statistically discernible relationships with the control variables, and the R-squared outcomes in these regressions are low.
Overall, the robustness tests described above suggest that the model and its control variables that we have used are well-specified and any unobserved characteristics are well-controlled. Although we control for a rich set of covariates in our study, omitted-variable bias may still be present. There are many unobserved student characteristics (such as ability or motivation) that may drive both academic performance and the factors we examine (such as engagement and choice of major), which subsequently could bias some of our obtained results.
5 Conclusion
Our study of the determinants of student performance in the first-year statistics class in WIUT produced some interesting results.
First, we have, in general, obtained confirmation for the conventional wisdom and existing literature surrounding this subject. For teaching and learning variables, we found that students’ engagement with their studies, expressed through class attendance and utilization of learning material provided by instructors, continues to play an important role in ensuring successful outcomes for them. Our experiment with a new variable to proxy students’ consistency of effort was only partially successful; developing a better proxy might be a subject for future research endeavors. We also found some indirect evidence that when students do not regard a particular course as important for their studies, it may have a negative impact on their motivation and effort in relation to the course.
For demographic and socio-economic variables, we found associations similar to the ones that have been reported elsewhere in the world (e.g., Beckwith and Hirshfield Citation2021; Johnson and Kuennen Citation2006; Stone and Évora Citation2021). Students who must overcome additional barriers to start their university education (in our case, female students and those from the regions) tend to perform better than other students. In addition, work and family commitments seem to be strong impediments to study, with a negative impact on student performance. In this regard, university (and/or government) assistance in the form of needs- or merit-based scholarships might be useful in alleviating at least some of the problem.
Finally, and relatedly, there are important implications from our study in relation to gender and educational quality policies. Given a reported deterioration of gender equality in the region (Asian Development Bank Asian 2018), reversing this trend and encouraging female participation in higher education in general, and in male-dominated disciplines in particular, could produce positive outcomes both in terms of standards within the university and, more broadly, in the national benefit of a better educated workforce. Similarly, it appears that work needs to be done to improve educational quality in schools in Uzbekistan, particularly those teaching in the local native language. To make broader generalizations in relation to demographic and socio-economic variables, a larger and more contemporary post-pandemic cross-institutional study might be warranted in the future.
Acknowledgments
This article has benefited from the insightful comments of Associate Professor Nicholas Rohde, Professor Robert Bianchi, and Dr. Akihiro Omura (Griffith University) and four anonymous referees.
Data Availability Statement
The data that support the findings of this study are available on request from the corresponding author, [AA]. The data are not publicly available due to ethical clearance conditions by the WIUT as the dataset contains the information that could compromise the privacy of research participants.
The Stata code and research output data that support the findings of this study are openly available in Zenodo at https://doi.org/10.5281/zenodo.7374981.
Disclosure Statement
The authors report there are no competing interests to declare.
Notes
1 Other potential metrics that can account for student success include time to completion, retention rates, graduation rates, and even employability outcomes. For example, Kratochvil and Thomas (Citation2018) presented student success from an institutional, student, and societal perspective and highlighted various nuances in measurement that could lead to different insights.
2 A lecture where students are actively involved in the teaching/learning process through discussions and group activities.
3 The term “program” or “degree program” in this article as a course of study leading to an academic degree from WIUT.
4 The project secured ethical clearance from WIUT to use relevant stored data on the students enrolled in the course and to survey students (on a voluntary basis) for the pre-specified additional questions.
References
- Akimov, A., and Malin, M. (2017), “Are Classroom Games Useful for Teaching ‘sticky’ Finance Concepts?” Advances in Financial Education, 15, 61–79.
- Akimov, A., Kobinger, S., and Malin, M. (2018), “Determinants of Student Success in Finance Courses,” Journal of Financial Education, 44, 223–245.
- Al-Bahrani, A., Dowell, C. T., and Patel, D. (2016), “Video Scrapbooking: An Art form Revived in the Economics Curriculum,” Journal of Economics, and Economic Education Research, 17, 7–15.
- Al-Bahrani, A., Holder, K., Moryl, R., Ryan, P., and Patel, D. (2016), “Putting Yourself in the Picture with an ‘ECONSelfie’: Using Student-Generated Photos to Enhance Introductory Economics Courses,” International Review of Economics Education, 22, 16–22. DOI: 10.1016/j.iree.2016.03.003.
- Al-Bahrani, A., Libis, B., Drabik, S., and Gibson, J. (2017), “Econ Beats: A Semester-Long, Interdisciplinary, Project-based Learning Assignment,” Journal of Economics and Finance Education, 16, 1–11.
- Algan, Y., Cahuc, P., and Shleifer, A. (2013), “Teaching Practices Social Capital,” American Economic Journal: Applied Economics, 5, 189–210. DOI: 10.1257/app.5.3.189.
- Alldredge, J., and Brown, G. (2006), “Associations of Course Performance with Student Beliefs: An Analysis by Gender and Instructional Software Environment,” Statistics Education Research Journal, 5, 64–77. DOI: 10.52041/serj.v5i1.509.
- Al-Mutairi, A. (2011), “Factors Affecting Business Students’ Performance in Arab Open University: The Case of Kuwait,” International Journal of Business, and Management, 6, 146–155.
- Al-Shammari, F., Saguban, R., Pasay-An, E., Altheban, A., and Al-Shammari, L. (2018), “Factors Affecting the Academic Performance of Student Nurses: A Cross-Sectional Study,” Journal of Nursing Education, and Practice, 8, 60–68. DOI: 10.5430/jnep.v8n1p60.
- Andrietti, V., and Velasco, C. (2015), “Lecture Attendance, Study Time and Academic Performance: A Panel Data Study,” Journal of Economic Education, 46, 239–259. DOI: 10.1080/00220485.2015.1040182.
- Arias, J., and Walker, D. (2004), “Additional Evidence on the Relationship between Class Size and Student Performance,” Journal of Economic Education, 35, 311–329. DOI: 10.3200/JECE.35.4.311-329.
- Asarta, C., and Schmidt, J. (2017), “Comparing Student Performance in Blended and Traditional Courses: Does Prior Academic Achievement Matter?” The Internet and Higher Education, 32, 29–38. DOI: 10.1016/j.iheduc.2016.08.002.
- Asian Development Bank. (2018), Uzbekistan Country Gender Assessment Update, Manila: Asian Development Bank.
- Baepler, P., Walker, J., and Driessen, M. (2014), “It’s not about Seat Time: Blending, Flipping, and Efficiency in Active Learning Classrooms,” Computers and Education, 78, 227–236. DOI: 10.1016/j.compedu.2014.06.006.
- Barrows, H. S. (1996), “Problem-based Learning in Medicine and Beyond: A Brief Overview,” in Bringing Problem-Based Learning to Higher Education: Theory and Practice, eds. L. Wilkerson and W. H. Gijselaers, pp. 3–11, San Francisco, CA: Jossey-Bass. DOI: 10.1002/tl.37219966804.
- Becker, R., and Proud, S. (2018), “Flipping Quantitative Tutorials,” International Review of Economics Education, 29, 59–73. DOI: 10.1016/j.iree.2018.01.004.
- Beckwith, J., and Hirshfield, L. (2021), “Motivating Factors that Encourage Rural Students to Pursue Engineering,” in Paper Presented at 2021 ASEE Virtual Annual Conference, Washington, D.C.: American Society for Engineering Education.
- Biggs, J., and Tang, C. (2011), Teaching for Quality Learning at University, 4th ed. Maidenhead, UK: Open University Press.
- Boatright-Horowitz, S., and Arruda, C. (2013), “College Students’ Categorical Perceptions of Grades: It’s Simply ‘Good’ vs. ‘Bad’,” Assessment and Evaluation in Higher Education, 38, 253–259. DOI: 10.1080/02602938.2011.618877.
- Bonesrønning, H., and Opstad, L. (2012), “How much is Students’ College Performance Affected by Quantity of Study?” International Review of Economics Education, 12, 28–45. DOI: 10.1016/S1477-3880(15)30012-8.
- Cantwell, R., Archer, J., and Bourke, S. (2001), “A Comparison of the Academic Experiences and Achievement of University Students Entering by Traditional and Non-traditional Means,” Assessment and Evaluation in Higher Education, 26, 221–234. DOI: 10.1080/02602930120052387.
- Case, J. M. (2008), “Alienation and Engagement: Development of an Alternative Theoretical Framework for Understanding Student Learning,” Higher Education, 55, 321–332. DOI: 10.1007/s10734-007-9057-5.
- CEIC. (2021), “Uzbekistan SNA 2008: GDP: By Region,” available at https://www.ceicdata.com/en/uzbekistan/sna-2008-gdp-by-region. Retrieved 2 April 2022.
- Chance, B., Ben-Zvi, D., Garfield, J., and Medina, E. (2007), “The Role of Technology in Improving Student Learning of Statistics,” Technology Innovations in Statistics Education, 1, 1–26. DOI: 10.5070/T511000026.
- Chen, J., and Lin, T. (2008a), “Class Attendance and Exam Performance: A Randomized Experiment,” Journal of Economic Education, 39, 213–227. DOI: 10.3200/JECE.39.3.213-227.
- Chen, J., and Lin, T. (2008b), “Does Downloading PowerPoint Slides before the Lecture Lead to Better Student Achievement?” International Review of Economics Education, 7, 9–18. DOI: 10.1016/S1477-3880(15)30092-X.
- Clark, M. (2006), “A First-Year Statistics Programme for Indigenous and Migrant Students Arrived at by Co-operating with Local Communities and the Students Themselves,” Paper Presented at ICOTS-7, Salvador de Bahia, Brazil.
- Cochran, H., Velikova, M., Childs, B., and Simmons, L. (2015), “Apps for Economics,” Journal of Economic Education, 46, 231–232. DOI: 10.1080/00220485.2015.1006745.
- Cohn, E., and Johnson, E. (2006), “Class Attendance and Performance in Principles of Economics,” Education Economics, 14, 211–233. DOI: 10.1080/09645290600622954.
- Dancer, D., Morrison, K., and Tarr, G. (2015), “Measuring the Effects of Peer Learning on Students’ Academic Achievement in First-Year Business Statistics,” Studies in Higher Education, 40, 1808–1828. DOI: 10.1080/03075079.2014.916671.
- DeYoung, A., and Constantine, E. (2009), “Re-gendered Education and Society in the Newly Independent States (NIS) of Central Asia,” in Gender, Equality and Education from International and Comparative Perspectives, eds. D. Baker and A. Wiseman, pp. 255–299. Bingley, UK: Emerald.
- Dobkin, C., Gil, R., and Marion, J. (2010), “Skipping Class in College and Exam Performance: Evidence from a Regression Discontinuity Classroom Experiment,” Economics of Education Review, 29, 566–575. DOI: 10.1016/j.econedurev.2009.09.004.
- Dowling, C., Godfrey, J., and Gyles, N. (2003), “Do Hybrid Flexible Delivery Teaching Methods Improve Accounting Students’ Learning Outcomes?” Accounting Education, 12, 373–391. DOI: 10.1080/0963928032000154512.
- Erwin, C., and Binder, M. (2020), “Does Broad-based Merit Aid Improve College Completion? Evidence from New Mexico’s Lottery Scholarship,” Education Finance and Policy, 15, 164–190. DOI: 10.1162/edfp_a_00270.
- Farmus, L., Cribbie, R. A., and Rotondi, M. A. (2020), “The Flipped Classroom in Introductory Statistics: Early Evidence from a Systematic Review and Meta-analysis,” Journal of Statistics Education, 28, 316–325. DOI: 10.1080/10691898.2020.1834475.
- Fry, H., Ketteridge, S., and Marshall, S. (2003), “Understanding Student Learning,” in A Handbook for Teaching and Learning in Higher Education, pp. 18–25, London: Kogan Page.
- Gazeta, Uz. (2021), “Alisher Kadirov – About the ‘New Generation of Uzbeks’ who do not know their Native Language,” available at https://www.gazeta.uz/ru/2021/04/15/kadirov-rus/. Retrieved 20 April 2021.
- Haley, M., Johnson, M., and Kuennen, E. (2007), “Student and Professor Gender Effects in Introductory Business Statistics,” Journal of Statistics Education, 15, 1–19. DOI: 10.1080/10691898.2007.11889549.
- Harmon, O. R., Alpert, W. T., and Histen, J. (2014), “Online Discussion and Learning Outcomes,” International Advances in Economics Research, 20, 33–44. DOI: 10.1007/s11294-013-9453-9.
- Harraway, J. A. (2012), “Learning Statistics Using Motivational Videos, Real Data and Free Software,” Technology Innovations in Statistics Education, 6, 1–21. DOI: 10.5070/T561000186.
- Hayat, M. J. (2014), “Guidelines for Assessment and Instruction in Statistics Education (GAISE): Extending GAISE into Nursing Education,” The Journal of Nursing Education, 53, 192–198, quiz 2p following 198. DOI: 10.3928/01484834-20140325-01.
- Hoare, A., and Johnston, R. (2010), “Widening Participation through Admissions Policy – A British Case Study of School and University Performance,” Studies in Higher Education, 36, 21–41. DOI: 10.1080/03075070903414297.
- Holder, K., Hoffer, A., Al-Bahrani, A., and Lindahl, S. (2015), “Rockonomix,” The Journal of Economic Education, 46, 443. DOI: 10.1080/00220485.2015.1071216.
- Hoyt, G., and McGoldrick, K. (2012), International Handbook on Teaching and Learning Economics. Cheltenham, UK: Elgar.
- Hoyt, G., and McGoldrick, K. (2019), “50 years of Economic Instruction in the Journal of Economic Education,” Journal of Economic Education, 50, 168–195. DOI: 10.1080/00220485.2019.1582388.
- Imazeki, J. (2014), “Bring-Your-Own-Device: Turning Cell Phones into Forces for Good,” Journal of Economic Education, 45, 240–250. DOI: 10.1080/00220485.2014.917898.
- Ismatov, A. (2019), Legal Education in Uzbekistan: Historical Overview and Challenges of Transition, Discussion Paper N18. Nagoya: Center for Asian Legal Exchange, Nagoya University.
- Johnson, M., and Kuennen, E. (2006), “Basic Math Skills and Performance in an Introductory Statistics Course,” Journal of Statistics Education, 14, 1–14. DOI: 10.1080/10691898.2006.11910581.
- Kaplan, J. (2011), “Innovative Activities: How Clickers can Facilitate the Use of Simulations in Large Lecture Classes,” Technology Innovations in Statistics Education, 5, 1–15. DOI: 10.5070/T551000045.
- Kokkelenberg, E., Dillon, M., and Christy, S. (2008), “The Effects of Class Size on Student Grades at a Public University,” Economics of Education Review, 27, 221–233. DOI: 10.1016/j.econedurev.2006.09.011.
- Kratochvil, D., and Thomas, L. D. W. (2018), “Measuring Student Success: A Review of Methods and Motives,” in The Future of Higher Education in the Middle East and Africa, eds. H. M. Fardoun, K. J. Downing and M. Mok, pp. 241–249, Cham: Springer.
- Leppink, J., Broers, N. J., Imbos, T., van der Vleuten, C. P. M., and Berger, M. P. F. (2013), “The Effect of Guidance in Problem-based Learning of Statistics,” The Journal of Experimental Education, 82, 391–407. DOI: 10.1080/00220973.2013.813365.
- Lizzio, A., Wilson, K., and Simons, R. (2002), “University Students’ Perceptions of the Learning Environment and Academic Outcomes: Implications for Theory and Practice,” Studies in Higher Education, 27, 27–52. DOI: 10.1080/03075070120099359.
- Lunsford, M. L., Poplin, P. L., and Pederson, J. G. (2018), “From Research to Practice: Using Assessment and Early Intervention to Improve Student Success in Introductory Statistics,” Journal of Statistics Education, 26, 125–134. DOI: 10.1080/10691898.2018.1483785.
- Marburger, D. (2001), “Absenteeism and Undergraduate Exam Performance,” Journal of Economic Education, 32, 99–109. DOI: 10.1080/00220480109595176.
- McClave, J. T., Benson, P. J., and Sincich, T. (2012), Statistics for Business and Economics (12th ed.), Upper Saddle River, NJ: Prentice Hall.
- McGoldrick, K., Battle, A., and Gallagher, S. (2000), “Service-Learning and the Economics Course: Theory and Practice,” American Economist, 44, 43–51. DOI: 10.1177/056943450004400106.
- McKenzie, K., and Gow, K. (2004), “Exploring the First Year Academic Achievement of School Leavers and Mature-Age Students through Structural Equation Modelling,” Learning and Individual Differences, 14, 107–123. DOI: 10.1016/j.lindif.2003.10.002.
- McKenzie, K., and Schweitzer, R. (2001), “Who Succeeds at University? Factors Predicting Academic Performance in First-Year Australian University Students,” Higher Education Research and Development, 20, 21–33. DOI: 10.1080/07924360120043621.
- Meyer, J., and Land, R. (2003), “Threshold Concepts and Troublesome Knowledge: Linkages to Ways of Thinking and Practising Within the Disciplines,” Occasional Report 4. Edinburgh: Enhancing Teaching-Learning Environments in Undergraduate Courses Project, University of Edinburgh.
- Mishra, S. (2020), “Social Networks, Social Capital, Social Support and Academic Success in Higher Education: A Systematic Review with a Special Focus on ‘Underrepresented’ Students,” Educational Research Review, 29, 1000307. DOI: 10.1016/j.edurev.2019.100307.
- Moryl, R. (2013), “T-shirts, Moonshine and Autopsies: Using Podcasts to Engage Undergraduate Microeconomics Students,” International Review of Economics Education, 13, 67–74. DOI: 10.1016/j.iree.2013.02.001.
- Munley, V., Garvey, E., and McConnell, M. (2010), “The Effectiveness of Peer Tutoring on Student Achievement at the University Level,” American Economic Review, 100, 277–282. DOI: 10.1257/aer.100.2.277.
- Orlov, A., and Roufagalas, J. (2012), “Performance Determinants in Undergraduate Economics Classes: The Effect of Cognitive Reflection,” International Review of Economics Education, 11, 28–45. DOI: 10.1016/S1477-3880(15)30013-X.
- Oster, E. (2019), “Unobservable Selection and Coefficient Stability: Theory and Evidence,” Journal of Business and Economic Statistics, 37, 187–204. DOI: 10.1080/07350015.2016.1227711.
- Pei, Z., Pischke, J., and Schwandt, H. (2019), “Poorly Measured Confounders are More Useful on the Left than on the Right,” Journal of Business and Economic Statistics, 37, 205–216. DOI: 10.1080/07350015.2018.1462710.
- Picault, J. (2019), “The Economics Instructor’s Toolbox,” International Review of Economics Education, 30, 1–13. DOI: 10.1016/j.iree.2019.01.001.
- Ramsden, P. (2003), “Approaches to Learning,” in Learning to Teach in Higher Education, pp. 39–61. London: Routledge Falmer.
- Reston, E. (2013), “An Outcome-based Framework for Technology Integration in Higher Education Statistics Curricula for Non-majors,” Technology Innovations in Statistics Education, 7, 1–15. DOI: 10.5070/T572013894.
- Reyneke, F., Fletcher, L., and Harding, A. (2021), “Enhancing a Flipped Statistics First Year Course by Using QT-Clickers,” Journal of Statistics and Data Science Education, 29, 71–83. DOI: 10.1080/10691898.2021.1895694.
- Riffell, S., and Sibley, D. (2005), “Using Web-based Instruction to Improve Large Undergraduate Biology Courses: An Evaluation of a Hybrid Course Format,” Computers and Education, 44, 217–235. DOI: 10.1016/j.compedu.2004.01.005.
- Rosenshine, B., and Stevens, R. (1986), “Teaching Functions,” in Handbook of Research on Teaching (3rd ed.), ed. M. Wittrock, pp. 376–391, New York: MacMillan.
- Salamonson, Y., and Andrew, S. (2006), “Academic Performance in Nursing Students: Influence of Part-Time Employment, Age and Ethnicity,” Journal of Advanced Nursing, 55, 342–351. DOI: 10.1111/j.1365-2648.2006.03863_1.x.
- Salemi, M., and Walstad, W. (2010), Teaching Innovations in Economics: Strategies and Applications for Interactive Instruction, Cheltenham, UK: Elgar.
- Scheaffer, R., and Stasny, E. (2004), “The State of Undergraduate Education in Statistics: A Report from the CBMS 2000,” The American Statistician, 58, 265–271. DOI: 10.1198/000313004X5770.
- Scott, R. III. (2011), “Tableau Economique: Teaching Economics with a Tablet Computer,” Journal of Economic Education, 42, 175–180. DOI: 10.1080/00220485.2011.555720.
- Sheard, M. (2009), “Hardiness Commitment, Gender and Age Differentiate University Academic Performance,” The British Journal of Educational Psychology, 79, 189–204. DOI: 10.1348/000709908X304406.
- Smith, J., and Naylor, R. (2001), “Determinants of Degree Performance in UK Universities: A Statistical Analysis of the 1993 Student Cohort,” Oxford Bulletin of Economics and Statistics, 63, 29–60. DOI: 10.1111/1468-0084.00208.
- Stanca, L. (2006), “The Effects of Attendance on Academic Performance: Panel Data Evidence for Introductory Microeconomics,” Journal of Economic Education, 37, 251–266. DOI: 10.3200/JECE.37.3.251-266.
- Sten-Gahmberg, S. (2020), “Student Heterogeneity and Financial Incentives in Graduate Education: Evidence from a Student Aid Reform,” Education Finance and Policy, 15, 543–580. DOI: 10.1162/edfp_a_00294.
- Stinebrickner, R., and Stinebrickner, T. (2008), “The Causal Effect of Studying on Academic Performance,” The B.E. Journal of Economic Analysis and Policy, 8, 8–53. DOI: 10.2202/1935-1682.1868.
- Stone, A., and Évora, K. (2021), “From Country to Concrete: Motivators for Rural Students Choosing an Urban University,” College Student Affairs Journal, 39, 150–164. DOI: 10.1353/csj.2021.0014.
- Tertiary Education Quality and Standard Agency (TEQSA). (2020), “Guidance Note: Monitoring and Analysis of Student Performance,” available at https://www.teqsa.gov.au/sites/default/files/guidance-note-monitoring-analysis-student-performance-beta-v1-0-feb-2020-web.pdf?v=1581308769. Retrieved 10 May.
- Thiele, T., Singleton, A., Pope, D., and Stanistreet, D. (2016), “Predicting Students’ Academic Performance based on School and Socio-demographic Characteristics,” Studies in Higher Education, 41, 1424–1446. DOI: 10.1080/03075079.2014.974528.
- UNICEF (2019), Student Learning at Primary Grades in Uzbekistan: Outcomes, Challenges, and Opportunities: A Summary of Uzbekistan National Learning Achievement Study, Grade IV, 2018 Tashkent: UNICEF.
- USAID (2022), Early Grade Reading and Math Assessments Survey in Uzbekistan, Tashkent: USAID.
- Van Es, C., and Weaver, M. (2018), “Race, Sex and their Influences on Introductory Statistics Education,” Journal of Statistics Education, 28, 48–54. DOI: 10.1080/10691898.2018.1434426.
- Vazquez, J. J., and Chiang, E. P. (2014), “A Picture is Worth a Thousand Words (at least): The Effective Use of Visuals in the Economics Classroom,” International Review of Economics Education, 17, 109–119. DOI: 10.1016/j.iree.2014.08.006.
- Vermunt, J., and Vermetten, Y. (2004), “Patterns in Student Learning: Relationships between Learning Strategies, Conceptions of Learning and Learning Orientations,” Educational Psychology Review, 16, 359–384. DOI: 10.1007/s10648-004-0005-y.
- Wang, M., Haertel, G., and Walberg, H. (1993), “Toward a Knowledge Base for School Learning,” Review of Educational Research, 63, 249–294. DOI: 10.3102/00346543063003249.
- Wentland, D. (2004), “A Guide for Determining which Teaching Methodology to Utilize in Economic Education: Trying to Improve How Economic Information is Communicated to Students,” Education, 124, 640–648.