Abstract
R is becoming the standard for teaching statistics due to its flexibility, and open-source nature, replacing software programs like Minitab and SPSS. The main driver for reform within Scottish statistical undergraduate programs is the creation of the Scottish Qualification Authority’s Higher Applications of Mathematics course which has statistics as a core topic. The course saw R introduced into the Scottish high school curriculum for the first time from August 2021. This facilitates the need for R to be introduced into Higher Education courses at an earlier stage. In academic year 2021/22 we introduced RStudio into our first year introductory statistics class. This class is taken by students studying Mathematics, and those studying Biomedical Sciences. Both cohorts were surveyed in order to assess their anxiety and enjoyment of learning how to use R, with a goal of assessing any differences between the groups. We found that there was no association in software anxiety at the start of the class. However, as the class progressed the Mathematics students reported lower levels of anxiety compared to the Biomedical Sciences students. The Mathematics students seemed to enjoy the class more than the Biomedical Sciences students, thus, needing further investigation into enjoyment versus anxiety.
1 Introduction to R
R is an open source statistical programming language that is becoming more widely used in industry. R is also becoming the standard for teaching statistics due to its flexibility, open source nature and widely available documentation (Tucker et al. Citation2022; Grabarnik and Yaskolko Citation2013). This article will specifically look at the differences in software anxiety between students studying Mathematics and those studying Biomedical Sciences.
1.1 Why R?
We chose to replace Minitab with R and RStudio in our first year curriculum for a number of reasons. The first is that R is open source and is compatible with Windows, Mac and Linux operating systems. In contrast, Mac users are only able to access Minitab Express. This poses an issue as Minitab Express does not have the full functionality of Minitab on a Windows machine. Users are also able to access R and RStudio without the need to connect to a Virtual Private Network (VPN) to access a license while working at home. This need to be connected to a network posed a real problem for our students who were not always able to maintain a constant internet connection.
Teaching R also allows staff to use more complex and real-life data examples within the curriculum. Using authentic and real-world examples are essential to improve the learning experience and understanding of non-specialists Abaté and Cantone Citation2005; Matthews, Adams, and Goos Citation2009; Chang Citation2011.
Despite these benefits to transitioning our first year class to use R, we agree with Hackenberger (Citation2020) and Tucker et al. (Citation2022) that there will be a learning curve for our students. However, the ability to use R will benefit them in the long run. Teaching students R early on in their undergraduate degree will allow students to become more proficient in R and will thus increase their career prospects. One of the main employers in the United Kingdom, the National Health Service, is transitioning to R (NHS-R Community Citation2023).
As teachers in a Scottish higher education institution with a high intake of Scottish students, we also try to maintain our courses in line with students’ prior experience with statistics. It is likely that many of our learners will not have been exposed to statistics in their high school curriculum. In 2020, there were 3635 candidates for Advanced Higher Mathematics, compared with only 183 for Advanced Higher Statistics (Scottish Qualifications Authority Citation2020). This clearly shows that many of our learners will be coming to university with little to no prior statistical knowledge. That being said, the creation of the Scottish Qualification Authority’s (SQA) Higher Applications of Mathematics course (Scottish Qualifications Authority Citation2019) has statistics as one of its four core topics. Therefore, the Higher Applications of Mathematics is the main driver for a reform in lower level undergraduate statistics in Scottish universities. The Higher Application of Mathematics course which launched in Scottish high schools in August 2021 saw R and RStudio introduced into the Scottish high school curriculum for the first time. This therefore facilitates the need for R to be introduced into Higher Education courses at an earlier stage.
1.2 Computer Anxiety
Moving away from Minitab’s point-and click interface toward the use of the programming language R is likely to increase student anxiety relating to computer literacy. Research has suggested that there are two concepts which can impact an individual’s likelihood of success when using a computer: self efficacy and computer anxiety (Meinhardt-Injac and Skowronek Citation2022).
Self efficacy is related to an individual’s perceived view of themselves at a particular skill, computing in this case. If an individual has a low level of self efficacy then they have lower levels of interest in gaining computer skills. Whereas, if an individual has a high level of self efficacy then they have more levels of interest in gaining computer skills and as a result invest more in training and practice. Therefore, there is a correlation between high computer self efficacy and computing ability (Compeau and Higgins Citation1995; Sultan and Kanwal Citation2017; Aesaert et al. Citation2017; Saxena, Kumar, and Singh Citation2019).
Computer anxiety is a feeling of apprehension or dread when using computers (Chua, Chen, and Wong Citation1999). Sufferers of computer anxiety can experience physical adversities when using a computer such as increased heart rate or sweating. Computer anxiety can be improved with training and experience (Sultan and Kanwal Citation2017). Empirical studies have found that computer self efficacy and computer anxiety are mutually dependent (Zhang and Espinoza Citation1998; Saadé and Kira Citation2009).
1.3 Aims
This article will discuss the implementation of R and RStudio into a first year “Essential Statistics” undergraduate course. This class is particularly challenging from a teaching perspective in that it is taught in parallel to both Mathematics and Biomedical Sciences students. We have to be mindful of presenting the concepts in a theoretically robust way, balancing mathematical rigor with accessibility.
2 Course Context
“Essential Statistics” is a 10-week year one undergraduate module which aims to give students a fundamental understanding of probability, statistical analysis and reporting. Prior to academic year 2021/22, all the statistical analysis carried out in the course was performed using Minitab. However, we transferred this course to R for academic year 2021/22. The course was updated during the summer of 2021 and was ready for delivery for first year students in September 2021. Personally, we believe that moving the course to R will not only increase students programming ability but will also improve their general computer literacy.
The two populations are taught separately due to class size and administration relating to the placement of the class within the biomedical sciences degree program. However, due to staff workload constraints, the materials that students have access to on the learning management system are identical, as are any live taught components for the module. For the purposes of this research, we have considered the year groups which experienced the module completely online due to COVID-19 restrictions (2020/21 and 2021/22), in order to allow for results from different year groups to be comparable. Pre-COVID-19, the Essential Statistics class was delivered via one on-campus lecture and tutorial per week. For academic year 2022/23 and beyond, this class will be delivered on-campus.
The following sections will outline where the module sits within the curriculum for the mathematics students and biomedical sciences students, respectively. This will be followed by an overview of the course structure and assessment.
2.1 Mathematics Undergraduate Curriculum
The course under discussion forms one of three fundamentals classes that are compulsory for all of our honors students, including those on a joint degree program. The statistical concepts that they will encounter in future years will continue to build on the material presented as part of the class.
Students starting their courses prior to academic year 2021/22 were first introduced to R in year two of a four year degree program. From year two onwards, the students are expected to use the skills introduced in this class in all future statistics classes.
One of the key issues with this is that the module in which R is first introduced is not compulsory for students on certain joint degree programs, due to constraints in their curriculum which require them to take specific modules for degree accreditation. In the past, this has meant that these students in particular have found the upper level modules which use R more challenging as they are required to catch-up on their R knowledge alongside learning more advanced statistical concepts. We hope that introducing R during this module will help to alleviate some of this pressure on the students.
Additionally, introducing fundamental R materials in the first year will allow more content to be incorporated into the year two curriculum, so that students can be exposed to useful features, such as RMarkdown and the tidyverse.
2.2 Biomedical Sciences Undergraduate Curriculum
Currently, this Essential Statistics module is the only isolated statistics class which is taught by the Department of Mathematics and Statistics in their entire four-year degree program. That being said, statistical aspects are taught throughout the students’ full degree program as students will be expected to analyze data, give presentations, and write reports as part of their degree. Minitab is a good entry level software for many of the students due to its point and click interface, however, it limits their employability. The Biomedical Sciences department welcomed the move from Minitab to R as it helps with the accreditation of the course (the course is accredited by the Institute of Biomedical Science and Royal Society of Biology). In addition to this, previous studies have found that incorporating statistical software such as R can help to increase engagement and motivation, through encouraging students to interact directly with the data (da Silva and Moura Citation2020). Furthermore, the aforementioned Higher Applications of Mathematics will be a recognized course entry requirement for potential candidates. This means that some students may have studied R prior to starting university.
2.3 Course Overview
Essential Statistics is a 10 week module delivered in the first semester of year one.
In Week 0—affectionately known as “PreBoarding” students are encouraged to download R and RStudio. Full instructions for Mac and Windows users are provided on the class website. This week also allows students to get familiar with the R interface, and allows the lecturers to address any problems prior to the official teaching material being released.
The module is taught using a wide variety of modalities: lecture videos, slides, and most notably, interactive quizzes. R is incorporated into lectures by presenting examples in two ways: first with an example of how to calculate the solution by hand, and then second how to calculate the solution using R. Full commented scripts are provided for each example, and also in the early topics of the class instructional videos are provided demonstrating R.
The summative assessment for the course is different for the two populations. Both cohorts sit the same class test in week 5 that is facilitated via an online quiz. Biomedical sciences students are then assessed via two further quizzes in weeks 8 and 10, while the mathematics students are assessed via a group project that involves collecting and visualizing data and creating a poster outlining their results. The mathematics students are also assessed in week 10 via a final quiz.
At the end of each sub-topic the students are encouraged to complete a formative online quiz. These quizzes are not compulsory but give students the opportunity to practice the content in a style that reflects the summative assessment for the course. Note that in previous years that students were allowed an unlimited number of attempts at each quiz, but we found that students were simply memorizing the quizzes and not actually grasping the concepts. The number of quiz attempts was capped at 5, in keeping with findings in Cohen and Sasson (Citation2016).
In order to make the quizzes a useful learning tool, the questions are randomly selected from a question bank, so that the datasets and numbers provided in the question are different for each attempt. Not only does this allow the learner to get more practice and avoids students simply memorizing answers, it also reduces plagiarism drastically. This style of online quiz is also used for the summative assessment to ensure that no two students sit the same test.
3 Evaluation
In order to evaluate the impact of introducing R into this module, we asked students to provide feedback at various points throughout the course. The first feedback point occurred in week 0, prior to starting the course. The students were asked to provide feedback in week 5, which aligns with the first class test. Finally, students were asked to provide feedback in week 10 at the end of the course. These opportunities asked students to reflect on their anxiety around learning R, and also their enjoyment of using R via the questions presented in the Appendix.
The two cohorts were compared using Fisher’s Exact Test.
4 Results
4.1 Anxiety Around Programming
We first examined the question of how anxious the students initially were about using R in week 0 of the course. Students were asked “Are you worried/nervous about learning a new computing language” and were given the option to say that they were not worried at all, slightly worried, or very worried about learning a programming language. Overall, 76.7% of students who responded to this survey indicated that they were at least slightly worried about learning a new programming language. indicates that initial anxiety tended to be slightly higher than expected among Biomedical Sciences students compared to Mathematics and Statistics students (Fisher’s Exact P = 0.067).
Table 1 The percentage (expected percentage) of students in the two cohorts for each response to the question “Are you worried/nervous about learning a new computing language.”
indicates that anxiety at the mid-way point of the course tended to be slightly higher than expected among Biomedical Sciences students compared to Mathematics and Statistics students (Fisher’s Exact P = 0.005). Following this, anxiety levels were reassessed at the end of the module, with showing the results for each cohort. Fisher’s exact test showed a significant result (P = 0.006) that indicates increased anxiety among Biomedical Sciences students compared to Mathematics and Statistics students.
Table 2 The percentage (expected percentage) of students in the two cohorts for each response to the question “How would you rate your anxiety levels around using R for statistical analysis?” at the mid-way point of the module.
Table 3 The percentage (expected percentage) of students in the two cohorts for each response to the question “How would you rate your anxiety levels around using R for statistical analysis?” at the end of the module.
4.2 Enjoyment of Programming
To evaluate levels of enjoyment in learning R, we examined the question “How would you rate your agreement with the following statement: I enjoyed learning R as part of this module.” from the mid-way and end of module survey. We took responses indicating agreement or strong agreement to be positive. In the mid-way survey (shown in ) it can be seen that while overall Biomedical Sciences students enjoyed learning R, there were more neutral or negative responses to this question at the mid-way point of the course than might be expected (Fisher’s exact test P = 0.014). At the end of the module, over all of the classes 77.0% indicated some level of enjoyment in learning to use R as part of the module. The breakdown of this by cohort can be seen in , which indicates that, while overall Biomedical Sciences students enjoyed learning R, there were more neutral or negative responses to this question than might be expected (Fisher’s exact test P = 0.002).
Table 4 The percentage (expected percentage) of students in the two cohorts for each response to the question “How would you rate your agreement with the following statement: I enjoyed learning R as part of this module.” in week 5.
Table 5 The percentage (expected percentage) of students in the two cohorts for each response to the question “How would you rate your agreement with the following statement: I enjoyed learning R as part of this module.” in week 10.
4.3 Performance
4.3.1 Comparison between Cohorts
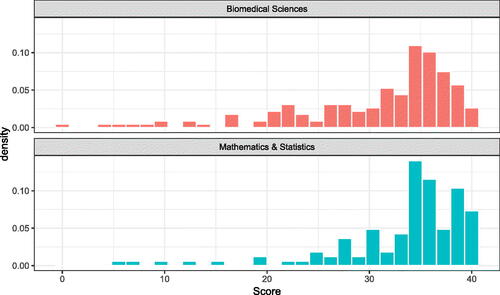
Due to differences in assessment between the two cohorts, only the scores out of 40 for the first class test have been compared. A histogram of the scores, separated by cohort is presented in , which indicates that the two distributions are very similar, though with a tendency for a heavier lower tail among the Biomedical Sciences students. The median scores were 34 out of 40 for the Biomedical Sciences students, and 35 out of 40 for the Mathematics and Statistics students. These slight differences in distribution are statistically significant at the 5% level based on a Mann-Whitney test (P = 0.002).
Fig. 1 Histograms comparing the distribution of scores for Biomedical Sciences students (Top) and Mathematics and Statistics students (Bottom).
4.3.2 Comparison to Previous Year
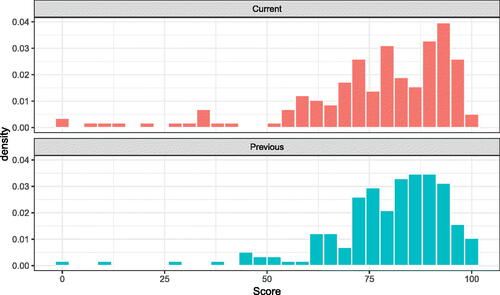
We compared the final scores for the Biomedical Sciences students this year (2021/22), to those from the previous year to assess whether the introduction of R into the module had a significant impact on student performance. shows a histogram of the scores for the Biomedical students in Academic year 2021/22 and those for the previous academic year who used Minitab as their statistics software. This Figure does not suggest any strong differences between the two sets of scores, though the scores for both groups of students are clearly skewed. The median score this year was 81, and for the previous year was 83. A Mann-Whitney U-test indicates no significant difference in the distribution of the scores this year compared to last year (P = 0.408).
Fig. 2 Histograms of the scores for the current Biomedical students who had R as their statistical software (top) and the previous years students who had Minitab as their statistical software (bottom).
5 Discussion
The results indicate that the Biomedical Sciences students tended to have greater anxiety and lower enjoyment of learning R programming than their mathematics counterparts. To examine this, we will first consider the entry requirements of the two degrees as shown in . The key difference is in the level of mathematics required for entry, with Mathematics students being required to have a B at A Level Mathematics and Biomedical Sciences students only required to have obtained a B at GCSE level. Scottish National 5s are roughly equivalent to GCSEs, and are the level below Scottish Highers. Having a lower mathematics qualification means that students on the Biomedical Science program may have to overcome the additional hurdle of understanding the mathematical components of the class on top of the programming component. It may also suggest that they have difficulties with the logic and precision required for programming.
Table 6 Summarizing the entry requirements for undergraduate courses in Mathematics and Biomedical Sciences.
This difference in mathematics qualifications may be the reason for the slight but significant differences in performance. This may be further exacerbated by differences in assessment literacies between the two cohorts. Mathematics undergraduate students are exposed to STACK quizzes in their Introductory Calculus module. In these quizzes, students must precisely type out their solutions correctly otherwise the software will score it incorrectly. This experience in another module of their course will likely have given Mathematics students a better understanding of how computational questions are scored automatically in the online environment.
Conversely, the Mathematics students were very engaged in the tutorials with many of them having their camera and microphones on during the Zoom tutorials. Many of the students would have done the work in advance and would come to the tutorial with questions outside the scope of the course.
The authors monitored this difference in motivation during the same class taught on campus in academic year 2022/23 and found similar trends. Attendance from Mathematics students was consistent and students were engaged during tutorials. In contrast, attendance of Biomedical Sciences students at classes dropped over the course of the module. Authors also put on additional classes for the Biomedical Sciences students in light of the results presented in this article, though these were also poorly attended.
Ultimately the main issue with this module is lack of awareness for the Biomedical Sciences students. Many students embark upon a degree in Biomedical Sciences thinking that they will never need to do mathematics again, and then they are forced to take an Essential Statistics module. It may be possible that we have students who are struggling from mathematical and/or statistical anxiety and this Essential Statistics module adds to their existing anxieties. Mathematical anxiety is a feeling of apprehension or dread when individuals are tasked with solving mathematical problems or manipulating numbers (Hopko et al. Citation2003; Carey et al. Citation2016). In some cases the mathematical anxiety can also evoke a physical response including increased heart rate (Dew, Galassi, and Galassi Citation1984). Statistical anxiety is similar to mathematical anxiety, but relating directly to statistics. It is unlikely that Biomedical Sciences students will be suffering from statistical anxiety as the majority of them will not have studied statistics prior to university. Whilst this article did not look at mathematical anxiety, it is possible to assume that some of the students will suffer from it, as it is estimated to impact 15% of the population (Dowker, Sarkar, and Looi Citation2016; Paechter et al. Citation2017).
Many of the Biomedical Sciences students could not see the benefits of R or how it would better their career or help them with their studies. It has been previously found that individuals studying statistics benefit from the inclusion of real-life examples in developing their statistical knowledge (Snee Citation1993; Schwartz, Ajazi, and Monaco Citation2018). Based on this, we aim to incorporate more opportunities for industry professionals to feed into the class with insight into how they use statistics and R day-to-day. To get student buy in from the outset of the class, some pre-prepared material will be included in the pre-boarding week. The class will also aim to incorporate invited lectures from individuals in industry who will motivate students about the use of statistics within the biomedical sciences. We have also spoken with the Biomedical Sciences department, and have indicated that, rather than being a standalone module in statistics (as described in Section 2.2), there should be some continuation on their study of statistics throughout the program that can be linked to highlight its importance. We have also asked for more details of this module to be placed on the University website so that potential candidates can make more informed choices about their studies.
On the other hand, the Mathematics students could straight away see the relevance of R in their degree and career. This may have made them more open to the software as a whole, and thus have lower levels of anxiety.
6 Conclusion
As a whole, students performed well in the module regardless of which cohort they belonged to. When drawing comparisons between the two cohorts, there is evidence to suggest that the Biomedical Sciences students had lower enjoyment, and greater anxiety around the module than the Mathematics students.
We believe that this is due to three main reasons. The first is related to assessment literacy, where our Mathematics students are consistently exposed to automatically scored computational quizzes, the Biomedical Sciences students are not and therefore do not have the same level of understanding of how precise the numbers need to be. The second is around student qualification, where some of the Biomedical Sciences students are at a disadvantage having not studied Higher or A-Level mathematics. These students are having to catch up with the mathematical content alongside learning how to program. The final reason relates to student expectations, with Biomedical Sciences students having no expectation (and in some cases desire) to study a mathematical subject as they struggle to see where this fits in to their career prospects.
Going forward, we hope to be able to further support the Biomedical Sciences students by incorporating more biomedical context to describe how this module will benefit them in the future which we hope will provide motivation for the students to participate in the module. We aim to incorporate more opportunities for industry professionals to feed into the class with insight into how they use statistics and R day-to-day in the biomedical sciences industry.
We will also aim to provide more scaffolding for the mathematical components to help those students with a lower mathematics qualification to learn these more quickly. We will also ensure that students are consistently made aware of how precise they should be when entering answers into the online quizzes so that they are not losing out on points that they should be getting.
Data Availability Statement
The data that support the findings of this study are openly available in Mendeley Data at http://doi.org/10.17632/3fkkgkbtt5.1. As this data has already been collected as part of the routine feedback process, it would be considered secondary data and so is excluded from the University Code of Practice so no ethical approval is required.
References
- Abaté, C. J., and Cantone, K. A. (2005), “An Evolutionary Approach to Mathematics Education: Enhancing Learning Through Contextual Modification,” Problems, Resources, and Issues in Mathematics Undergraduate Studies, 15, 157–176. DOI: 10.1080/10511970508984115.
- Aesaert, K., Voogt, J., Kuiper, E., and van Braak, J. (2017), “Accuracy and Bias of ICT Self-Efficacy: An Empirical Study Into Students’ Over-and Underestimation of their ICT Competences,” Computers in Human Behavior, 75, 92–102. DOI: 10.1016/j.chb.2017.05.010.
- Carey, E., Hill, F., Devine, A., and Szücs, D. (2016), “The Chicken or the Egg? The Direction of the Relationship Between Mathematics Anxiety and Mathematics Performance,” Frontiers in Psychology, 6, 1987. DOI: 10.3389/fpsyg.2015.01987.
- Chang, J.-M. (2011), “A Practical Approach to Inquiry-based Learning in Linear Algebra,” International Journal of Mathematical Education in Science and Technology, 42, 245–259. DOI: 10.1080/0020739X.2010.519795.
- Chua, S. L., Chen, D.-T., and Wong, A. F. (1999), “Computer Anxiety and its Correlates: A Meta-Analysis,” Computers in Human Behavior, 15, 609–623. DOI: 10.1016/S0747-5632(99)00039-4.
- Cohen, D., and Sasson, I. (2016), “Online Quizzes in a Virtual Learning Environment as a Tool for Formative Assessment,” Journal of Science and Technology Education, 6, 188–208.
- Compeau, D. R., and Higgins, C. A. (1995), “Computer Self-efficacy: Development of a Measure and Initial Test,” MIS Quarterly, 19, 189–211. DOI: 10.2307/249688.
- da Silva, H. A., and Moura, A. S. (2020), “Teaching Introductory Statistical Classes in Medical Schools Using RStudio and R Statistical Language: Evaluating Technology Acceptance and Change in Attitude Toward Statistics,” Journal of Statistics Education, 28, 212–219. DOI: 10.1080/10691898.2020.1773354.
- Dew, K. H., Galassi, J. P., and Galassi, M. D. (1984), “Math Anxiety: Relation with Situational Test Anxiety, Performance, Physiological Arousal, and Math Avoidance Behavior,” Journal of Counseling Psychology, 31, 580–583. DOI: 10.1037/0022-0167.31.4.580.
- Dowker, A., Sarkar, A., and Looi, C. Y. (2016), “Mathematics Anxiety: What Have We Learned in 60 years?,” Frontiers in Psychology, 7, 508. DOI: 10.3389/fpsyg.2016.00508.
- Grabarnik, G. Y., and Yaskolko, S. (2013), “Teaching Statistics to Non-mathematics Majors: Interdisciplinary Integration with R and EDA,” in 2013 IEEE Integrated STEM Education Conference (ISEC), IEEE, pp. 1–5. DOI: 10.1109/ISECon.2013.6525204.
- Hackenberger, B. K. (2020), “R Software: Unfriendly but Probably the Best,” Croatian Medical Journal, 61, 66–68. DOI: 10.3325/cmj.2020.61.66.
- Hopko, D. R., Mahadevan, R., Bare, R. L., and Hunt, M. K. (2003), “The Abbreviated Math Anxiety Scale (AMAS) Construction, Validity, and Reliability,” Assessment, 10, 178–182. DOI: 10.1177/1073191103010002008.
- Matthews, K. E., Adams, P., and Goos, M. (2009), “Putting it into Perspective: Mathematics in the Undergraduate Science Curriculum,” International Journal of Mathematical Education in Science and Technology, 40, 891–902. DOI: 10.1080/00207390903199244.
- Meinhardt-Injac, B., and Skowronek, C. (2022), “Computer Self-efficacy and Computer Anxiety in Social Work Students: Implications for Social Work Education,” Nordic Social Work Research, 12, 392–405. DOI: 10.1080/2156857X.2022.2041073.
- NHS-R Community. (2023), “Promoting the Use of R in the UK health & care system,” https://nhsrcommunity.com/. Accessed: 2023-02-01.
- Paechter, M., Macher, D., Martskvishvili, K., Wimmer, S., and Papousek, I. (2017), “Mathematics Anxiety and Statistics Anxiety. Shared but also Unshared Components and Antagonistic Contributions to Performance in Statistics,” Frontiers in Psychology, 8, 1196. DOI: 10.3389/fpsyg.2017.01196.
- Saadé, R. G., and Kira, D. (2009), “Computer Anxiety in e-Learning: The Effect of Computer Self-efficacy,” Journal of Information Technology Education: Research, 8, 177–191. DOI: 10.28945/166.
- Saxena, M. K., Kumar, S., and Singh, A. (2019), “Computer Anxiety and Individual Failure in Computer Usage Among Teacher Educators of Universities and Colleges: A Study on FDP Participants,” International Journal of Information Dissemination and Technology, 9, 191–195. DOI: 10.5958/2249-5576.2019.00037.2.
- Schwartz, T. A., Ajazi, E., and Monaco, J. (2018), “Findings From a Survey of Statistics and Biostatistics Instructors in the Health Sciences who Teach Using an Online or Flipped Format,” Journal of Statistics Education, 26, 143–148. DOI: 10.1080/10691898.2018.1484675.
- Scottish Qualifications Authority. (2019), “Higher Applications of Mathematics: Developing a New Qualification in Scotland to Increase Participation and Achievement,” British Society for Research into Learning Mathematics.
- Scottish Qualifications Authority. (2020), “2020 National Qualifications and Awards Results,” SQA Chief Examining Officer’s 2020 National Qualifications and Awards Results Report.
- Snee, R. D. (1993), “What’s Missing in Statistical Education?,” The American Statistician, 47, 149–154. DOI: 10.2307/2685201.
- Sultan, S., and Kanwal, F. (2017), “Personal Attributes Contributing to Computer Anxiety and Computer Self-Efficacy among Distance Learners,” Bulletin of Education and Research, 39, 33–44.
- Tucker, M. C., Shaw, S. T., Son, J. Y. and Stigler, J. W. (2022), “Teaching Statistics and Data Analysis with R,” Journal of Statistics and Data Science Education, 31, 18–32. DOI: 10.1080/26939169.2022.2089410.
- Zhang, Y., and Espinoza, S. (1998), “Relationships Among Computer Self-efficacy, Attitudes Toward Computers, and Desirability of Learning Computing Skills,” Journal of Research on Computing in Education, 30, 420–436. DOI: 10.1080/08886504.1998.10782236.
Appendix A:
Questions Asked to Students
Week 0
Do you have any experience in using a computing language for example, Python, Java, C etc. If yes, please specify.
Are you worried/nervous about learning a new computing language. The possible responses are:
No, I am not worried/nervous about learning a new computing language
Yes, I am slightly worried/nervous about learning a new computing language.
Yes, I am very worried/nervous about learning a new computing language.
Biomedical Sciences students only Do you have a Higher Mathematics or equivalent qualification. If yes, please specify.
Week 5
How would you rate your agreement with the following statement: I enjoyed learning R as part of this module. The possible responses are:
strongly disagree
disagree
neither agree nor disagree
agree
strongly agree
How would you rate your anxiety levels around using R for statistical analysis? The possible responses are:
very anxious
anxious
not particularly anxious
not at all anxious
How could the materials be improved to help you gain more confidence/reduce any anxiety around using R? This is an open ended question.
Are there any further comments that you wish to add about the module at this stage? This is an open ended question.
Week 10
How would you rate your agreement with the following statement: I enjoyed learning R as part of this module. The possible responses are:
strongly disagree
disagree
neither agree nor disagree
agree
strongly agree
How would you rate your anxiety levels around using R for statistical analysis? The possible responses are:
very anxious
anxious
not particularly anxious
not at all anxious
Do you have any further comments about your experience learning R so far, or your feelings around continuing to use R in the future?