 ?Mathematical formulae have been encoded as MathML and are displayed in this HTML version using MathJax in order to improve their display. Uncheck the box to turn MathJax off. This feature requires Javascript. Click on a formula to zoom.
ABSTRACT
Dense seismic array monitoring has recently allowed the detailed investigation of sources of ground vibrations and their spatiotemporal dynamics. In a context where traditional monitoring techniques for fluvial processes often do not provide data with adequate temporal and spatial resolution, the use of dense arrays could allow the identification and tracking of different sources of river-induced seismic ground vibrations (e.g. turbulence and bedload transport). Here, we study the potential of dense seismic array monitoring by investigating a high-flow event that occurred in summer 2019 along a 600-m-long braided reach of the Séveraisse River (French Alps). We use a network of 80 seismometers deployed on both river banks, and we supplement the seismic observations with flow gauging measurements and time-lapse imagery. During this event, we observe impulsive signals that are coherently detected over the array, and which we interpret as being associated with the bedload transport of clusters of coarse grains (blocks). Through phase-delay analysis we are able to locate these seismic events on the bend apex of an active branch of the reach. These results demonstrate the capability of such a method to locate bedload activity at high spatiotemporal resolution, providing crucial information for geomorphological investigations and natural risk management.
RESUME
La mise en œuvre de techniques d’analyse par réseaux sismiques denses a récemment permis d'obtenir des dispositifs d'observation uniques pour les processus de surface de la Terre. Malgré leur grand potentiel, ces approches n'ont pas encore été appliquées pour l’étude du fonctionnement des rivières et de leur évolution morphologique. Ici, nous étudions le potentiel de l’instrumentation par réseau sismique dense en analysant les données d'une crue qui s’est produite en été 2019 le long d'un tronçon en tresse de 600 m de la Séveraisse (Alpes françaises). Nous avons installé un réseau de 80 sismométres sur les deux rives de la riviére, et nous complétons ces observations par des mesures de débit liquide et des images time-lapse. Au cours de cet événement, nous observons des signaux impulsionnels qui sont détectés de maniére cohérente à travers le réseau, et que nous interprétons comme étant associés à des clusters de sédiments transportés par charriage. Grâce à l'analyse de différence de phase, nous sommes en mesure de localiser les épisodes de mouvement sur une section de la riviére particuliérement active pendant la crue. Nos travaux démontrent la capacité unique des réseaux sismiques denses à localiser les phénoménes de charriage à haute résolution spatio-temporelle, en fournissant des informations cruciales pour les études géomorphologiques et la gestion des risques naturels.
1. Introduction
Over the last decade, the unique capabilities of seismic techniques in investigating fluvial processes have been demonstrated (Burtin et al., Citation2008, Citation2016). As water turbulence and bedload transport generate seismic ground motions, the non-invasive and continuous detection of river-induced vibrations represents an alternative to traditional monitoring methods. Indeed, a large amount of information about the source of ground motion is embedded in a river-induced seismic signal. The velocity time series of vertical ground motion can be expressed as
where is time,
is the signal amplitude,
the unit imaginary number and the product
is the signal phase, with the angular frequency
. Each of these variables carries different information on the river processes. For instance, the amplitude of the seismic signal has been studied and modelled to obtain the onset of bedload transport and estimation of sediment fluxes (Bakker et al., Citation2020; Burtin et al., Citation2008; Roth et al., Citation2016; Schmandt et al., Citation2013), while phase differences between seismic stations have allowed researchers to estimate the azimuth of in-channel sediment transport, i.e. its direction with respect to the receiver (Burtin et al., Citation2010; Chao et al., Citation2015). However, phase analysis has been shown to have a much greater potential for the identification of seismic sources. In particular, dense networks of seismometers (so-called dense seismic arrays) have been used to investigate the spatiotemporal dynamics of sources such as those associated with englacial fracturing (Gimbert et al., Citation2021), hydrothermal activity (Legaz et al., Citation2009) and geophysical extraction (Corciulo et al., Citation2012), with high temporal and spatial resolution. Since fluvial processes are highly variable in time and space, the use of dense seismic arrays could allow the detection and tracking of different sources of river-induced seismic ground motions (e.g. turbulence and bedload transport).
Here, we study the potential of dense seismic array monitoring to provide insight into river dynamics by analysing data from a field survey conducted in summer 2019 along a 600 m-long braided reach of the Séveraisse River (French Alps), during a high-flow event that occurred at the end of the melt season. In Sections 2 and 3 we present the study area and the methods, respectively. Then, in Section 4, we show the preliminary results of our analysis. Finally, in Section 5 we discuss the capabilities and limitations of such seismic methods for studying fluvial processes.
2. Study area
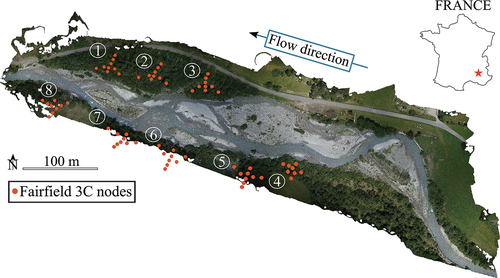
The Séveraisse River is a natural Alpine stream whose catchment is located in the Ecrins Massif, southeast French Alps. This study focuses on a 600 m-long braided reach characterised by a maximum width of 90 m and a mean slope of 1% (). The reach is easily accessible for field observations and is well equipped: water discharge and flow stage measurements are provided at a 10-min resolution through an Électricité de France (EDF) gauging station at a bridge approximately 200 m downstream of the reach, while a camera installed on a rocky outcrop approximately 70 m above the channel covers the area of interest and provides time-lapse imagery.
Figure 1. Orthophoto of the studied braided reach of the Séveraisse River (courtesy of Laurent Borgniet, INRAE; used with permission), including the deployed seismometers. INRAE: Institut National de Recherche pour l’Agriculture, l’alimentation et l’Environnement.
3. Experimental design and methods
The capability to locate seismic events (i.e. the position of the source that generates them) depends on the extent to which they are detectable through the dense seismic array. Impulsive events are relatively straightforward to locate as long as they are well detected across the seismic network deployed around them, but the task is more challenging when events are only locally detectable and/or non-impulsive. Since the latter characteristics may be specific to river-induced ground motions, characterised by a varying nature that also depends on frequency (Gimbert et al., Citation2014), we deployed the seismic array following two main conditions typically used for systematically retrieving the spatial coordinates of seismic sources (Nanni et al., Citation2021):
where is the signal wavelength, defined as the ratio between phase velocity
and signal frequency
,
is the distance between seismometers,
is the maximum array aperture (i.e. the largest distance between seismometers of a subarray) and
is the source-to-array distance. The condition given by EquationEquation (2)
(2)
(2) is necessary to conduct sub-wavelength sampling of the seismic wave-field, which is required to extract coherent information at a small time scale while systematically processing the data. A seismic wave is said to be coherently detected within an array when a clear dominant signal is observed at each station. Ground motions detected over several seismometers can be reliably associated to a certain source only if the seismometer-to-seismometer distance is smaller than the signal wavelength (Nanni et al., Citation2021). The condition given by EquationEquation (3)
(3)
(3) is necessary to obtain the spatial coordinates of the source, which is possible only when the source-to-array distance is small enough relative to the largest distance of seismometers of the array (Almendros et al., Citation1999). Given these needs, we installed a network of 80 seismometers (Fairfield ZLand 3 components nodes), mostly deployed in subarrays (). We meet condition (2) at the subarray scale thanks to a mean distance between seismometers of 5 m, compared to an estimated wavelength varying from 10 to 100 m (with
varying from 200 to 400 m s−1) in the frequency range of interest, while we overcome condition (3) by building several subarrays with
~ 20 m covering the whole area of interest.
The seismometers record ground motions at a sampling frequency of 250 Hz, allowing the assessment of seismic waves up to 125 Hz. However, we apply a 5–20 Hz band-pass filter to the data in order to focus on turbulence and bedload-induced ground motions (Bakker et al., Citation2020), thus removing all non-fluvial sources (e.g. rainfall-induced high-frequency ground vibrations (Roth et al., Citation2016)).
The method consists in measuring the differences in the arrival time (i.e. time delays) between each combination of seismometers of a given impulsive event observed across the array. Then, we build an imaginary grid of points superimposed on the study area, and compute the time delays that would be generated by events located in the points of the grid (where each point is associated to its spatial coordinates (,
)) and associated with a certain phase velocity (
). Finally, we search for the spatial coordinates and phase velocity for which the predicted time delays best match the observed ones. The final result is a spatial map defined as follows:
where is the average mismatch between observed and predicted time delays,
is the number of seismometers,
are the observed time delays between each pair of seismometers and
are the predicted time delays between each pair of seismometers. The
and
coordinates of the minimum of this map corresponds to the most likely location of the event.
4. Results
This study focuses on a high-flow event that occurred at the end of the melt season, on 2 and 3 July 2019, which is characterised by a return period of 2 to 5 years based on the available dataset. The middle section of the reach experienced morphological changes near the left bank during the event ()). Following the steps presented in Section 3, we find that during the flood, impulsive events are detected across the dense array. As an example, shows three seconds of seismic recording for the five subarrays deployed in the middle section of the reach (subarrays 1, 2, 3, 6 and 7 in ). We can observe that two main impulsive events are detected with coherence across all five subarrays, meaning that these ground motions are very likely generated by the same dominant source. Indeed, the time delay between peaks within each subarray is on the order of 0.01 s. Moreover, time delays are visible between seismometers, so that an evaluation of phase coherence is possible for source localisation.
Figure 2. Time recording of ground motion for the five subarrays located in the middle section of the channel. The two main impulsive events are highlighted on each recording.
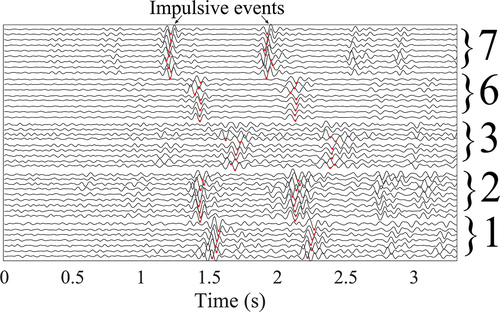
Figure 3. (a, b) Time-lapse images of the braided reach before and after the event. The main morphological changes are highlighted in yellow; the red box indicates the active channel shown in (c). (c) Localisation of the impulsive event on the orthophoto focusing on the area in the red box in (b). It is worth noting that the orthophoto was made two weeks after the flood. The map is derived for a phase velocity of 200 m s−1. (d) Section of the active channel that corresponds to the location of the impulsive event in (c).
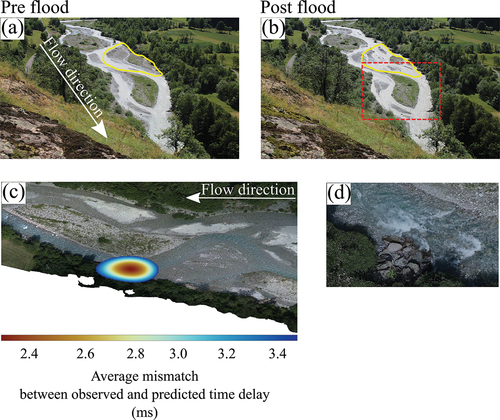
After measuring the existing time delays, and through the grid search, we find the location of the impulsive event ()). The minimum average mismatch between observed and predicted time delays is obtained using a phase velocity , which is consistent with previous active seismic experiments at this field site (Bakker et al., Citation2020).
The minimum mismatch corresponds to the bend apex of an active channel within the reach. This area was almost inactive before the flood ()), with water mainly flowing on the opposite bank, while after the flood the same area shows evidence of a higher water flow (see flooded areas circled in yellow in )). We identified the presence of boulders at the same location ()), and we therefore interpret the investigated impulsive event as being associated with the motion of these boulders as a consequence of high stresses exerted on the bank during the flood.
5. Discussion and conclusions
The physics of flood events and their impact on river landscape are challenging to investigate with traditional monitoring techniques because of the highly dynamic nature of fluvial processes. Braided rivers are particularly challenging as morphological changes occur at various spatial and temporal scales (e.g. Ashmore, Citation1991; Bertoldi et al., Citation2010). In this context, our work demonstrates the unique capability of dense seismic arrays in identifying different sources of river-induced seismic ground vibrations. During the 2–3 July 2019 flood on the Séveraisse River, we are able to locate seismic events on the bend apex of an active branch of the reach, and we interpret them as being associated to the bedload transport of clusters of large grains. Since boulders were placed as bank protection in the same location, our results could indicate either their destabilisation or high sediment transport activity in this channel section. It is worth noting that although this study focuses on a specific seismic event, a high number of impulsive events have been systematically detected during the flood. Therefore, further investigations should allow us to obtain a wide portrait of the river over long time scales. The short-term-average over long-term-average (STA/LTA) method can be used to build a catalogue of events having a certain amplitude (Allen, Citation1978), as used by Gimbert et al. (Citation2021) for events related to englacial fracturing. These preliminary results demonstrate the capability of the method to better understand the fluvial processes that play an important role in storing and transferring sediments in the braided river reach, which provides crucial information for geomorphological investigations and natural risk management.
The use of our approach has several practical advantages compared to traditional monitoring techniques. Seismometers can autonomously monitor river processes for months at a time. Since the seismometers are installed next to the active channel, they cannot be damaged during high-flow events, which can thus be monitored with reliability. For now, this technique does not provide real-time monitoring, since data must be downloaded and analysed after the event, but in the future one could expect technological advances allowing direct transfer and automated analysis. Limitations for the implementation of dense seismic arrays include the following: (i) space is needed for the correct deployment of the seismic network (see Section 3), and (ii) anthropogenic sources of seismic noise might impact the analysis. These limitations are particularly pertinent in populated areas. Moreover, we underline the importance of targeted seismic field observations to identify the frequency band where impulsive events related to bedload dominate over other processes, and to investigate the characteristics of seismic wave propagation (e.g. phase velocity). This can help in defining the most appropriate frequency band for the detection routine and in interpreting the results. However, our study area is well suited for the presented method and particularly well documented, paving the way for a recursive phase-delay analysis that should enable us to trace the spatiotemporal dynamics of sediment transport processes at high resolution.
Acknowledgements
The authors thank Adrien Gilbert and Benoit Urruty for assistance in the field during the installation of the dense seismic array, Sébastien Zanker for providing the water discharge measurements, and Laurent Borgniet for providing the orthophotos used in this study.
Disclosure statement
No potential conflict of interest was reported by the authors.
Data availability statement
The data that support the findings of this study are available from the corresponding author, MP, upon reasonable request.
Additional information
Funding
References
- Allen, R. V. (1978). Automatic earthquake recognition and timing from single traces. Bulletin of the Seismological Society of America, 68(5), 1–6. https://doi.org/10.1785/BSSA0680051521
- Almendros, J., Ibanez, J. M., Alguacil, G., & Del Pezzo, E. (1999). Array analysis using circular-wave-front geometry: An application to locate the nearby seismo-volcanic source. Geophysical Journal International, 136(1), 159–170. https://doi.org/10.1046/j.1365-246X.1999.00699.x
- Ashmore, P. E. (1991). How do gravel-bed rivers braid? Canadian Journal of Earth Sciences, 28(3), 326–341. https://doi.org/10.1139/e91-030
- Bakker, M., Gimbert, F., Geay, T., Misset, C., Zanker, S., & Recking, A. (2020). Field application and validation of a seismic bedload transport model. Journal of Geophysical Research: Earth Surface, 125, e2019JF005416. https://doi.org/10.1029/2019JF005416
- Bertoldi, W., Zanoni, L., & Tubino, M. (2010). Assessment of morphological changes induced by flow and flood pulses in a gravel bed braided river: The Tagliamento River (Italy). Geomorphology, 114(3), 348–360. https://doi.org/10.1016/j.geomorph.2009.07.017
- Burtin, A., Bollinger, L., Vergne, J., Cattin, R., & Nábělek, J. L. (2008). Spectral analysis of seismic noise induced by rivers: A new tool to monitor spatiotemporal changes in stream hydrodynamics. Journal of Geophysical Research, 113(B5), B05301. https://doi.org/10.1029/2007JB005034
- Burtin, A., Hovius, N., & Turowski, J. M. (2016). Seismic monitoring of torrential and fluvial processes. Earth Surface Dynamics, 4(2), 285–307. https://doi.org/10.5194/esurf-4-285-2016
- Burtin, A., Vergne, J., Rivera, L., & Dubernet, P. (2010). Location of river-induced seismic signal from noise correlation functions: Location of river seismic signal. Geophysical Journal International, 182(3), 1161–1173. https://doi.org/10.1111/j.1365-246X.2010.04701.x
- Chao, W.-A., Wu, Y.-M., Zhao, L., Tsai, V. C., & Chen, C.-H. (2015). Seismologically determined bedload flux during the typhoon season. Scientific Reports, 5(1), 8261. https://doi.org/10.1038/srep08261
- Corciulo, M., Roux, P., Campillo, M., Dubucq, D., & Kuperman, W. A. (2012). Multiscale matched-field processing for noise-source localization in exploration geophysics. GEOPHYSICS, 77(5), KS33–KS41. https://doi.org/10.1190/geo2011-0438.1
- Gimbert, F., Nanni, U., Roux, P., Helmstetter, A., Garambois, S., Lecointre, A., Walpersdorf, A., Jourdain, B., Langlais, M., Laarman, O., Lindner, F., Sergeant, A., Vincent, C., & Walter, F. (2021). A multi-physics experiment with a temporary dense seismic array on the Argentière Glacier, French Alps: The RESOLVE project. Seismological Research Letters, 92(2A), 1185–1201. https://doi.org/10.1785/0220200280
- Gimbert, F., Tsai, V. C., & Lamb, M. P. (2014). A physical model for seismic noise generation by turbulent flow in rivers. Journal of Geophysical Research: Earth Surface, 119(10), 2209–2238. https://doi.org/10.1002/2014JF003201
- Legaz, A., Revil, A., Roux, P., Vandemeulebrouck, J., Gouédard, P., Hurst, T., & Bolève, A. (2009). Self-potential and passive seismic monitoring of hydrothermal activity: A case study at Iodine Pool, Waimangu geothermal valley, New Zealand. Journal of Volcanology and Geothermal Research, 179(1–2), 11–18. https://doi.org/10.1016/j.jvolgeores.2008.09.015
- Nanni, U., Gimbert, F., Roux, P., & Lecointre, A. (2021). Observing the subglacial hydrology network and its dynamics with a dense seismic array. Proceedings of the National Academy of Sciences, 118(28), e2023757118. https://doi.org/10.1073/pnas.2023757118
- Roth, D. L., Brodsky, E. E., Finnegan, N. J., Rickenmann, D., Turowski, J. M., & Badoux, A. (2016). Bed load sediment transport inferred from seismic signals near a river. Journal of Geophysical Research: Earth Surface, 121(4), 725–747. https://doi.org/10.1002/2015JF003782
- Schmandt, B., Aster, R. C., Scherler, D., Tsai, V. C., & Karlstrom, K. (2013). Multiple fluvial processes detected by riverside seismic and infrasound monitoring of a controlled flood in the Grand Canyon. Geophysical Research Letters, 40(18), 4858–4863. https://doi.org/10.1002/grl.50953