 ?Mathematical formulae have been encoded as MathML and are displayed in this HTML version using MathJax in order to improve their display. Uncheck the box to turn MathJax off. This feature requires Javascript. Click on a formula to zoom.
ABSTRACT
Precipitation is one of the key input data for hydrological modelling and water resources assessment. Climate projections are regionally available at a finer resolution, but it is still necessary to validate such data against the observations before any application. In this study the precipitation data available from the Coordinated Regional Downscaling Experiment (CORDEX) program of the South Asian domain was examined against APHRODITE (Asian Precipitation – Highly-Resolved Observational Data Integration Towards Evaluation) precipitation, which is used as observations in the absence of in situ measurements for the data-scarce Kabul basin in Afghanistan. The evaluation methods include verification statistics as well as visual verification by mapping the data over the basin. The evaluation results showed that some of the RCMs (Regional Climate Models) are following an entirely different precipitation pattern both temporally and spatially; however, their driving GCMs might be the same. Six of the 17 RCMs examined in this study performed well for the Kabul basin. The ensemble results of these selected RCMs suggest a decreasing trend in the future precipitation under both RCPs (Representative Concentration Pathways), with variations ranging from −14% to +6% under RCP 4.5 and −17% to +8% under RCP 8.5 for most areas, especially in the central parts of the basin.
RÉSUMÉ
Les précipitations sont l’une des principales données d’entrée pour la modélisation hydrologique et l’évaluation des ressources en eau. Les projections climatiques sont disponibles au niveau régional à une résolution plus fine, mais il est toujours nécessaire de valider ces données par rapport aux observations avant toute application. Dans cette étude, les données de précipitations disponibles dans le cadre du programme CORDEX (Coordinated Regional Downscaling Experiment) du domaine de l’Asie du Sud ont été examinées par rapport aux précipitations APHRODITE (Asian Precipitation – Highly-Resolved Observational Data Integration Towards Evaluation), qui sont utilisées comme observations en l’absence de mesures in situ pour le bassin de Kaboul en Afghanistan, où les données sont rares. Les méthodes d’évaluation comprennent des statistiques de vérification ainsi qu’une vérification visuelle en cartographiant les données sur le bassin. Les résultats de l’évaluation ont montré que certains MCR (modéles climatiques régionaux) suivent un schéma de précipitations totalement différent, tant dans le temps que dans l’espace, alors que les MCG qui les pilotent pourraient être les mêmes. Six des 17 MCR examinés dans cette étude ont donné de bons résultats pour le bassin de Kaboul. Les résultats d’ensemble de ces MCR sélectionnés suggèrent une tendance à la baisse des précipitations futures dans le cadre des deux RCP (Representative Concentration Pathways), avec des variations allant de –14 % à +6 % dans le cadre du RCP 4.5 et de –17 % à +8 % dans le cadre du RCP 8.5 pour la plupart des zones, en particulier dans les parties centrales du bassin.
1. Introduction
The estimation of precipitation and its spatial distribution is important for hydrological modelling and water resources assessment. Climate projections are typically available at coarse resolution but the decisions made for water resources management are done at much smaller spatial scales. Therefore, in order to assess management options, downscaling approaches must be applied to better translate climate data for the future for hydrological models (Kour et al., Citation2016). Different methods have been developed for downscaling the climate models including statistical and dynamical approaches (Te Linde et al., Citation2010). The Coordinated Regional Downscaling Experiment (CORDEX) program (Jones et al., Citation2011) aims to provide future projections of climatic variables based on regional climate downscaling techniques over regions worldwide including South Asia (SA), and Afghanistan is well within the domain borders.
The climate models include different assumptions and parameterisations regarding the various physical processes, but in particular, the sub-grid scale processes (e.g. cloud formation and precipitation) are more difficult to simulate (MacKellar et al., Citation2007). While the future projections of temperature, resulting from various climate models, are fairly similar, precipitation projections derived from the same models show divergence especially between summer and winter months (Bachelet et al., Citation2016).
Afghanistan is a semi-arid and mountainous country, which faced three decades of conflict. It is one of the most vulnerable countries in the world to climate change as it has a very limited capacity to address the impacts of climate change. It has been also considered a data-scarce region both temporally and spatially with limited capability to measure hydro-meteorological parameters with in situ gauges.
There are many studies focused on the application of remote sensing to estimate hydroclimatic data and/or biophysical parameters in the absence of ground observations. Akhtar et al. (Citation2021) introduced a methodology that couples remote sensing and the Soil and Water Assessment Tool (SWAT) for assessing the impact of climate change on streamflow of the Kabul basin’s main rivers validated by the data collected from a few properly monitored stations.
Rasouli (Citation2022) did a trend analysis of historical hydrometeorological data and groundwater levels for a period of 60 years from 1957 to 2017 for the Kabul subbasins, aiming to discover the natural causes of climate change. His results suggest a declining trend of groundwater levels with a maximum of 30 m of drawdown between 2005 and 2017.
Irrigation is an essential element of food production in Afghanistan, considering its arid and semi-arid environment. Maharjan et al. (Citation2018) mapped the glaciers in the Hindu Kush Himalaya based on Landsat images and observed a declining trend, including for the glaciers in Afghanistan. These changes in glaciers will result in a reduction in water availability and hydropower potential as well as a change in the seasonality of flows in the region. By assessing the historical data based on ground observations or satellite-based products, the evidence for climate change becomes clear but the uncertainty for the future projections will remain. The availability of several climate models makes it possible to address the model uncertainty by following a multi-model approach, and evaluating these models and ranking their performance for a specific region will help researchers and policymakers to decrease the uncertainty range and to make more reliable future projections. The previous studies in Afghanistan focused on the application of climate models but an evaluation of the performance of those models is lacking.
The current study focuses on the Kabul basin, which includes the capital and several other important cities. The main objective of this study is to evaluate the performance of all available CORDEX South Asia datasets in order to project the precipitation for the Kabul basin under the RCP4.5 (Representative Concentration Pathway) and 8.5 scenarios. The outcome of this study is expected to improve water management decisions, adaptation, and preparation for climate change.
2. Study area and data
2.1. Study area
The Kabul basin () lies in the north-east quarter of Afghanistan. It includes all the Afghan rivers that join the Indus River in Pakistan. The Kabul basin accounts for 35% of the population’s water supply, and has the fastest population growth rate in the country (CSO, Citation2014). Afghanistan’s meteorological stations were established during the 1950s, but when the conflict started in 1979, the recording of data was stopped everywhere except for the Kabul airport, which has long-term data available. The Kabul basin drains an area of around 69,269 km2. The highest elevation in the study area is 7603 m above sea level (masl) in the north-eastern part of the basin and the lowest area is the outlet of the basin to Pakistan with an elevation of 401 masl.
Figure 1. Topographic map of the Kabul basin, Afghanistan, with climate grid used in this study.
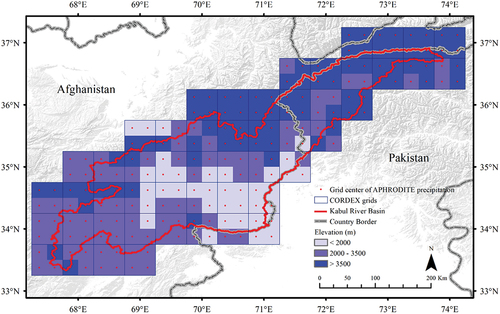
The climate in the Kabul basin is semi-arid and strongly continental; it shows major fluctuations in temperature and precipitation throughout the year. The average annual precipitation for the period 1957–1977 was 330 mm, while the annual average temperature varied between 10 and 13°C (Tunnemeier & Houben, Citation2005). The eastern part of the basin has higher elevations and is covered by snow most of the year. More than two-thirds of the total precipitation of the basin occurs in this area. Because of the variation in elevation, there is also considerable potential to instal hydropower in this part. In contrast, the western part of the basin is dry and faces water shortages, especially during the dry season (Rasooli, Citation2015). The streamflow regime is classified as glacial, dominated by snowmelt. Maximum streamflow occurs in June or July and the minimum occurs during the winter season (November–April) (Wi et al., Citation2014).
2.2. Data description
In this study, two types of data were used: (a) the global APHRODITE (Asian Precipitation – Highly-Resolved Observational Data Integration Towards Evaluation) precipitation dataset, available in the public domain; and (b) regional circulation model (RCM) datasets ().
Table 1. Data used in this study.
3. Methods
3.1. Baseline reference data
In order to use the gridded precipitation products as inputs for hydrological applications, it is necessary to assess the accuracy of these products against the reference dataset. According to Ghulami et al. (Citation2017), the APHRODITE precipitation dataset is more suitable for the Kabul basin, so in the absence of sufficient surface observations, these data were used as a baseline reference to validate the CORDEX SA data.
3.2. Uncertainty analysis
The future period was divided into four time slices – near-term (2020–2039), mid-term1 (2040–2059), mid-term2 (2060–2079) and long-term (2080–2099) – which were then compared with the baseline period of 1986–2005 in order to summarise the results. The inter-model differences of RCMs were considered to represent the uncertainty. The RCMs in this study were evaluated and ranked and only those with high performance were considered to project the future climate.
3.3. Evaluation approach
Model performance is usually evaluated by measuring the ability that a particular model has to reproduce the current climate. This kind of validation does not necessarily guarantee that the selected model is going to generate a reliable prediction of future climate (Reichler & Kim, Citation2008). The present research applied a variety of evaluation techniques, ranging from visual comparison of observations to the application of quantitative performance metrics. In order to assess the performance of the models, averaged monthly patterns and probability density functions (PDFs) calculated from model simulations were compared with the corresponding patterns and PDFs from observations. Standard deviation and correlation (using Taylor diagrams) were also compared to check the performance of each RCM.
In order to compare actual and modelled PDFs, the skill score(s) used by Maxino et al. (Citation2008) can be adopted. This technique provides a simple but useful measure of similarity between two probability density functions. This skill score is a calculation of the common area under the two PDFs analysed. If the model simulates the observed conditions perfectly, the skill score will be 1, which is the total area under a given PDF. In contrast, if a model simulates the observed PDF poorly, it will have a skill score tending to 0, with low overlap between the observed and modelled data. The skill score is formally expressed by means of the following expression:
where s is the numerical value of the skill score, n is the number of intervals used to discretise the PDF estimated by means of the Epanechnikov kernels, Zm is the value of the PDF from the model and Z0 is the value of the PDF from observed data.
3.4. Delta change approach
A linear method (the delta approach) was applied to remove the bias in the selected RCMs’ output compared to the baseline reference data. The linear method is widely used and can be applied to a single predictor–predictand pair (Trzaska & Schnarr, Citation2014). This method computes differences between current and future GCM/RCM (General Circulation Model) simulations and adds these changes to the observed time series. Applying the delta change method assumes that GCMs/RCMs simulate relative changes more reliably than absolute values (Hay et al., Citation2000). In the absence of ground observation to validate the climate model outputs for the historical period, the application of more complicated bias correction methods (e.g. quantile mapping) will not help produce a better estimation of future projections. On the other hand, the advantage of the delta change approach to such methods is to consider the relative changes, and therefore these changes can be applied to the baseline observations any time they become available.
4. Results
4.1. Evaluation of RCMs
presents the Taylor diagram to indicate the normalised standard deviation, root mean square error (RMSE) and correlation coefficient. This diagram is constructed based on the cosine law between those three-centred statistics and provides a concise summary of how well patterns match each other (Taylor, Citation2001). The observation point is indicated with a green square on the bottom line, which is the reference. The azimuthal axis shows the correlation and therefore values closest to 1 are best. The radial distance from the origin is represented by blue dashed lines showing the standard deviation, and again the closer to 1 the better. The radial distance from the origin is represented by green dashed lines showing the root mean square errors, and therefore the lowest distance to the observed point is considered the best.
Figure 2. Taylor diagram for comparison of monthly precipitation in CORDEX SA (Coordinated Regional Downscaling Experiment South Asia) with APHRODITE (Asian Precipitation – Highly-Resolved Observational Data Integration Towards Evaluation) for the baseline period (1986–2005). IDs refer to .
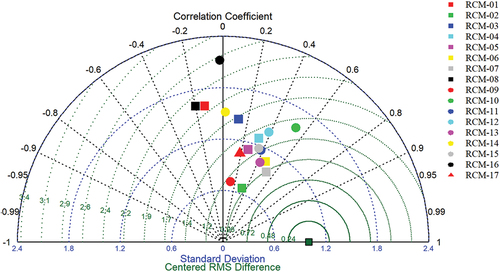
Based on the presented Taylor diagram, RCM-07 (indicated with a grey square) has one of the lowest RMSE values and the highest correlation values. Its standard deviation is also among the closest to the reference point.
shows the statistics summarised for each CORDEX SA RCM compared with the observations. The highlighted values are concluded to show a better performance. To identify the spatial and temporal patterns, illustrate the long-term average of monthly precipitation and the spatial distribution of annual precipitation, respectively.
Figure 3. Long-term average of monthly precipitation in CORDEX SA (Coordinated Regional Downscaling Experiment South Asia) and APHRODITE (Asian Precipitation – Highly-Resolved Observational Data Integration Towards Evaluation) for the baseline period (1986–2005).IDs refer to .
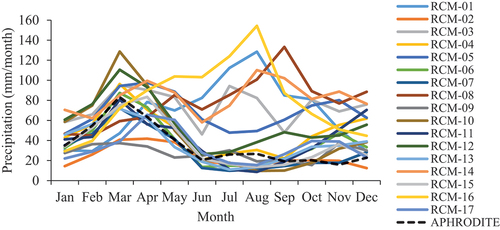
Figure 4. Spatial distribution of annual precipitation in CORDEX SA (Coordinated Regional Downscaling Experiment South Asia) and APHRODITE (Asian Precipitation – Highly-Resolved Observational Data Integration Towards Evaluation) for the baseline period (1986–2005).IDs refer to .
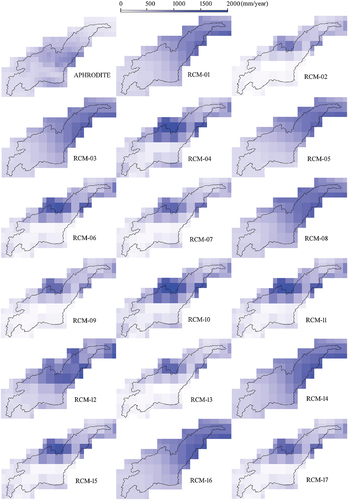
Table 2. Verification statistics of monthly precipitation in CORDEX SA compared with APHRODITE for the baseline period (1986 to 2005).
The results suggest that some of the CORDEX SA RCMs do not follow the trend of observed precipitation both temporally and spatially, particularly those RCMs resulting from IITM (Indian Institute of Technology Madras). The GCM performs monsoon precipitation (May–August) in South Asia, e.g. India and Bangladesh, reasonably well. However, the main precipitation in the Kabul basin occurs during the winter period (November to April). Therefore, considering the verification statistics and mapped values and graphs, the following six RCMs were selected to project the future precipitation: RCM-06, -07, -10, -12, -13 and -15. These RCMs are highlighted in .
4.2. Future projections of precipitation
Monthly precipitation values of the selected CORDEX SA RCMs were extracted and compared with their respective APHRODITE precipitation grids. The values of all grids were then averaged over the Kabul basin for each month. The values were also averaged over the seasons (winter and summer). Winter starts in November and ends in April. Summer is also a period of six months, from May to October. The future period is divided into four time slices – near-term (2020 to 2039), mid-term1 (2040 to 2059), mid-term2 (2060 to 2079), and long-term (2080 to 2099) – compared to the baseline period of 1986 to 2005.
To calculate monthly changes of future periods under RCP scenarios, future values of each RCM were compared with its baseline values for each month and the percentage change was calculated for the whole Kabul basin. These results are presented in .
Table 3. Monthly changes in future precipitation (%) for the Kabul basin using six selected RCMs under 2 RCP scenarios.
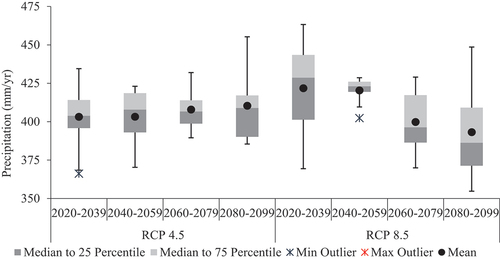
The boxplots in show future projections of precipitation. To calculate the future annual precipitation, the changes were applied to the annual precipitation of the baseline period, which is 428 mm/year. The mean annual values of precipitation under RCP 4.5 range from 403 to 410 mm/year and from 393 to 422 mm/year under RCP 8.5. For both scenarios, the projected precipitation would decrease compared to its counterpart for the baseline period (1986–2005). Projections show a decreasing trend of precipitation over the 21st century under RCP 8.5 while the mean values under RCP 4.5 seem to be uniform. Negative precipitation trends in parts of western Himalaya have been reported by others, such as Kumar and Jain (Citation2010) for Qazigund and Kukarnag stations in the Kashmir Valley.
Figure 5. Future precipitation projections of Kabul basin.
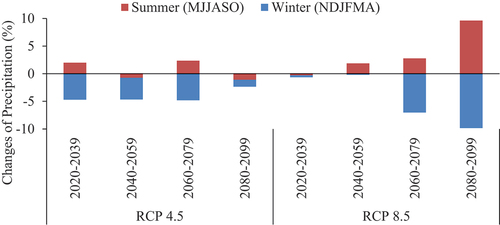
The seasonal changes are one of the key factors that should be incorporated in climate projection studies and such analysis can be found in several research publications (e.g. Helfer et al., Citation2012). The seasonal precipitation values are shown in . The results suggest a decreasing trend in the winter precipitation under both RCPs 4.5 and 8.5 while the summer precipitation in most cases increases.
Figure 6. Average seasonal changes of precipitation from six selected RCMs (Regional Climate Models) over the baseline period (1986–2005).
Previous studies for the HKH (Hindu Kush-Himalayan) region, including the Kabul River basin, suggest increasing precipitation and higher temperatures, which would result in more snow and glacier-melt (Iqbal et al., Citation2018). However, more studies need to be carried out with a focus on changes in the seasonality of precipitation data based on finer resolution climate models. Due to the high diversity of hydro-climatic features over the HKH region, a fundamental change in approach should be considered to move towards the development of meso- to local-scale climate models instead of the regional-scale climate models such as those used in weather research forecasting (Hasson et al., Citation2018).
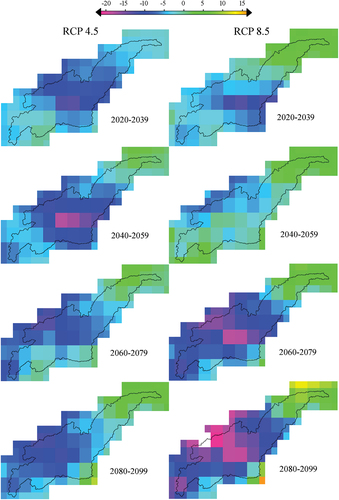
illustrates the spatial distribution of future precipitation changes over the Kabul basin. The results suggest that precipitation is likely to increase in the eastern part while it is projected to decrease for the other parts over the 21st century, especially in the central areas of the basin under the RCP (Representative Concentration Pathway) 8.5 scenario.
Figure 7. Spatial distribution of future projected precipitation changes over the baseline period (1986–2005) in the Kabul basin.
5. Conclusions
The evaluation of monthly precipitation in all available CORDEX SA RCMs showed that several RCMs do not follow the annual cycle of the observed precipitation. A series of evaluation approaches, from visual to quantitative performance metric comparisons between projected and observed precipitations (e.g. pdf, Taylor diagrams), were performed to identify the most suitable RCMs for Kabul basin. The study selected six of 17 RCMs. Hasson et al. (Citation2018) assessed the CORDEX SA RCMs and concluded that despite the continuous development of climate models in recent decades, there is still a consistent low fidelity of climate modelling experiments over the complex terrain of the Himalayan watersheds. They suggested that the high-resolution simulations might even increase the uncertainty rather to the skill of their driving datasets. However, due to a lack of surface observations in the region, it is a challenging task for the climate models to prove their fidelity for historical climate reconstruction (Immerzeel et al., Citation2015).
The six identified RCMs suggest a decreasing trend in the future precipitation under both RCPs, with variations ranging from −14% to +6% under RCP 4.5 and −17% to 8% under RCP 8.5. The future annual values of precipitation range from 366 to 455 mm/year under RCP 4.5 and from 355 to 463 mm/year under RCP 8.5.
The results suggest a decreasing trend in winter precipitation under both RCPs 4.5 and 8.5; the summer precipitation in most cases would increase. The mapping of precipitation changes over the Kabul basin suggests that the precipitation is likely to increase in the eastern part while it is projected to decrease for the other parts, especially in the central areas of the basin.
Acknowledgements
We express our sincere gratitude to the various regional and international agencies for providing the data required for this study. The authors also acknowledge Japan’s National Space Development Agency for providing the APHRODITE precipitation dataset.
Data availability statement
In this study, two different types of data were used: (a) the APHRODITE global precipitation dataset available in the public domain at http://www.chikyu.ac.jp/precip/english/products.html; and (b) regional circulation model (RCM) datasets from the Coordinated Regional Downscaling Experiment (CORDEX) program (see Jones et al., Citation2011) https://cordex.org/data-access/.
Disclosure statement
No potential conflict of interest was reported by the authors.
References
- Akhtar, F., Awan, U. K., Borgemeister, C., & Tischbein, B. (2021). Coupling remote sensing and hydrological model for evaluating the impacts of climate change on streamflow in data-scarce environment. Sustainability, 13(24), 1. https://doi.org/10.3390/su132414025
- Bachelet, D., Ferschweiler, K., Sheehan, T., & Strittholt, J. (2016). Climate change effects on southern California deserts. Journal of Arid Environments, 127, 17–11. https://doi.org/10.1016/j.jaridenv.2015.10.003
- CSO, 2014. Afghanistan central statistics organization statistical yearbook. http://cso.gov.af ( accessed October 2018)
- Ghulami, M., Babel, M., & Shrestha, M. S. (2017). Evaluation of gridded precipitation datasets for the Kabul Basin, Afghanistan. International Journal of Remote Sensing, 38(11), 3317–3332. https://doi.org/10.1080/01431161.2017.1294775
- Hasson, S. U., Böhner, J., & Chishtie, F. (2018). Low fidelity of CORDEX and their driving experiments indicates future climatic uncertainty over Himalayan watersheds of Indus basin. Climate Dynamics, 52, 777–798. doi:10.1007/s00382-018-4160-0
- Hay, L. E., Wilby, R. L., & Leavesley, G. H. (2000). A comparison of delta change and downscaled GCM scenarios for three mounfainous basins in THE United States1. Journal of the American Water Resources Association, 36(2), 387–397. https://doi.org/10.1111/j.1752-1688.2000.tb04276.x
- Helfer, F., Lemckert, C., & Zhang, H. (2012). Impacts of climate change on temperature and evaporation from a large reservoir in Australia. Journal of Hydrology, 475, 365–378. https://doi.org/10.1016/j.jhydrol.2012.10.008
- Immerzeel, W., Wanders, N., Lutz, A., Shea, J., & Bierkens, M. (2015). Reconciling high-altitude precipitation in the upper Indus basin with glacier mass balances and runoff. Hydrology and Earth System Sciences, 19(11), 4673–4687. https://doi.org/10.5194/hess-19-4673-2015
- Iqbal, M., Dahri, Z., Querner, E., Khan, A., & Hofstra, N. (2018). Impact of climate change on flood frequency and intensity in the Kabul River Basin. Geosciences, 8(4), 114. https://doi.org/10.3390/geosciences8040114
- Jones, C., Giorgi, F., & Asrar, G. (2011). The coordinated regional downscaling experiment: CORDEX–an international downscaling link to CMIP5. CLIVAR Exchanges, 16(2), 34–40. https://hero.epa.gov/hero/index.cfm/reference/details/reference_id/1797680
- Kour, R., Patel, N., & Krishna, A. P. (2016). Climate and hydrological models to assess the impact of climate change on hydrological regime: A review. Arabian Journal of Geosciences, 9(9), 1–31. doi:10.1007/s12517-016-2561-0
- Kumar, V., & Jain, S. K. (2010). Trends in seasonal and annual rainfall and rainy days in Kashmir Valley in the Last century. Quaternary International, 212(1), 64–69. https://doi.org/10.1016/j.quaint.2009.08.006
- MacKellar, N. C., Hewitson, B. C., & Tadross, M. A. (2007). Namaqualand’s climate: Recent historical changes and future scenarios. Journal of Arid Environments, 70(4), 604–614. https://doi.org/10.1016/j.jaridenv.2006.03.024
- Maharjan, S. B., Mool, P. K., Lizong, W., Xiao, G., Shrestha, F., Shrestha, R. B., Khanal, N. R., Bajracharya, S. R., Joshi, S., Shahi, S., & Baral, P. (2018). The status of glacial lakes in The Hindu Kush Himalaya. ICIMOD Research Report 2018/1. ICIMOD.
- Maxino, C. C., McAvaney, B. J., Pitman, A. J., & Perkins, S. E. (2008). Ranking the AR4 climate models over the Murray‐Darling Basin using simulated maximum temperature, minimum temperature and precipitation. International Journal of Climatology, 28(8), 1097–1112. https://doi.org/10.1002/joc.1612
- Rasooli, A, and Kang, D. (2015). Assessment of potential dam sites in the Kabul River basin using GIS. International Journal of Advanced Computer Science and Applications, 6(2), 83–89. doi:10.14569/ijacsa.2015.060213
- Rasouli, H. (2022). Climate change impacts on water resource and air pollution in Kabul Sub-basins, Afghanistan. Advances in Geological and Geotechnical Engineering Research, 4(1), 11–27. https://doi.org/10.30564/agger.v4i1.4312
- Reichler, T., & Kim, J. (2008). How well do coupled models simulate today’s climate? Bulletin of the American Meteorological Society, 89(3), 303. https://doi.org/10.1175/BAMS-89-3-303
- Taylor, K. E. (2001). Summarizing multiple aspects of model performance in a single diagram. Journal of Geophysical Research: Atmospheres, 106(D7), 7183–7192. https://doi.org/10.1029/2000JD900719
- Te Linde, A. H., Aerts, J. C. J. H., Bakker, A. M. R., & Kwadijk, J. C. J. (2010). Simulating low-probability peak discharges for the Rhine basin using resampled climate modeling data. Water Resources Research, 46(3), 1–19. https://doi.org/10.1029/2009WR007707
- Trzaska, S., & Schnarr, E. (2014). A review of downscaling methods for climate change projections. United States Agency for International Development by Tetra Tech ARD.
- Tunnemeier, T., & Houben, G. (2005). Hydrogeology of the Kabul river basin, Part 1, Geology, aquifer characteristics, climate and hydrology, (Federal Institute for Geoscinences and Natural Resources (BGR)), 30655.
- Wi, S., Yang, Y. C. E., Steinschneider, S., Khalil, A., & Brown, C. M. (2014). Calibration approaches for distributed hydrologic models using high performance computing: Implication for streamflow projections under climate change. Hydrology and Earth System Sciences Discussions, 11, 10273–10317. doi:10.5194/hessd-11-10273-2014