 ?Mathematical formulae have been encoded as MathML and are displayed in this HTML version using MathJax in order to improve their display. Uncheck the box to turn MathJax off. This feature requires Javascript. Click on a formula to zoom.
ABSTRACT
In the field of water conservancy engineering, a spillway is a common hydraulic structure that plays a role in flood discharge and dam protection. The selection of the weir surface curve and shape scale of the spillway is significant, and the physical shape of the spillway flip bucket is a critical factor affecting the flood discharge and energy dissipation of the spillway. This paper focuses on a hydraulic model study of the Dashijian Reservoir spillway. The physical shape of the spillway was modified several times during the experiments; the results show that the left and right buckets consist of circular arcs with radii of 13.7 m and 10.01 m, respectively, and the middle bucket consists of a circular arc with radius 11.79 m. The flowing water tongue form is good, the energy dissipation effect is good, and the scouring and deposition form of the downstream riverbed is acceptable. The results of the study can be a valuable guideline for the design of the flip bucket shape of the drainage building.
RÉSUMÉ
Dans le domaine du génie de la conservation de l’eau, le déversoir est une structure hydraulique courante qui joue un rôle dans l’évacuation des crues et la protection des barrages. Par conséquent, la sélection de la courbe de la surface du déversoir et l’échelle de forme sont des éléments significatifs, tandis que la forme physique du carneau du déversoir est un facteur critique qui affecte l’évacuation des crues et la dissipation de l’énergie du déversoir. L’article se concentre sur l’étude du modèle hydraulique du déversoir du réservoir Dashijian, et la forme physique du déversoir a été modifiée plusieurs fois au cours des expériences. Les résultats montrent que les seaux gauche et droit sont composés de deux arcs circulaires avec des rayons de 13,7 m et 10,01 m, tandis que le seau central est constitué d’un arc circulaire avec un rayon de 11,79 m. La forme du jet d’eau est bonne, l’effet de dissipation d’énergie est bon et la forme d’érosion et de dépôt du lit de la rivière en aval est acceptable. Les résultats de l’étude peuvent servir de guide précieux pour la conception du carneau formé du bâtiment de drainage.
1. Introduction
China has been engaged in hydropower development activities with high dams and large reservoirs on large rivers in the past decades (Lian et al., Citation2020), such as the Three Gorges Reservoir and Xiaolangdi Reservoir. However, due to the people’s desire for a better life and the need for high-quality development, some small hydropower projects are built on the tributaries of those rivers where the topographic conditions are suitable. These reservoirs mainly meet local needs for drought, irrigation, flood control, and water supply.
Discharge energy dissipation is an important issue facing high-water head discharge buildings, and the performance of a dam’s discharge energy dissipation directly affects its safety, which is highly valued in the construction of large hydro junctions. Nowadays, with the development of small hydropower projects, the discharge energy dissipation anti-scouring problems in small reservoir projects should be of equally concern. There are two methods usually employed to study flow problems in hydraulic engineering: physical models and numerical models (Rajaei et al., Citation2019; Sarwar et al., Citation2020; Zhou et al., Citation2022). Noret et al. (Citation2013) evaluated the energy dissipation pool evolution process of the Kariba dam on the Zambezi River using a physical model and optimised the shape of the energy dissipation pool. Patnaik et al. (Citation2019) conducted a physical model-based optimisation study on the dimensional parameters of the Teesta-IV Dam spillway on the Teesta River. Eghlidi et al. (Citation2020) investigated the influence of energy dissipation pool slopes on downstream riverbed scour using a physical model of the Javeh RCC dam. Oukaili et al. (Citation2021) performed a mathematical model-based optimisation of spillway shape using the particle swarm optimisation algorithm. Erpicum et al. (Citation2012) used both physical and numerical modelling methods to composite model the hydraulic structures of the Raviege dam, successfully addressing the energy dissipation problem of downstream water flow. Such a composite modelling approach can enhance the overall quality and coverage of hydraulic analysis while reducing potential costs. Nevertheless, as most equations for predicting downstream riverbed scour in hydraulic structures are empirical, physical models remain the primary tool for studying the scour conditions downstream of hydraulic structures (Dey & Sarkar, Citation2007).
The flip bucket is an important part of the spillway and is set in the lower section of the drainage building to achieve the energy dissipation of the pick flow (Sá Machado et al., Citation2019). Usually, it has one of five forms – continuous, differential, diffusion, twisting and narrow slit – but due to the respective engineering characteristics of different reservoir projects and with the development and progress of hydraulic building design and construction capabilities, based on the advantages and disadvantages of various buckets, more and more different shapes of flip buckets are being designed and used (Hoseini & Mohammadzadeh-Habili, Citation2022; Zhou et al., Citation2021). The performance of a spillway is significantly influenced by its physical shape, with the flip bucket’s shape playing a crucial role in water dissipation and scouring of the downstream riverbed. To evaluate the design rationality of different spillway shapes, it is necessary to conduct hydraulic model tests (Fen et al., Citation2016). This paper presents a hydraulic model study of the spillway of the Dashijian reservoir project, involving a 1:40 scale three-dimensional (3D) integrated model. The main focus of the study was to optimise the design of the spillway’s physical shape.
1.1. Project background
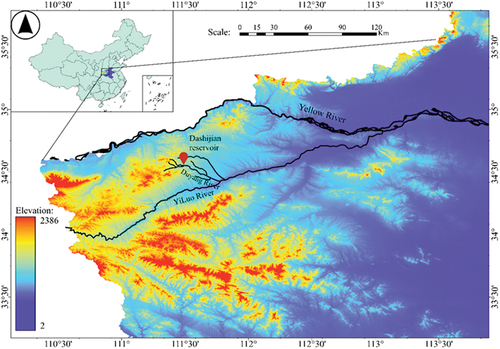
The Dashijian Reservoir Project is a river scheme for agricultural irrigation with flood storage located in Dianzi Township, Shaanxi County, Henan Province, China, in the middle and upper reaches of the Duoyang River, a secondary tributary of the Yellow River (see ). The project proposes to build a crushed concrete gravity dam of 68.9 m in height and 308 m in length at the top of the dam. The dam is composed of a water-retaining dam section on the left and right banks and an overflow dam section in the middle. The overflow dam section has four overflow meter holes with a net width of 37.5 m, no gates at the top of the weir, open free flow, and a side pier at the inlet of the overflow meter hole, which is 1.0 m wide and 6.9 m long, and a guide wall 1 m wide connected to the downstream of the side pier. The flow discharge through the calibrated flood level of 609.3 m is 1986 m3/s. The outlet adopts the pick flow energy dissipation method to pick the water into the downstream channel; the radius of the anti-arc is 15.0 m, the pick angle is 20°, the lowest point of the anti-arc point is 560.595 m, and the elevation of the pick is 561.5 m. The bottom hole of the sand release and the baseflow discharge pipe are located on the left bank of the water retaining dam section. The energy dissipation section is located downstream of the dam site, where the riverbed cover is about 8–10 m, locally up to 12 m, and the impact resistance is poor, for which the energy dissipation and impact prevention are designed according to the 30-year flood discharge of 885 m3/s. The following hydraulic model studies were carried out:
Spillways and flood discharge capacity;
Pressure of the spillway gauge orifice;
Optimisation of the physical shape of the flip bucket;
Morphology of the water tongue of the flip bucket;
Scouring of the river downstream of the dam site.
Figure 1. Project location index diagram.
1.2. Physical model
1.2.1. Model creation
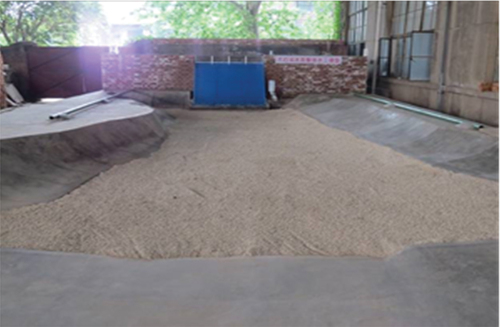
Based on the engineering characteristics of Bashijian Reservoir and the experience of similar projects (Bhate et al., Citation2019; Patnaik et al., Citation2019), a 1:40 scale geometrically similar overall model was established with the 200 m upstream and 680 m downstream river sections of the dam axis as the centre (the layout of the model is shown in ). The model drainage structures are made of Plexiglas for easy observation and modification, the water-retaining dam section is bulit with brick masonry and cement mortar plaster, and the downstream dam surface of the water-retaining dam section is not simulated. According to the calculation, the maximum pick distance of the water tongue is about 72.91 m, and the predicted downstream energy dissipation scour area is concentrated from 80 m below the dam to 250 m below the dam. Thus the riverbed between the end of the surface hole bucket and 0 + 400 m below the dam is simulated according to the dynamic bed, and the rest of the terrain is simulated according to the fixed bed. The left and right bank boundaries are determined according to the topography of the bank slope; the left bank is bounded by the 560 m contour in the model, and the right bank is bounded by the 555 m contour, with appropriate observation platforms on both sides. The fixed bed is built with red brick masonry and cement mortar plaster, the dynamic bed is simulated in layers according to bedrock and overburden, and the model sand is laid in accordance with the broken panel, see .
Figure 2. Model plane layout.
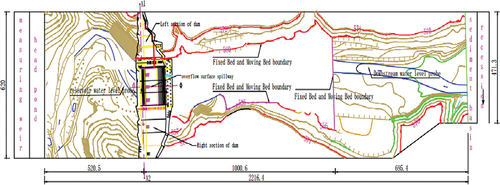
Figure 3. Model on-site layout.
1.2.2. Measurement devices
The flow at the upstream inlet of the model is controlled by a rectangular measuring weir with a width of 60 cm and a height of 65 cm, whose flow is calculated according to the T. Rehbock equation (EquationEquation (1)(1)
(1) ):
where Q is discharge, in m3/s; he = h + 0.0011, where h is the head on the weir, in m; P is the weir height, in m; and B is the weir width, in m.
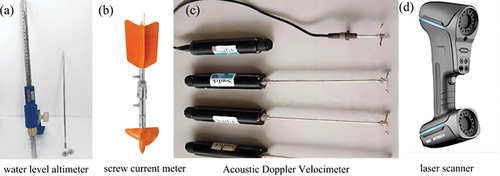
The time-averaged pressure was measured with a pressure measuring tube (glass tube) combined with a steel ruler with an accuracy of 1.0 mm, and the pulsating pressure was measured with the DJ800 acquisition system developed by the China Institute of Water Resources and Hydropower Research. The water level was measured with a water level needle (needle-type water level meter; )), the accuracy of which is 0.1 mm; the model flow velocity was measured with a rotary paddle velocity meter ()) or an acoustic Doppler velocity meter ()) produced by Nortek, Norway; the riverbed silt topography was measured with a handheld three-dimensional laser scanner ()) with accuracy of 0.01 mm; the overflow meter hole discharge. The flow velocity in the chute of the spillway surface orifice was measured by Pitot tube. The measurements from the above instruments were taken as the average of three readings to reduce the reading error, and if the difference between the three readings was too large, the number of readings was increased.
Figure 4. Measurement devices.
2. Original design of the spillway
2.1. Physical model
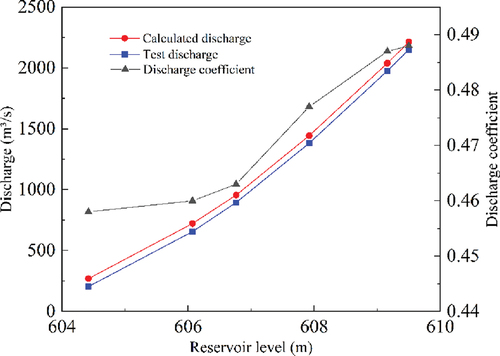
The discharge capacity of the spillway under all spans was investigated considering only the spillway surface hole discharge. At the reservoir level of 609.5 m, the flow discharge through the overflow meter hole is 2046.0 m3/s, which is 3.02% larger than the calculated flow discharge of 1986 m3/s. The measured reservoir level at the overflow meter hole is 609.18 m when the check flood is released, which is 0.12 m lower than the corresponding design value. Therefore, the design discharge capacity of the original scheme of the project meets the requirements and has an appropriate surplus. The Q~H relationship curve of the spillway dam is given in . The discharge coefficient is between 0.48 and 0.488, and gradually increases with the increase of reservoir water level, which conforms to the general rule of weir flow.
Figure 5. Overflow dam open discharge capacity Q~H relationship curve.
2.2. Performance of the spillway
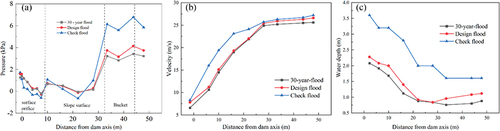
To analyse the rationality of the spillway physical design, we used the model to arrange 15 measurement points along the surface of the surface hole weir, the spillway and the flip bucket: measurement points #1–7 were located in the surface hole section of the spillway, measurement points #8–11 were located in the slope section, and measurement points #12–15 were located in the flip bucket section of the pick flow, and their specific arrangement is shown in . gives the pressure, velocity and water depth along the spillway under three flood scenarios. From ), it can be seen that the pressure along the surface of the weir (points #1–7) decreases during the check flood, design flood and 30-year flood scenario, where the low-pressure area is near points #5–7, the pressure does not change much in the slope section, and the pressure increases steeply when the water enters the flip bucket section (points #12–15). The minimum pressure under the three flood scenarios is −0.64 × 9.8 kPa, −0.28 × 9.8 kPa and −0.20 × 9.8 kPa, respectively, where the check flood scenario occurs in the slope section (measurement point #10) and the design flood and 30-year flood both occur in the overflow surface hole section (measurement point #7). The maximum pressure values of the flip bucket section under the three flood scenarios are 6.78 × 9.8 kPa, 4.14 × 9.8 kPa and 3.42 × 9.8 kPa, respectively, and they all appear at measurement point #14. From ), it can be seen that the flow velocity shows a gradual increase throughout the entire range of the spillway dam, with the inlet velocity being the lowest and reaching the maximum at the end of the flip bucket. In the check flood scenario, the inlet velocity at the pier head is 8.3 m/s, and the maximum velocity at the end of the bucket is 27.2 m/s. In the design flood and 30-year flood scenarios, the velocity at the end of the bucket is 26.6 m/s and 25.6 m/s, respectively, which means that the velocity of the bucket section is relatively large, and the unevenness of the overflow weir surface should be strictly controlled during construction; otherwise, cavitation will easily occur. It can be seen from ) that the water depth at the weir surface decreases along the spillway discharge, and the water depth at the weir surface is shallow. The water depth is highest in the check flood scenario, and the minimum distance of the bottom edge of the traffic bridge from the water surface is 0.9 m. The maximum water depth at the end of the bucket is 1.6 m.
Figure 6. Original design of overflow surface hole and arrangement of pressure measuring points.
Figure 7. The original design of overflow surface hole performances: (a) pressure, (b) velocity, (c) water depth.
2.3. Scouring and deposition topography of downstream riverbed
shows the scouring and deposition topography of the downstream riverbed during the downstream flood of the original scheme. From , it can be seen that during the 30-year flood, the scouring pattern of the downstream river channel is more similar to the design flood, and the lowest scouring elevation is 543.8 m with a scouring depth of 11.2 m due to the small flow rate relative to the design flood scenario. The scouring elevations of the left and right banks are 547.5 m and 545.1 m with a scouring depth of 12.5 m and 9.9 m, respectively, and the lowest scouring elevation of the apron base is 553.4 m with a scouring depth of 1.6 m. The maximum deposition elevation of the downstream riverbed is 557.8 m, which is located at 0 + 200 m below the dam and 40 m to the left of the centre of the channel. It can be seen from ) that during the design flood scenario, the water enters the downstream riverbed after the flip bucket, and a deeper scour pit is formed laterally in the downstream channel between 0 + 100 and 0 + 150 from the dam. Under the influence of backflow on both sides, the left and right bank slopes are scoured deeper and there is a certain amount of deposition on both sides of the apron. The lowest scour elevation in the centre of the riverbed is 542.2 m, and the scour depth is 12.8 m. The scour elevations of the left and right banks are 544.5 m and 543.6 m respectively, and the scour depths are 15.5 m and 11.4 m. The maximum siltation elevation in the downstream channel is 557.7 m, which is located at 0 + 200 m below the dam, and 35 m to the left of the centre of the channel.
Figure 8. Scouring and deposition topography of riverbed downstream of the original scheme.
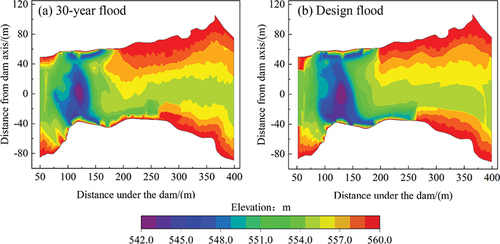
Through the test, it was also found that the overflow surface hole was directly facing the river channel, and the water did not smash both banks. In the design flood scenario, the maximum scouring depth of the downstream riverbed is 12.8 m, which is slightly deeper than the depth of the overburden layer. The degree of water tongue aerial diffusion is small, the waterfall point is too concentrated, and the two banks have different degrees of panning and scouring, which affects the stability of the bank slope. The physical shape of the flip bucket was optimised according to the test situation to reduce or avoid the phenomenon of water scouring both banks.
3. Optimisation design of spillway dam
3.1. Inlet modification
The original plan of the water release test indicated that there was an obvious flow around the head of the left side pier during the check flood scenario, and the water surface near the 0 + 010 m section in the left wall of the spillway was higher and sometimes overflowed the left wall. In the three flood scenarios, the middle three traffic piers downstream of the water flow intersection will form different degrees of water fin. To improve the flow pattern of the inlet of the spillway surface hole, make the inlet flow smooth and reduce the degree of pier head bypass and downstream water finning, the test will be the upstream surface and the side wall with a quarter arc of radius 1.5 m; the traffic bridge upstream and downstream are modified to the left and right sides with a radius of 1.2 m, and the arc of the centre of the circle is at an angle of 45°.
After the modification of the inlet pier physical type, the test observed that the bypass phenomenon of the pier head on the left side of the spillway surface hole was significantly reduced and the inlet flow stability was improved. In the check flood scenario, the water surface near the 0 + 010 m section of the left wall of the spillway still fluctuated, but the highest water surface did not exceed the top of the side wall; the head bypass range of the traffic pier was also reduced, and the water flow downstream after bypassing by the pier did not produce an obvious water fin phenomenon after the downstream intersection. Therefore, after the modification of the inlet physical shape, the problem of unstable inflow into the overflow surface hole has been successfully solved.
3.2. Flip bucket shape modification
Due to the pronounced concentration of water within the overflow surface hole following interaction with the flip bucket, an approach is recommended for more effectively dispersing the water tongue and mitigating downstream riverbed scouring. Drawing from analogous project experiences, a solution is proposed: the utilisation of a differential flip bucket design to partition the water tongue into two distinct layers, with the drop points spatially separated, both upstream and downstream. This configuration serves to augment water tongue diffusion and increase the inflow area, thereby achieving the objective of reducing downstream scour depth. Subsequently, based on the findings from the original scheme model, we executed modifications to six different physical shapes of the flip bucket within the existing 1:40 scale 3D integrated model. shows the modified design and its physical shape parameters.
Figure 9. Modification scheme flip bucket shape and its parameters.
3.2.1. Water tongue shape
After making various modifications to the bucket of the spillway, a hydraulic model was applied to the modified design of the bucket. Since the flood water discharged during reservoir operation is mostly a 30-year flood, and the discharge frequency of the designed flood and the check flood is low, we selected a 30-year flood as a typical representative flood for the test. We observed the shape of the water tongue and the downstream riverbed scouring and deposition for various modified designs. shows the tongue patterns of the four modified schemes under the 30-year flood scenario. As can be seen from , when the water flows through the flip bucket in the modified Alternative I, the outflow is divided into two layers of multiple tongues under the action of the differential bucket, and the drop points of the upper and lower tongues are located between 0 + 100 m and 0 + 115 m below the dam; compared with the original design, the inlet area of this modified alternative scheme has increased twice. However, in our opinion, the two layers of water tongues are still not sufficiently separated in the longitudinal direction, the drop point is concentrated and the energy dissipation is not sufficient.
Figure 10. Different schemes of water tongue shape.
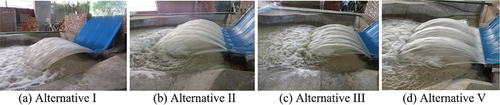
shows the shape of the water tongue for Alternative II. The test observation showed that when the water flows through the bucket, under the action of the differential bucket, the outflow is divided into upper and lower layers of multiple water tongues; the water tongues are laterally diffused and then collide with each other, and the upper and lower layers of the water tongues have the phenomenon of mutual extrusion and mixing. The drop point is located at 0 + 070 m below the dam, which is caused by the increase of the anti-arc radius of the tooth can and the decrease of the picking angle of the tooth slot. Alternative III is modified on the basis of Alternative II, where we keep the radius of the counter-arc unchanged, but widen and enlarge the tooth can, reduce the width of the toothed groove, and increase the pick angle of the toothed groove to 10°. shows the water flow pattern of the modified Alternative III, which is similar to that of Alternative II, except that the spread of the upper water tongue is increased, the water tongue is thinner, and the lower water tongue is located at 0 + 080 m below the dam, which is 10 m higher than that of Alternative II. The water tongue pattern of Alternative IV is similar to that of Alternative III, except that the landing point of the water tongue in the notch is shifted down by 6 m. In Alternative V, we set the bucket in the shape of a tongue flap and reduce the number of buckets to three, i.e. the whole bucket is composed of three large tongue-shaped nosecones plus two gaps, and we arranged the nosecones on the left and right sides symmetrically. When the water flows through, the three nosecones form three independently diffused “light bulb type” water tongues in the air, with a large diffusion range. The water tongues fall evenly before and after the left and right sides, with the farthest fall point between 0 + 120 m~0 + 130 m below the dam, and the water tongues fall between 0 + 090 m~0 + 100 m at the gap. The water tongue at the gap is short and concentrated, but the drop point is far from the apron and can be staggered with the tongue-shaped bucket water tongue drop point. The mainstream is biased towards the right bank, the farthest drop point of the water tongue is relatively close to the centre of the river. The distance from the bank is larger, and the backflow strength of the left and right banks is also weakened, but because the overflow surface hole is arranged close to the right bank of the river, the water tongue drop point is still close to the right bank (). The water tongue form of Alternative VI is similar to that of Alternative V, but the difference is that the tongue becomes thinner and the return flow range on the left and right banks is larger.
3.2.2. Comparisons of downstream riverbed scour
Scour studies are generally qualitative, and to evaluate the scour depths and scour patterns for various scenarios, the riverbed and banks downstream of the spillway were reproduced with homogeneous dolomitic sand with median grain size (d50) of about 4 mm in an existing 3D model with a geometric scale of 1:40. The modelling study found that the downstream channel flow was biased towards the right bank due to the proximity of the spillway surface hole to the right bank. shows the scour patterns of the downstream riverbed of the spillway under the 30-year flood (Q = 885 m3/s) scenario for the six modified schemes.
Figure 11. Downstream riverbed scouring and deposition topography of alternative schemes.
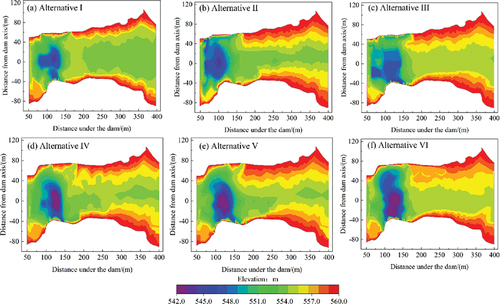
The modified scour test shows that the scour range of the downstream riverbed, the centre of the channel and the location of the lowest scour depth on the left and right banks () are basically the same as in the original scheme, and the depth is slightly reduced compared with the original scheme. The deepest point in the riverbed is 545.2 m, which is 9.8 m deeper than the original riverbed, 1.4 m less than the original scheme, and is located at 0 + 115 m below the dam, and the left and right bank depths are 3 m and 0.8 m higher, respectively, than the original scheme. The deepest point of the riverbed downstream in Alternative II is 545.1 m, which is 9.9 m deeper than the original riverbed and 1.3 m less than the original proposal, and is located at 0 + 100 m below the dam; the deepest point of the left and right bank is raised by 2.9 m and 6.0 m, respectively, compared with the original proposal. The lowest scour elevation at the end of the guard is 544.2 m, which is 9.2 m higher than the original proposal (). This is due to the small pick angle of the lower cantilever and the short pick distance after the water flows through the cantilever, which causes serious scour at the end of the guard, and this phenomenon affects the safety of the dam. The deepest point in the downstream channel in Alternative III is 547.0 m, which is 8 m deeper than the original riverbed, 3.2 m less than the original proposal, and located at 0 + 135 m below the dam. The deepest points on the left and right banks are 547.7 m and 544.6 m, respectively – 3.4 m and 1.7 m higher than the original proposal ()).
Analysing the test results of modified Alternatives I~III, it can be seen that the scour depth in the middle of the riverbed is about 8~10 m, the scour depth on the left bank is 12~15 m, and the scour depth on the right bank is 6~10 m. The geological survey data of the scour area shows that the thickness of the cover layer in the river near the scour area is about 8 m. The slope of the left bank is gentler; the cover layer is larger in scope and the thickness reaches 10~12 m. The slope of the right bank is steeper and the cover layer is only about 2 m. In order to restore the real state of the prototype geological terrain and improve the similarity between the model scour and the prototype, in the scour tests for Alternatives IV to VI, we moved the dynamic bed boundary of the left bank of the energy dissipation zone outward appropriately to expand the dynamic bed range and simulated the dynamic bed model sand of the energy dissipation zone in layers according to the bedrock and overburden. The lower bedrock was simulated using cobbles with median grain size (d50) of 3 cm, and its scour resistance velocity is equivalent to 5 m/s in the prototype; the upper overburden layer is still simulated with dolomitic sand with median grain size (d50) of 4 mm.
The extent and shape of the downstream riverbed scour during the 30-year flood under Alternative IV are shown in ). Compared with Alternative III, the scour at the end of the apron is significantly reduced, but the scour depth at the centre of the riverbed is increased by 1.6 m. The elevation of the deepest point on the left bank is 553.5 m, and the elevation of the deepest point on the right bank is 546.5 m, which is 1.3 m higher than that of Alternative III. The scour extent and morphology of the downstream riverbed during the 30-year flood under Alternative V are shown in ), which indicates that the scour extent and intensity of the left and right banks and the end of the apron are reduced, but the scour depth in the centre of the riverbed is increased by 1.4 m. The deepest points of the left and right banks are raised by 0.6 m and 2.5 m, respectively, compared with Alternative IV, and the lowest scour elevation of the end of the apron is raised by 0.7 m. The scour range and morphology of the downstream riverbed during the discharge of the 30-year flood under Modified Alternative VI are shown in ), where the scour range increases by about 100 m compared with Alternative V and reaches near 0 + 250 m below the dam. The scour characteristic values of the downstream riverbed during the downstream discharge of the 30-year flood for each alternative are shown in .
Table 1. Characteristic values of scouring results for each modification scheme.
In summary, the variation in scour depth at the river’s centre is discernible across the six modification schemes, albeit with relatively minor disparities. Notably, with respect to left and right bank scouring and the end section of the apron, Alternative V outperforms the other alternatives. It exhibits the most limited backflow extent along both banks compared to the other five alternatives, yielding an acceptable degree of bank scouring. Consequently, we recommend the adoption of Alternative V as the preferred flip bucket physical configuration for the Dashijian Reservoir project’s spillway.
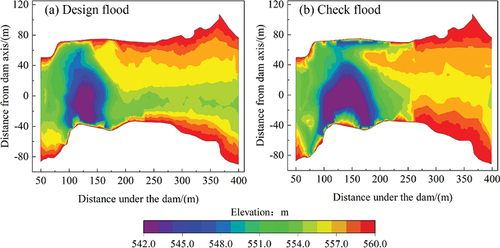
In view of the scour extent and morphology of Alternative V during the down gradient discharge of the 30-year flood, we re-applied the design and check flood after lowering the apron elevation to 554 m. The water surface line of the whole range of the spillway surface is given in , and the scouring range and morphology of the downstream channel during the downstream discharge of the design flood and the check flood scenarios are given in . The scour at the end of the apron is improved to some extent by lowering the elevation of the apron. The scour on both banks of the energy dissipation zone is severe in the check flood scenario, which may cause local bank slope collapse. The mainstream is biased towards the right bank, and it is also recommended to apply appropriate protection measures to the slopes.
Figure 12. Recommended scheme overflow dam water surface line.
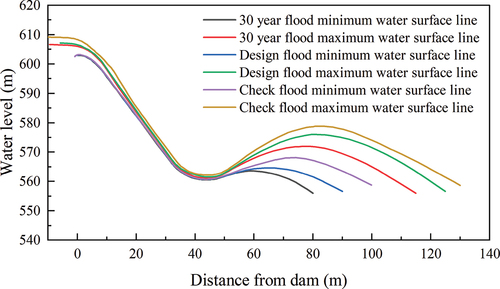
Figure 13. Recommended scheme river scouring and deposition terrain.
4. Conclusions
The hydraulic model study is of great significance to the optimal design of a spillway. The main conclusions obtained from the experiments are as follows:
The overflow capacity of the overflow dam meets the design requirements, the overflow surface hole weir surface pressure distribution is reasonable, the minimum negative pressure value meets the specification requirements, and the physical design is reasonable.
Tests were conducted to compare various physical solutions, including continuous flip bucket, high and low differential flip bucket, long and short differential flip bucket, and tongue flip bucket. The solution ultimately recommended, the tongue flip bucket, exhibits characteristics such as enhanced water–air diffusion within the water tongue and a significant extension of the water drop point. This feature effectively mitigates river channel scouring by the water flow. Additionally, it results in reduced bank backflow intensity and a more limited bank scouring range.
The scouring test shows that with the recommended scheme, the scouring of both banks of the energy dissipation zone is serious during the check flood scenario, which may cause local bank slope collapse, and there is slight scouring on the left side of the end section of the guard, but it will not affect the stability of the dam. In the 30-year flood scenario, the bedrock is exposed after the scouring of the overburden on the left bank of the energy dissipation zone, but the bedrock is not scoured; the scouring depth of the bedrock on the right bank is 3~4 m, which still does not affect the stability of the dam.
Such model studies are critical for improving the optimisation of the performance of the spillway flip bucket, which can solve the water flow morphology and under-dam scouring problems and contribute to the technical and economic design of the spillway.
Acknowledgments
The authors would like to thank the Henan Key Laboratory of Hydrosphere and Basin Water Safety for providing equipment support for measurements. Additionally, the authors extend their thanks to all the participants of the experiment.
Disclosure statement
No potential conflict of interest was reported by the author(s).
Data availability statement
All data used during the study are available from the corresponding author by request ([email protected]).
Additional information
Funding
References
- Bhate, R. R., More, K. T., Bhajantri, M. R., & Bhosekar, V. V. (2019). Hydraulic model studies for optimising the design of two tier spillway – A case study. ISH Journal of Hydraulic Engineering, 25(1), 1–11. https://doi.org/10.1080/09715010.2018.1424567
- Dey, S., & Sarkar, A. (2007). Effect of upward seepage on scour and flow downstream of an Apron due to Submerged Jets. Journal of Hydraulic Engineering, 133(1), 59–69. https://doi.org/10.1061/(ASCE)0733-9429(2007)133:1(59)
- Eghlidi, E., Barani, G.-A., & Qaderi, K. (2020). Laboratory investigation of stilling basin slope effect on bed scour at downstream of stepped spillway: Physical modeling of Javeh RCC Dam. Water Resources Management, 34(1), s. 87–100. https://doi.org/10.1007/s11269-019-02395-5
- Erpicum, S., Dewals, B. J., Archambeau, P., & Pirotton, M. (2012). Composite modeling to enhance hydraulic structures studies. La Houille Blanche, 98(6), 34–40. https://doi.org/10.1051/lhb/2012037
- Fen, N., Kozlov, D. B., & Rumyantsev, I. S. (2016). Hydraulic studies of stepped spillways of various design. Power Technology and Engineering, 49(5), 337–344. https://doi.org/10.1007/s10749-016-0625-7
- Hoseini, A., & Mohammadzadeh-Habili, J. (2022). Investigation of quarter-circular crested spillway using experiments and convex streamline theory. Iranian Journal of Science and Technology, Transactions of Civil Engineering, 46(2), 1491–1501. https://doi.org/10.1007/s40996-021-00695-8
- Lian, J. J., Ran, D. J., He, J. L., & Zhang, Z. C. (2020). Effects of bucket type on flood discharge atomization. Advances in Water Science, 31(2), 260–269. https://doi.org/10.14042/j.cnki.32.1309.2020.02.012
- Noret, C., Girard, J.-C., Munodawafa, M. C., & Mazvidza, D. Z. (2013). Kariba dam on Zambezi river: Stabilizing the natural plunge pool. La Houille Blanche, 99(1), 34–41. https://doi.org/10.1051/lhb/2013006
- Oukaili, F., Bercovitz, Y., Goeury, C., Zaoui, F., Le Coupanec, E. & El Kadi Abderrezzak, K. (2021). Surrogate-based optimization for overflow design. LHB, 107(1), 1–11. https://doi.org/10.1080/27678490.2021.1935003
- Patnaik, S., Kulhare, A., Gadhe, V., Bhajantri, M. R., & Bhosekar, V. V. (2019). Model studies concerning design modifications to improve spillway performance – Teesta-IV Dam spillway, Sikkim. ISH Journal of Hydraulic Engineering. https://doi.org/10.1080/09715010.2018.1473811
- Rajaei, S. H., Khodashenas, S. R., & Esmaili, K. (2019). Comparative evaluation of energy dissipation over short stepped gabion and rigid spillways. Journal of Hydraulic Research. https://doi.org/10.1080/00221686.2019.1572661
- Sá Machado, L., Lima, M. M. C. L., Aleixo, R., & Carvalho, E. (2019). Effect of the ski jump bucket angle on the scour hole downstream of a converging stepped spillway. International Journal of River Basin Management, 1–43. https://doi.org/10.1080/15715124.2019.1586717
- Sarwar, M. K., Ahmad, I., Chaudary, Z. A. & Mughal, H.-U.-R. (2020). Experimental and numerical studies on orifice spillway aerator of Bunji Dam. Journal of the Chinese Institute of Engineers, 43(1), 27–36. https://doi.org/10.1080/02533839.2019.1676652
- Zhou, Y., Shi, Z., Qiu, T., Yu, S., Zhang, Q., & Shen, D. (2022). Experimental study on morphological characteristics of landslide dams in different shaped valleys. Geomorphology, 400, 108081. https://doi.org/10.1016/j.geomorph.2021.108081
- Zhou, Y., Wu, J., Ma, F., & Qian, S. (2021). Experimental investigation of the hydraulic performance of a hydraulic-jump-stepped spillway. KSCE Journal of Civil Engineering, 25(10), 3758–3765. https://doi.org/10.1007/s12205-021-1709-y