
 ?Mathematical formulae have been encoded as MathML and are displayed in this HTML version using MathJax in order to improve their display. Uncheck the box to turn MathJax off. This feature requires Javascript. Click on a formula to zoom.
ABSTRACT
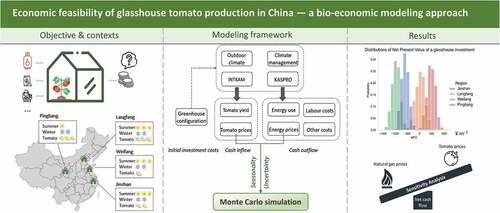
Glasshouse investments are booming in China, even little is known about the economic feasibilities and uncertainties of such investments. This study employed a bio-economic model to assess the economic feasibility and uncertainties of an investment in a Venlo-type glasshouse for cherry tomato production in four regions in China: Jinshan, Langfang, Weifang, and Pingliang, with different climate and market conditions. A bio-physical model for tomato yield and energy use simulation was calibrated with the climate and production data from 2019 to 2020 of a commercial glasshouse in Shanghai, China. The average yield and energy use for each region were simulated with the temperature set points provided by a grower and 30-year climate data. The distributions of the Net Present Values (NPVs) were determined using Monte Carlo simulation which addressed uncertainty due to stochastic seasonal tomato and natural gas prices. The economic outcome of tomato glasshouse investment varies across regions, with a mean NPV ranging from −957.8 ¥ m−2 for Weifang, to 477.0 ¥ m−2 for Pingliang. A sensitivity analysis suggests that variations in natural gas prices have larger impacts on the net cash flow than tomato prices. This study contributes to the research on glasshouse modelling by introducing seasonality and uncertainties of prices in a bio-economic model of a glasshouse farm. The results of this study can inform investors of the economic outcomes and the risks of glasshouse investments. They can also aid Chinese local governments to design agricultural support policies that suit the regional climate and market conditions.
Graphical abstract
1. Introduction
China is shifting from traditional labour-intensive agriculture to modern capital-intensive agriculture. Since 2013, modernizing agriculture has been a top priority for the Chinese government (Ye, Citation2015). One manifestation of agricultural modernization is the development of protected horticulture or greenhouses. Growing crops in a controlled and protected environment reduces the weather dependency of crop production and greatly boosts crop yield (Van Straten & Van Henten, Citation2010).
By 2018, the total area of protected horticulture in China reached 1.89 million ha, 66.6% covered by plastic tunnel greenhouses, 30.5% covered by solar greenhouses. Both types of greenhouses have little or no climate control ability. The area of modern multi-span greenhouses (plastic or glass) was 54,338 ha, only 2.9% of the total protected horticulture area. Only 9000 ha of multi-span greenhouses were covered with glass, accounting for less than 0.25% of the total area of protected horticulture in China (Sun et al., Citation2019). Most of the glasshouses in China are small in size and mainly used for research or demonstration purposes. Large-scale commercial production with a glasshouse is not common, as enterprises are still struggling to make a profit (K. Yang, personal communication, 5 December 2019).
In recent years, the greenhouse sector in China has seen an influx of investment capital (Hairong & Yiyuan, Citation2015; Siekman, Citation2018). From 2016 to 2018, more than 400 ha of glasshouses were built, with a total investment capital of eight billion RMB (Ministry of Agriculture of the People’s Republic of China, Citation2018). A number of high-tech glasshouses have been built with the aid of local governments as demonstrations to promote the modern way of agricultural production in China (Jiang & Yu, Citation2008). Many of these investments took place in the form of public–private partnership. The capital for the initial investments and asset ownership is usually shared by the public (local governments or state-owned enterprises) and private partners, the latter are often responsible for the day-to-day operation and maintenance (Rankin et al., Citation2016). The private investors bear all commercial risks. The driving force of the increasing investment might be the huge market potential of high-end agricultural products in China. Faced with Chinese consumers’ increasing demand for quality agricultural products, shortage of professional farmers, mounting labour costs and declining availability of arable land, the limitations of traditional tunnel or solar greenhouses are more and more obvious (Zhou & Feng, Citation2002). Instead, investments in modern glasshouses are expected to be profitable in the future (Zhou & Feng, Citation2002).
Despite the increasing investment in glasshouses, only a few economic feasibility studies have been conducted for China. The existing glasshouse economic evaluation studies in China (Wang et al., Citation2017; Xue, Citation2017) used relatively simple economic models: they adopted production data of a short timespan from a specific location and used weather data from a particular year, which makes it difficult to generalize results to other regions with different climate conditions. China is a country with very diverse climatic and market conditions. Climate conditions determine the duration of the production cycle. Market conditions determine the costs and the revenue that can be generated from production. To conduct economic feasibility studies that are generalizable, the economic models should be able to accommodate local climate and regional market price data as inputs and generate tailored estimates as model outputs. Modelling glasshouse production essentially involves a complex interplay of multiple biophysical processes between the outdoor climate, energy input, indoor climate, and the realized yield (Van Straten & Van Henten, Citation2010). Simply pursuing a high yield could require an economically sub-optimal energy use. Vice versa, minimizing the energy input regardless of yield would not make optimum use of the superiority of modern glasshouses. Systematic modelling should include the interdependent relationships between climate, energy, the yield of the glasshouse system (Dai & Luo, Citation2006; Van Ploeg & Heuvelink, Citation2005). Seasonality in agricultural products and heating energy prices adds more complexity to the management decisions – is it economical to strive for a high yield, at the expense of high heating costs, when, for example, agricultural products and energy prices are both at their peaks in the winter? In this regard, a glasshouse should not be viewed as a stand-alone biophysical system with static material input and output flows, but a dynamic system that interacts with the external market environment. Just as with many food systems, the challenges associated with the glasshouse system cut across many disciplinary domains and should be addressed in a multidisciplinary or even interdisciplinary manner (Fresco et al., Citation2021). The integration of biophysical and economic models is necessary for the systematic economic evaluation of glasshouses. Examples of such studies can be found in Jones et al. (Citation1990), Vanthoor et al. (Citation2012), and Naseer et al. (Citation2021). One shortcoming of these studies lies in the use of deterministic prices in the assessment of the economic feasibility. Prices of inputs and outputs are stochastic by naturein particular, those of agricultural products and energy. The result calculated using deterministic prices is only a “snapshot” of one of the economic outcomes out of many possible market conditions. Including stochastic prices in the evaluation can provide a more complete understanding of the economic prospects of glasshouse investment (Gebrezgabher et al., Citation2012; Platon & Constantinescu, Citation2014).
This study aims to analyse the economic feasibility of investing in a 1.4-hectare Venlo-type glasshouse for cherry tomato production in four regions in China with different climate characteristics: Jinshan (Shanghai, East China), Langfang (Hebei, North China), Weifang (Shandong, East China), and Pingliang (Gansu, Northwest China). By combining a biophysical simulation model with an economic model, this study analyses the economic feasibility of a glasshouse investment under different climate and market conditions. By further exploring the economic outcomes under different temperature management strategies, this study reveals the dependencies between outdoor climate, temperature management strategies, energy use, indoor climate, yield, and ultimately, the profitability of the glasshouse. This study contributes to the literature on bio-economic modelling of glasshouse by introducing seasonality and uncertainties of prices in an integrated biophysical-economic model of a glasshouse farm. The results of this study can inform agricultural investors in China of the economic outcomes and the risks of glasshouse investments and can aid growers to formulate temperature management strategies. They can also aid Chinese local governments to design agricultural support policies that suit the regional climate and market conditions.
The remainder of this paper proceeds as follows: Sections 2 describes the methods and modelling framework. This is followed by the presentation of the data on glasshouse configuration, yield, and energy use simulations, and especially the sampling strategies of stochastic prices, in section 3. Section 4 presents the results of the model, the sensitivity analysis, and the break-even tomato and heating energy prices in the four regions. The paper ends with Discussion and Conclusions.
2. Methods and modelling framework
presents a schematic description of the modelling framework used in this paper. The modelling framework consists of two parts: the biophysical model of tomato yield and energy consumption and the economic model (combined with Monte Carlo simulation) in which seasonal stochastic prices of tomato and heating energy were plugged in for the cash inflow and outflow simulation. A clear definition of the glasshouse configuration in terms of construction and installation details is needed for the biophysical model and the estimation of the initial investment costs.
Figure 1. Schematic description of the modelling framework
The broadly validated crop model INTKAM (Marcelis et al., Citation2009) and the greenhouse climate model KASPRO (De Zwart, Citation1996) were employed to simulate tomato yield and energy use for each region. The model inputs for the INTKAM-KASPRO model are hourly outdoor climate characteristics (solar radiation, temperature, sky temperature, humidity, wind speed), glasshouse configuration and climate management strategy (heating, ventilation, screen closure), and crop management strategies (e.g. stem density, fruit pruning, topping date). Production data from 2019 to 2020 of a glasshouse in Jinshan, Shanghai, were used for model calibration (there was no calibration for the other three regions due to the lack of production data). The calibration results (see Appendix A) showed that the INTKAM-KASPRO model can give realistic predictions for the Shanghai climate, which lends credibility to the generalizability of the INKKAM-KASPRO model in the other three regions.
The model outputs of the economic model are the distributions of annual net cash flow and the Net Present Value (NPV) of the tomato glasshouse investment. NPV is a widely used criterion to evaluate investment opportunities. The NPV takes the time value of money into consideration by discounting the cash flows generated in the future. The net cash flow of year (
) of a tomato glasshouse is given by:
where is the initial investment costs,
is the discount rate, and
is the lifetime of investment.
Based on the NPV criterion, an investment is considered economically feasible if the NPV is positive. However, glasshouse production is subject to input and output price uncertainties, leading to fluctuating cash flows. To account for the uncertainties in the glasshouse investment’s financial outcome, Monte Carlo simulation was employed to calculate the stochastic cashflows and NPV.
In the Monte Carlo simulation, tomato and energy prices were modelled as stochastic variables on a monthly basis. Tomato prices directly determine the cash inflow of glasshouse production, whereas energy prices have a large impact on cash outflow as the heating costs typically account for more than 40% of production costs in China (J.M, Costa et al., Citation2004; Shen et al., Citation2018). Monte Carlo simulation consists of multiple iterations, where each iteration uses a draw from the distribution of the monthly tomato and energy prices according to the corresponding sampling strategy (see, Section 3.4). The sampled variables of each iteration represent the possible combinations of tomato and energy prices that could occur. The NPV over the project’s lifetime was calculated for each iteration. The NPV outcomes of all iterations together make up the distribution of NPV and can be used to determine the probability of a positive NPV.
3. Data
3.1. Initial investment costs and discount rate
The same glasshouse configuration and equipment was assumed for all four regions in China. The initial investment costs for a 1.4-hectare Venlo-type glasshouse was estimated to be ¥16.66 million (€2.22 million; ) The typical lifetime of a Venlo-type glasshouse is 20 years. A salvage value of zero was assumed at the end of the investment. The local government plays an important role in loan guarantee (Xiong et al., Citation2020). It was assumed that 50% of the initial investment is financed by a loan with an interest rate of 5.5%. A discount rate of 6.10% was then computed using the weighted average cost of capital method (see Appendix B).
Table 1. Initial investment costs for a 1.4-hectare Venlo-type glasshouse.
3.2. Regional climate and production schedules
Hourly climate data (solar radiation, temperature, sky temperature, relative humidity, and wind speed) for each region during 1990 and 2020 was obtained from the ERA5 dataset, produced by the European Centre for Medium-Range Weather Forecasts (Hersbach et al., Citation2018). Langfang and Weifang have similar climate characteristics: abundant solar radiation, hot summer, and cold winter. Pingliang’s advantage lies in its abundant solar radiation in the winter and cool temperature in the summer. Jinshan has mild winter, which implies lower heating demands, while it also has hot and humid summers, which significantly limits the production duration in that region. The transplant date and harvest end dates of each region were provided by a grower based on his experiences (Y. Xie, personal communication, 6 February 2022). The market prices of tomatoes are the lowest in the summer due to the abundant supply of field-grown tomatoes. Moreover, the high temperature and humidity in the summer limit tomato growth and is likely to induce diseases. These market and climate factors combined make summer production in Langfang, Weifang, and particularly in Jinshan, not economically feasible. The cool summer in Pingliang enables year-round production there. The starting date of the glasshouse heating was defined as the date when the outdoor temperature goes stably below 12°C, that is, the temperature at which tomato plants suffer physiological injury (J. Miguel Costa & Heuvelink, Citation2018). The glasshouse heating end date was set as the date when outdoor temperature reaches 15°C. The detailed climate characteristics, cropping and heating schedules of the four regions can be found in Appendix C.
3.3. Gas use and yield simulation under different temperature management strategies
Climate data from 1990 to 2020 were used as inputs in the INTKAM-KASPRO model to simulate fruit yield and energy use. With 30 years of climate data, 30 runs of simulation were performed for each location. For each year of simulation, the inputs were hourly solar radiation, temperature, relative humidity, and wind speed. The yield and energy output of the year were aggregated into monthly values in further data processing. presents the mean annual yield (assuming a 5% loss rate) and mean annual gas use at different heating temperature setpoints for the four locations of the 30 runs of simulation. The standard deviations of the annual yield and natural gas use were around 0.4 kg m−2 and 1.1 m3 m−2, respectively, and differ slightly between locations. The indoor temperature is controlled by heating temperature setpoints, which are predetermined by growers based on their experiences. The reference setpoints were based on a commercial tomato glasshouse in Jinshan for the production cycle Oct 2019 to June 2020. The reference temperature setpoints were kept around 17~18°C at daytime, and 14°C or lower at night-time. In our simulations, the adjustment in temperature management was controlled by a temperature shift parameter. A temperature shift of −1 means to reduce the set points on all dates by 1°C. Accordingly, the realized indoor temperature will also decrease by approximately 1°C.
Table 2. Simulated mean tomato yield and gas use under different temperature management strategies for four regions.
Jinshan has the lowest gas use, but also the lowest yield, presumably due to the short harvest period there. Langfang and Weifang have similar yield and energy use levels, given their similar climatic characteristics. Nevertheless, the production conditions in Weifang are slightly superior to those in Langfang, that is, a higher yield can be expected with lower gas use in Weifang than in Langfang. The annual yield in Pingliang is substantially higher than in other regions, given the fact that the production period is 7 weeks longer than in Langfang and Weifang, and 10 weeks longer than in Jinshan. The simulated gas used in Pingliang is the second lowest of all regions. The low gas use in Pingliang can be explained by the cropping schedule: transplanting starts on 15 December, which means heating is only needed for half of December, one of the coldest months of the year.
Although the impacts of temperature on yield and energy use are not linear, our simulations show that a 1°C reduction in heating setpoints (compared to the reference level) leads to a decrease in yield by around 0.5 kg m−2 in Jinshan, Langfang, Weifang, and by 0.8 kg m−2 in Pingliang. It also leads to gas savings of 2.4 m3 m−2 per year in all four regions.
3.4. Parameters for stochastic price simulation
Monte Carlo simulation incorporates the information from stochastic variables to reflect the inherent risk of the investment. Tomato and energy prices were modelled as stochastic variables in the economic model, considering their large impact on the net cash flow. The biggest cost component for glasshouses in China is heating costs, taking up around 40–60% of the total production costs, depending on the region (Zhang, Citation2003). Tomato prices directly determine the revenue of the glasshouse. A commonly observed pattern in agricultural product prices is seasonality (Tomek & Kaiser, Citation2017). The structural seasonal pattern in tomato prices is even more obvious because of the perishability of tomatoes. Overall, the tomato prices are lowest in the summer and highest in early spring. Therefore, we model the prices of cherry tomatoes on a monthly basis. Using geometric Brownian Motion (GBM), monthly tomato prices can be described as:
where represents the tomato price of month
in year
;
is the drift rate; and
is the drift rate of month
, reflecting the expected price trend compared with the same month of the previous year.
is the volatility rate, it captures price variation.
is a random variable that follows the standard normal distribution. More specifically, for
,
follows the lognormal distribution with parameters
and
.
The drift rate can be seen as a periodic overall inflation rate (Van den Boomen et al., Citation2022). Though the price series of tomatoes from 2011 to 2021 showed an upward trend, input prices (e.g. land rent, fertilizer, wage) also increased accordingly. There was no valid underpinning to assume a positive drift rate, therefore was set as 0.
was estimated in the same manner as in Carey & Zilberman (Citation2002). Tomato prices were assumed to remain in the interval [2/3
,4/3
] with 95% probability in the next 20 years. This interval was chosen based on the observations of cherry tomato price series from 2011 to 2021. Given that the changes in
are normally distributed in GBM, the 95% confidence interval is given by
, this derives a volatility rate of 0.046. The same drift and volatility rates were assumed for the four regions.
Monthly wholesale cherry tomato prices of 2021 of each region were obtained from the National commercial information platform of agricultural products (nc.mofcom.gov.cn). The price data were aggregated from multiple wholesale markets in the region and did not differentiate variety and quality differences between field and glasshouse-grown tomatoes. Compared to field-grown tomatoes, glasshouse-produced tomatoes are marketed as high-end agri-products and can get higher prices for its better quality and brand recognition (Wang, Citation2020; Zhang et al., Citation2010). Therefore, a price premium of 50% was added to the aggregated wholesale tomato prices for 2021 to represent glasshouse tomato prices as the starting points () for price simulation (see, ). Overall, Langfang, Pingliang can expect relatively high prices for cherry tomatoes. The price of cherry tomatoes in Weifang is lower compared to other regions. The tomato price in Weifang is probably limited by the supply–demand relationship, as Shandong (where Weifang belongs to) is the largest vegetable production province in China (J.M. Costa et al., Citation2004).
Table 3. Monthly cherry tomato wholesale prices (¥ kg−1) for 2021.
Common heating energy sources are pipeline natural gas and liquid natural gas (LNG); the use of coal is restricted by law as of 2017. Our study assumes LNG as the heating energy source in all four regions. LNG ex-factory prices, reflecting the average price at LNG liquefaction plants and LNG receiving stations, were obtained for each region and for 2016 to 2021 from Shanghai Petroleum and Natural Gas Exchange (SHPGX). The LNG end-user price was estimated by adding a 40% margin to the ex-factory prices. The monthly producer price data were fitted against triangular distributions using the R package fitdistplus (Delignette-Muller & Dutang, Citation2015). Six distributions of LNG prices for all heating months were obtained, and the parameters are shown in . At each iteration of the Monte Carlo simulation, monthly natural gas prices were drawn from the fitted triangular distributions to estimate the stochastic heating costs. The natural gas prices were modelled as triangular distributions rather than geometric Brownian Motions because the trend in natural gas price is not stable over time and is difficult to predict. GMB requires a constant drift rate to reflect the stable trend in prices, while the natural gas prices in China from 2016 to 2021 fluctuated heavily. Thus, there was no reason to assign a constant drift rate to natural gas prices using GMB, as we did for tomato prices.
Table 4. Parameters (min, mode, max) for natural gas prices (¥ m−3) simulation using triangular distributions.
3.5. Other production costs
Other production costs include labour, electricity, water, fertilizer, crop protection material, and maintenance costs. Labour hours, water use, fertilizer, pesticides, and other material costs were taken from data of a commercial glasshouse in Jinshan. Electricity use was an output of the KASPRO model. Labour was comprised of harvest labour that depends on tomato yield, and non-harvest labour. The latter was assumed to be the same across regions; harvest labour differs based on the yields of each region. Costs of seedlings, rockwool, fertilizers, pesticides, water, electricity, and other small items, such as tomato hooks, yellow sticky traps or gloves were assumed to be the same for all regions, on the premise that the same crop management strategy was applied in the biophysical model simulation. An overview of parameters related to other production costs can be found in appendix D. Information on wage and land rent of each region was obtained from the National Agricultural Products Cost-benefit Data Compilation (Citation2020).
4. Simulation results
4.1. Economic performance simulation under different temperature management strategies
shows Monte Carlo simulations on the net cash flow and NPV of tomato glasshouse for four regions under different temperature management strategies. The simulation consists of 1000 iterations, and the table shows the mean, 5th, and 95th percentiles of the economic indicators.
Table 5. Simulated net cash flow and NPV of tomato glasshouse under different temperature management strategies for four regions.
Simulations indicate that the economic feasibility of a one-hectare tomato greenhouse investment varies across regions. In Pingliang, one could expect on average a net cash flow of 143.3 ¥ m−2 per year. The mean NPV is 477.0 ¥ m−2 with a 90% confidence interval ranging from 182.0 to 749.3 ¥ m−2. A one-hectare tomato glasshouse in Langfang has an average annual net cash flow of 102.0 ¥ m−2 and a mean NPV of 29.4 ¥ m−2 with a 90% confidence interval ranging from minus 301.2 to 347.8 ¥ m−2. The probability of a positive NPV of a tomato glasshouse investment in Langfang is 56.8%. The results show that Jinshan and Weifang have an average annual net cash flow of 48.9 ¥ m−2 and 17.1 ¥ m−2, respectively, with the average NPV of −593.7 ¥ m−2 in Jinshan and −957.8 ¥ m−2 in Weifang. The net cash flows obtained in Jinshan and Weifang are impossible to cover the high upfront investment costs of glasshouse construction and installation, as even the 95th percentiles are negative in Jinshan and Pingliang. The major barrier in Jinshan is the short production period caused by its unfavourable local climate, which was reflected in the low simulated yield. Weifang has similar yield and gas use as Langfang, but more grim economic outcomes, due to low tomato prices.
4.2. Sensitivity analysis
A sensitivity analysis helped to determine which factors have a major impact on the net cash flow of a tomato glasshouse. A regression-based sensitivity analysis procedure was applied by regressing the ranked net cash flow against the ranked monthly tomato and natural gas prices. The results of the sensitivity analysis was given in . The larger the regression coefficient, the more closely the variation in the price variable is associated with the net cash flow. Overall, the impact of natural gas prices variation on the net cash flow was higher than tomato prices. For Jinshan and Langfang, tomato prices from May and June have large impacts on the net cash flow. For Weifang, tomato prices from March to May and December have the largest impacts on net cash flow. In Pingliang, the most influential months for tomato prices are April, November, July and August. Not surprisingly, the cold months, December, January and February are when natural gas prices have the largest impact on net cash flow for all regions.
Table 6. Standardized regression coefficients between the ranked net cash flow and the ranked tomato and natural gas prices.
4.3. Scenario analysis
Producers have no control over tomato and gas prices, while these two factors significantly affect both revenue and heating costs. A scenario analysis was conducted to analyse what the tomato and natural gas prices should be in order to make the investment break even (mean NPV = 0). Local governments in China usually provide substantial subsidies to support glasshouse investments. The subsidy policies vary from province to province. In the scenario analysis, both scenarios with (50% of the initial investment cost) and without subsidy were assessed. The baseline scenario was the economic outcome under the grower reference temperature setpoints. The scenario analysis of Pingliang is presented here (). Detailed results for other regions are in Appendix E.
Figure 2. Mean NPV of a 1.4-hectare tomato glasshouse under different tomato and gas price changes for Pingliang, without and with 50% subsidy on the initial investment costs
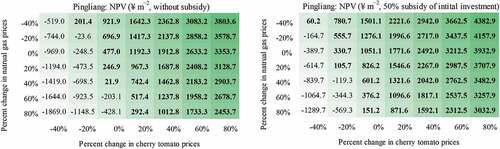
Pingliang is the region with the most optimistic economic outcome among the four regions. Without subsidy, the break-even tomato prices are 86.9% of the current tomato prices, given the current natural gas prices unchanged. With a subsidy of 50% of the initial investment costs, even if the tomato prices decrease by 29.2%, glasshouse investment in Pingliang can still break-even. Given the current tomato prices, the investment can tolerate an increase in natural gas prices by 41.9%. When a subsidy of 50% of the initial investment costs is available, glasshouse in Pingliang can still make a positive NPV even if the natural gas prices increase by 93.4%.
5. Discussion
The objective of this study was to analyse the economic feasibility and uncertainties of a Venlo-type glasshouse for tomato production in China, under different climatic and market conditions. This interdisciplinary study combined methodologies from different disciplines, such as greenhouse engineering, crop management, and economics and explored the dependencies between outdoor climate, management decisions on greenhouse climate, yield, and economic feasibility of a glasshouse production system for tomatoes in China. The results show that the economic outcome of a tomato glasshouse varies across regions, with a mean NPV ranging from for −957.8 ¥ m−2 Weifang, to 477.0 ¥ m−2 for Pingliang. The 5th and 95th percentiles of NPV of a tomato glasshouse investment in Pingliang are 182.0 and 749.3 ¥ m−2, respectively. Such investment is unlikely to be profitable in Jinshan and Weifang. The probability of a positive NPV of a tomato glasshouse investment in Langfang is 56.8%. We also simulated the economic outcomes of tomato glasshouse under different temperature setpoints for each region. The highest mean NPVs in Langfang and Pingliang were obtained at the grower’s reference setpoints. In Jinshan and Weifang, higher NPV can be obtained by decreasing the reference set points by 2°C, at the expense of some yield reduction. A sensitivity analysis was conducted to evaluate the risks associated with the tomato and natural gas prices. The break-even tomato and natural gas prices for each region were calculated with a scenario analysis.
The reasons why glasshouse investments in Jinshan and Weifang are unprofitable are multifold: first, the short production cycle limits yield levels. In Jinshan, the production duration is only 39 weeks, in contrast to the Netherlands where 50 weeks of production is possible. The annual yield of cherry tomatoes in the Netherlands is around 30.7 kg m−2, while the yield in Jinshan is only 18.01 kg m−2. Second, cherry tomato prices in China are relatively low (1.2 to 3.2 € kg−1), compared to, for example, the Netherlands (1.63 to 5.77 € kg−1; Raaphorst et al., Citation2019). Meanwhile, natural gas prices in China are relatively high (0.5 to 0.7 € m−3). In the Netherlands, the natural gas price is around 0.24 € m−3 (Raaphorst et al., Citation2019) and in Norway 0.43 € m−3 (Naseer et al., Citation2022). The negative impacts of high natural gas price are not only reflected in the high heating costs, but also in the low yield levels in China. Being able to operate throughout the year, Pingliang’s simulated yield was around 25 kg m−2, nearly 6 kg m−2 lower than the yield in the Netherlands. The low yield can be partly explained by the low-temperature set points set by Chinese growers for saving heating costs.
The sensitivity analysis suggests that both tomato and natural gas prices play decisive roles in the profitability of glasshouse investment. In China, there is a clear trend that commercial glasshouses are spending more resources on branding, seeking to exercise market power and get price premium through brand recognition. By improving quality management and establishing direct contracts with high-end supermarkets or online market access to consumers, glasshouse-produced tomatoes may have a chance to obtain a price premium. The grower could also strategically choose tomato varieties that cater to specific market segments and get a higher revenue. For example, beef tomato can reach a much higher yield compared to cherry tomato, but the price of beef tomato is usually lower. It is thus a strategic decision for the grower to choose the tomato variety that brings the highest return.
The sensitivity analysis also suggests that the impact of natural gas prices was much bigger than that of tomato prices. Natural gas price variations could impose a lot of uncertainties to glasshouse investments. China’s natural gas market greatly depends on import. In recent years, energy prices are mounting and becoming even more volatile. Building long-term contracts with energy suppliers is a way to reduce cost uncertainties. However, energy suppliers tend to only establish contracts with large buyers, but the LNG demand of a 1.4-hectare glasshouse is below 200 tons per year. The use of pipeline gas, which is to some extent regulated by the government and therefore less volatile and slightly cheaper, could decrease the uncertainty about net cash flow. However, the prerequisite is that the glasshouse has connections to pipeline gas. The cost for pipeline construction can be as high as one million RMB per kilometre (K. Yang, personal communication, 21 October 2020). Agricultural infrastructure access is an important success factor for the development of modern agriculture in China.
Some literature on greenhouse temperature optimization followed the principle of energy-efficiency of biomass production (e.g. Luo et al., Citation2005) or simply optimized the daily temperature setpoints based on a given desired average temperature (e.g. Shen et al., Citation2018). Without taking the prices of agricultural products and energy into account, these perspectives do not necessarily lead to the economic optimum results. What investors ultimately care about is the profitability of the glasshouse. In this regard, including outputs and energy prices and follow the profit-maximization principle is a more appropriate guideline for glasshouse temperature optimization. After including fixed tomato and energy prices, Su et al. recommended the temperature setpoints of a Venlo-type tomato glasshouse in Shanghai in the winter to be between 16°C and 20°C (2021). After considering seasonality and uncertainty of tomato and energy prices, our study suggests that better economic outcome can be obtained by lowering the temperature by 2°C compared to the reference set points, which led to an average temperature around 15°C.
Crop and greenhouse climate models have been used extensively as tools to study the dynamics of crop growth and development and the indoor greenhouse climate. Linking such bio-physical models with economic models is a way forward towards more integrated assessments of agricultural systems (Lehmann et al., Citation2013). Without simplifying the dependencies between outdoor climate, energy use, and tomato yield, this paper is the first to systematically assess the economic feasibilities of glasshouse investments in China, to the best of our knowledge. This study provides the distribution of possible economic outcomes, which is helpful for investment risk assessment. By revealing the trade-offs between yield and heating costs, our study appeals to adhere to the principle of profit maximization when formulating glasshouse climate management strategies. This paper is interdisciplinary in nature by integrating knowledge from crop physiologists, greenhouse energy experts, agricultural economists, and glasshouse practitioners.
There are, however, some limitations of this study that need further discussion. First, when exploring different heating temperature setpoints, we assumed that temperature only affects the yield and natural gas use. In fact, temperature also influences tomato quality, such as fruit colour, texture, and size (Dorais et al., Citation2010). The impact of temperature management on fruit quality was not modelled in this study, as this is beyond the scope of our biophysical model.
Second, this study only considered Venlo-type glasshouses, a type of high-tech greenhouses with a complete set of climate control equipment. Although this Venlo-type glasshouse was found to be unprofitable in some regions under the current conditions, other types of greenhouses with different designs and technological levels may be economically viable in China. Future research can compare the economic feasibilities of different types of greenhouses and explore the most economic viable greenhouse design under different climate regions in China. Similar studies have been done for Spain (Vanthoor et al., Citation2012) and Norway (Naseer et al., Citation2021), but have not been done in China. This could be done with our modelling framework, with some modifications on the definition of glasshouse configuration. Another future research direction is to incorporate the yield and energy use uncertainties caused by the variations of the outdoor climate. This study used the mean yield and energy use simulated with 30 historical climate datasets as deterministic values in the calculation. The standard deviations of 30 years simulated yield and natural gas use were around 0.4 kg m−2 and 1.1 m3 m−2, respectively, which could bring some extra uncertainties in the economic outcome of glasshouse investment. Incorporating uncertainties caused by climate variations can enable a more complete view of the uncertainties of glasshouse investment.
This study used historical climate data in the bio-economic simulation to assess the economic feasibility of a future investment. It would be ideal to use climate projections as input for yield and energy use simulation to match the investment decision horizon. The effect of climate change on agricultural production is gaining attention in the literature. A review indicated that the changing temperature, CO2 concentration and precipitation patterns may have positive and negative impacts on different aspects of greenhouse production (Gruda et al., Citation2019). Many impacts of climate change on greenhouse production discussed in the literature were concluded from studies of vegetables grown under adverse climate conditions, and simulation studies on this topic are scarce (Gruda et al., Citation2019). A future research opportunity is to study the influence of climate change on greenhouse production with bio-economic models using future climate projections.
Different climate and crop management strategies can also be studied with this modelling framework. In this paper, we explored the economic outcomes under four different levels of heating temperature setpoints and revealed the trade-offs between yield and heating costs. This is nevertheless a simplified temperature set points optimization procedure. In the future work, climate management and crop management (e.g. pruning, leaf removal) strategies could be optimized simultaneously to reach the profit-maximizing point for different regions in China.
Local governments play an important role in the development of the glasshouse industry in China. In fact, local governments are not only subsidy providers but also joint investors of glasshouse projects. Normally, the government would claim part of the glasshouse’s ownership based on the portion of subsidy they provided. The local government also plays an important role in financing, by helping the private investors to negotiate with banks for favourable loan terms. With a subsidy of 50% of the initial investment costs, the probability of a tomato glasshouse with a positive NPV can increase to 46.4% in Jinshan and 99.9% in Langfang. Currently, the subsidy is often given as a fixed amount paid as a proportion of the initial investment costs, usually paid off within three years after the glasshouse is built. The government could diversify the forms of subsidy. Apart from fixed one-time payments, the government could consider giving annual subsidies on glasshouse production, such as energy price subsidy, to ensure that the glasshouses can produce sustaining cash flows.
For a long time, glasshouse technology R&D has focused on energy-saving heating technologies. This is very relevant in countries with cool summers, for example, the Netherlands. Indeed, heating is a large cost component, but given the climate characteristics in China (hot and humid summer), it seems to be more worthwhile to put more effort into developing energy-efficient cooling and dehumidification technologies to enable glasshouse production throughout the year. With a prolonged production period, the revenue could be substantially increased, as can be seen from the simulation results of Pingliang..
Acknowledgements
We would like to acknowledge Kun Yang and Yuanpei Xie for providing information on the cropping schedules and temperature setpoints of glasshouse tomatoes in China. We would also like to acknowledge Guoyu Wang for sharing the glasshouse tomato production data needed for model calibration.
Disclosure statement
This study is a part of the research project “Big Data Quantification and Modelling for Modern Agriculture in China”, which is financially supported by Lankuaikei Agriculture Development (Shanghai) Co., Ltd. The sponsor did not participate in the study design, the collection, analysis, and interpretation of data, the writing of the manuscript, or any other decisions that could affect the quality and objectivity of this manuscript.
Additional information
Funding
Notes
1. Cherry tomato prices of Jiangsu province were used as proxies for Jinshan cherry tomato prices due to the lack of data.
2. Cherry tomato prices of Jiangsu province were used as proxies for Jinshan cherry tomato prices due to the lack of data.
3. LNG prices of Jiangsu province were used as proxies for Jinshan LNG prices due to the lack of price data for Jinshan.
1 The KASPRO simulation model is based on physical equations that describe the heat and mass fluxes associated with greenhouse plant production. It dynamically simulates the greenhouse temperature, relative humidity, transpiration, etc. and calculates the energy and CO2 uses based on the given greenhouse climate setpoints. The INTKAM model simulates growth and development of greenhouse crops (in our case, tomato). Crop photosynthesis rate is computed at small time steps with a biochemical model on the basis of radiation, CO2, temperature, and relative air humidity. Instantaneous rates are integrated to a daily crop photosynthesis rate. Daily dry matter partitioning and organ growth rates are computed based on the sink strengths of various organs and assimilate availability.
2 The actual harvest in June was 1.563 kg m−2, including green fruits without commercial value. We only took the harvested red fruit weight into account for calibration, as the green fruit were the fruits supposed to be harvested in later stage beyond the simulation period. The Jinshan greenhouse ended the production already on June 3 to avoid high cooling costs and diseases brought by the hot and humid climate in summer.
References
- Carey, J. M., & Zilberman, D. (2002). A model of investment under uncertainty: Modern irrigation technology and emerging markets in water. American Journal of Agricultural Economics, 84(1), 171–183. https://doi.org/10.1111/1467-8276.00251
- Costa, J. M., Heuvelink, E., Botden, N., Carvalho, S. M. P., Körner, O., & van der Ploeg, A. (2004). Greenhouse horticulture in China: Situation & prospects: Report on a study tour 11 October-2 November 2003 (J.M. Costa, E. Heuvelink, & N. Botden (Co-Editor), Eds.). Wageningen: Horticultural Production Chains Group, Department of Plant Sciences, Wageningen University and Research Centre. ISBN: 90-6754-744-1. https://edepot.wur.nl/331170
- Costa, J. M., & Heuvelink, E. (2018). The global tomato industry. E. Heuvelink (Ed.), In Tomatoes (2nd). 1–26. CABI. ISBN: 9781780641935.
- Dai, J., & Luo, W. (2006). A model-based decision support system for temperature set point optimisation for greenhouse heating under subtropical climate conditions. Acta Horticulturae, 718(718), 359–366. https://doi.org/10.17660/ActaHortic.2006.718.41
- De Zwart, H. F. (1996). Analyzing Energy-saving Options in Greenhouse Cultivation Using a Simulation Model [ PhD dissertation, Wageningen University. http://edepot.wur.nl/195238
- Delignette-Muller, M. L., & Dutang, C. (2015). fitdistrplus : An R package for fitting distributions. Journal of Statistical Software, 64(4). https://doi.org/10.18637/jss.v064.i04
- Dorais, M., Papadopoulos, A. P., & Gosselin, A. (2010). Greenhouse tomato fruit quality. In J. Janick (Ed.), Horticultural reviews (pp. 239–319). John Wiley & Sons, Ltd. ISBN: 9780470650806. https://doi.org/10.1002/9780470650806.ch5
- Fresco, L. O., Geerling-Eiff, F., Hoes, A.-C., van Wassenaer, L., Poppe, K. J., & van der Vorst, J. G. A. J. (2021). Sustainable food systems: Do agricultural economists have a role? European Review of Agricultural Economics, 48(4), 694–718. https://doi.org/10.1093/erae/jbab026
- Gebrezgabher, S. A., Meuwissen, M. P. M., & Oude Lansink, A. G. J. M. (2012). Energy-neutral dairy chain in the Netherlands: An economic feasibility analysis. Biomass and Bioenergy, 36, 60–68. https://doi.org/10.1016/j.biombioe.2011.10.006
- Gruda, N., Bisbis, M., & Tanny, J. (2019). Influence of climate change on protected cultivation: Impacts and sustainable adaptation strategies-A review. Journal of Cleaner Production, 225, 481–495.
- Hairong, Y., & Yiyuan, C. (2015). Agrarian capitalization without capitalism? capitalist dynamics from above and below in China. Journal of Agrarian Change, 15, 366–391. https://doi.org/10.1111/joac.12121
- Hersbach, H., Bell, B., Berrisford, P., Biavati, G., Horányi, A., Muñoz Sabater, J., Nicolas, J., Peubey, C., Radu, R., Rozum, I., Schepers, D., Simmons, A., Soci, C., Dee, D., & Thépaut, J.-N. (2018): ERA5 hourly data on single levels from 1959 to present. Copernicus Climate Change Service (C3S) Climate Data Store (CDS). https://doi.org/10.24381/cds.adbb2d47)
- Jiang, W. J., & Yu, H. J. (2008). Present situation and future development for protected horticulture in mainland China. Acta Horticulturae, 770, 29–35. https://doi.org/10.17660/ActaHortic.2008.770.3
- Lehmann, N., Finger, R., Klein, T., Calanca, P., & Walter, A. (2013). Adapting crop management practices to climate change: Modeling optimal solutions at the field scale. Agricultural Systems, 117, 55–65. https://doi.org/10.1016/j.agsy.2012.12.011
- Luo, W., Feije de Zwart, H., DaiI, J., Wang, X., Stanghellini, C., & Bu, C. (2005). Simulation of greenhouse management in the subtropics, part I: Model validation and scenario study for the winter season. Biosystems Engineering, 90(3), 307–318. https://doi.org/10.1016/j.biosystemseng.2004.11.008
- Marcelis, L. F. M., Elings, A., de Visser, P. H. B., & Heuvelink, E. (2009). Simulating growth and development of tomato crop. Acta Horticulturae, 821, 101–110. https://doi.org/10.17660/ActaHortic.2009.821.10
- Naseer, M., Persson, T., Righini, I., Stanghellini, C., Maessen, H., Ruoff, P., & Verheul, M. J. (2022). Bioeconomic evaluation of extended season and year-round tomato production in Norway using supplemental light. Agricultural Systems, 198, 103391. https://doi.org/10.1016/j.agsy.2022.103391
- Naseer, M., Persson, T., Righini, I., Stanghellini, C., Maessen, H., & Verheul, M. J. (2021). Bio-economic evaluation of greenhouse designs for seasonal tomato production in Norway. Biosystems Engineering, 212, 413–430. https://doi.org/10.1016/j.biosystemseng.2021.11.005
- National Development and Reform Commission (Ed.). (2020) . National agricultural products cost-benefit data compilation-2020. China Statistics Press.
- Jones, P., Jones, J. W., & Hwang, Y. (1990). Simulation for determining greenhouse temperature setpoints. Transactions of the ASAE, 33(5), 1722. https://doi.org/10.13031/2013.31532
- Platon, V., & Constantinescu, A. (2014). Monte Carlo method in risk analysis for investment projects. Procedia Economics and Finance, 15(14), 393–400. https://doi.org/10.1016/S2212-5671(14)00463-8
- Raaphorst, M.G., Benninga, J., & Eveleens, B. A. (2019). Quantitative information on Dutch greenhouse horticulture 2019. Report WPR-898 (26th). Wageningen: Wageningen Plant Research, Business Unit Greenhouse Horticulture.
- Rankin, M., Eva Gálvez, N., Santacoloma, P., Mhlanga, N., & Rizzo, C. (2016). Public-Private Partnerships for Agribusiness Development - A review of international experiences. Rome: Food and Agricultural Organization of the United Nations. https://www.fao.org/3/i5699e/i5699e.pdf
- Shen, Y., Wei, R., & Xu, L. (2018). Energy consumption prediction of a greenhouse and optimization of daily average temperature. Energies, 11(1), 65. https://doi.org/10.3390/en11010065
- Sun, J., Gao, H., Tian, J., Wang, J., Du, C., & Guo, S. (2019). Development status and trends of protected horticulture in China. Journal of Nanjing Agricultural University, 42(4), 594–604. https://doi.org/10.7685/jnau.201810027
- Tomek, W. G., & Kaiser, H. M. (2017). 9. Price variation through time. In Agricultural product prices (5th). Cornell University Press. https://doi.org/10.7591/9780801471117-011
- Van den Boomen, M., (Martine), Bakker, H. L. M., (Hans), Schraven, D. F. J., (Daan), & Hertogh, M. J. C. M., (Marcel). (2022). Probabilistic life cycle cash flow forecasting with price uncertainty following a geometric brownian motion. Structure and Infrastructure Engineering, 18(1), 15–29. https://doi.org/10.1080/15732479.2020.1832540
- Van Ploeg, D., & Heuvelink, E. (2005). Influence of sub-optimal temperature on tomato growth and yield: A review. The Journal of Horticultural Science and Biotechnology, 80(6), 652–659. https://doi.org/10.1080/14620316.2005.11511994
- Van Straten, G., & Van Henten, E. J. (2010). Optimal greenhouse cultivation control: Survey and perspectives. IFAC Proceedings Volumes, 43(26), 18–33. https://doi.org/10.3182/20101206-3-JP-3009.00004
- Vanthoor, B. H. E., Stigter, J. D., van Henten, E. J., Stanghellini, C., De Visser, P. H. B., & Hemming, S. (2012). A methodology for model-based greenhouse design: Part 5, greenhouse design optimisation for southern-Spanish and Dutch conditions. Biosystems Engineering, 111(4), 350–368. https://doi.org/10.1016/j.biosystemseng.2012.01.005
- Wang, T., Wu, G., Chen, J., Cui, P., Chen, Z., Yan, Y., Zhang, Y., Li, M., Niu, D., Li, B., & Chen, H. (2017). Integration of solar technology to modern greenhouse in China: Current status, challenges and prospect. Renewable and Sustainable Energy Reviews, 70, 1178–1188. https://doi.org/10.1016/j.rser.2016.12.020
- Wang, M. (2020). The market situation of snack tomato in China. Agricultural Engineering Technology (Greenhouse Horticulture), 40(31), 34–37. https://kns.cnki.net/kcms/detail/detail.aspx?doi=10.16815/j.cnki.11-5436/s.2020.31.006
- Xiong, G., Chai, Y., Cao, Y., & Wang, X. (2020). Influence factors on investment efficiency of the agriculture PPP project based on DEA-Tobit method. In J. Xu, S. E. Ahmed, F. L. Cooke, & G. Duca (Eds.), Proceedings of the thirteenth international conference on management science and engineering management (pp. 30–40). https://doi.org/10.1007/978-3-030-21248-3_3
- Xue, J. (2017). Economic assessment of photovoltaic greenhouses in China. Journal of Renewable and Sustainable Energy, 9(3), 033502. https://doi.org/10.1063/1.4982748
- Ye, J. (2015). Land transfer and the pursuit of agricultural modernization in China. Journal of Agrarian Change, 15(3), 314–337. https://doi.org/10.1111/joac.12117
- Zhang, Y. (2003). Study on Greenhouse Climatic Regionalization and Heating Meteorological Parameters of Multi-Span Greenhouse in China [ PhD dissertation, China Agricultural University]. http://cnki.cgl.org.cn/kcms/detail/detail.aspx?DbCode=CDFD&filename=2003092798.nh
- Zhang, X., Qiu, H., & Huang, Z. (2010). Apple and tomato chains in China and the EU. LEI Wageningen UR (Wageningen Economic Research). https://edepot.wur.nl/142956
- Zhou, C., & Feng, G. (2002). Considerations on the modernization of China facility horticulture from imported greenhouses. Journal of Shenyang Agricultural University, 31 (1), 23–25. http://yuxiqbs.cqvip.com/Qikan/Article/Detail?id=4699795
- Damodaran, A. (2022a). Country default spread and risk premiums. Retrieved on 24th February, 2022. Verified [April, 2022]. https://pages.stern.nyu.edu/~adamodar/pc/datasets/ctryprem.xlsx
- Damodaran, A. (2022b). Levered and unlevered betas by industry - China. Retrieved on 24th February, 2022. Verified [April, 2022]. https://pages.stern.nyu.edu/~adamodar/pc/datasets/totalbetaChina.xls
- The People’s Bank of China., (2022). 5-year loan prime rate. Retrieved on 24th February, 2022. Verified [April, 2022]. https://www.bankofchina.com/fimarkets/lilv/fd32/201310/t20131031_2591219.html
- Ministry of Agriculture of the People’s Republic of China. (2018). Woguo sheshi yuanyi fazhan xianzhuang he jianyi [Present situation of and advice on protected horticulture development in China]. Retrieved on 17th March, 2022 Verified [April, 2022]. http://new.zhiguker.com/index/article/detail?id=24762&nav=0
- Siekman, D. (2018, December 4). Horti China 2018: China’s rapidly evolving greenhouse horticulture infrastructure. Retrieved on 6th August, 2021. Verified [April, 2022]. https://www.producereport.com/article/horti-china-2018-chinas-rapidly-evolving-greenhouse-horticulture-infrastructure
- Shanghai petroleum and natural gas exchange, liquid natural gas prices Retrieved on 6th February, 2022. Verified [April, 2022]. https://www.shpgx.com/html/yhtrqsj.html
- National Development and Reform Commission, (China Statistics Press)9787509220283 2020 Cost-benefit data of tomato under protected cultivation National agricultural products cost-benefit data compilation-2020
Appendix A.
INTKAM and KASPRO models calibration results
We employed the INTKAM-KASPRO modelFootnote1 to simulate yield and energy use of a Venlo-type glasshouse in which tomato crop was grown, for the economic feasibility studies of four different regions in China. The model was calibrated to ensure reasonable simulation results for Chinese production situations. We used the production data from year 2019 and 2020 of a cherry tomato glasshouse in Jinshan, Shanghai (latitude 30.8173° N, longitude 121.0410° E). Details on the structure, equipment climate and crop management strategies of the Jinshan glasshouse can be found in . and 23 presents the calibration results on yield and energy use of the INTKAM-KASPRO model under the Shanghai climate.
Table A1. Actual information of the glasshouse in Jinshan and the parameters used for model calibration.
Simulated yield was 2.63 kg m−2 higher than actual yield. The over-estimation can be explained by the fact that the model assumes absence of pests and diseases, optimal fertigation management and other crop management actions, which, however, is unlikely to be achieved in practical production, especially the Jinshan glasshouse data was obtained from an experimental cultivation. Many operators were interns without working experience in glasshouses. In addition, some abnormal events during the production cycle 2019–2020:
In March, some work (leaf removal, harvest, side shoot removal) could not be finished in time due to labor shortage during the covid-19 pandemic.
In April, powdery mildew and leaf mold appeared.
Towards the end of harvest, blossom end rot appeared on three trusses.
For these reasons, the model was considered to realistically simulate the tomato production in Jinshan.
Table A2. Summary of simulated and actual harvest.
Gas use was over-estimated. The simulated gas use was 12.2 m3 m−2, the adjusted actual gas use (after linearly extrapolates 12 missing values) was 12.82 m3 m−2. One explanation is that the energy use information provided by the grower was inaccurate, for example, there were missing values in the daily gas use record. Overall, the daily gas use pattern has the same trend as the actual use pattern, therefore we decided to accept this slight over-estimation and put more trust in the widely validated model.
Table A3. Summary of the actual and simulated energy use for the Jinshan glasshouse.
Electricity use was under-estimated, because the simulated electricity use only took large electricity consumption equipment into account (e.g., heat pumps, pad and fan systems, air-blower of the boiler). Smaller consumers of electricity, like circulation fans, watering pumps, pumps for circulating water in the heating system were not included. While the actual electricity use most likely takes every consumption into account. As the electricity costs only takes up around 5% of the total production costs, this over-estimation will have a minor effect on the cost estimation, which is acceptable.
Appendix B.
Calculation of weighted average cost of capital (WACC)
Table B1. Calculation of weighted average cost of capital.
Appendix C.
Climate characteristics, cropping and heating schedules of four regions
Table C1. Climate characteristics, cropping and heating schedules of four regions.
Appendix D.
Overview of parameters related to other production costs
Table D1. Parameters related to other production costs.
Appendix E.
Scenario analysis results and break-even prices
Figure E1. Mean NPV of a 1.4-hectare tomato glasshouse under different tomato and gas price changes for Jinshan, without and with 50% subsidy on the initial investment costs.
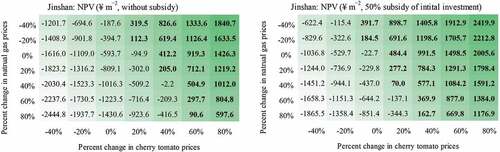
Figure E2. Mean NPV of a 1.4-hectare tomato glasshouse under different tomato and gas price changes for Langfang, without and with 50% subsidy on the initial investment costs.
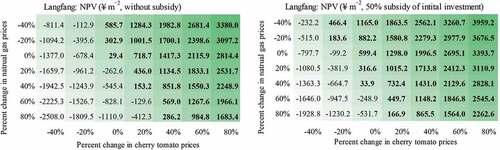
Figure E3. Mean NPV of a 1.4-hectare tomato glasshouse under different tomato and gas price changes for Weifang, without and with 50% subsidy on the initial investment costs.
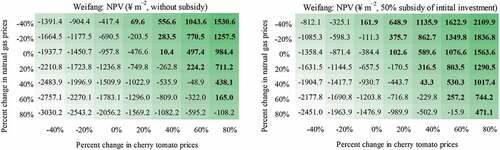
Table E1. Break-even tomato and natural gas price levels of the four regions.