
 ?Mathematical formulae have been encoded as MathML and are displayed in this HTML version using MathJax in order to improve their display. Uncheck the box to turn MathJax off. This feature requires Javascript. Click on a formula to zoom.
Abstract
Purpose
Loneliness refers to an unhappy or depressed negative emotion in which individuals feel poor intimacy in quantity or quality in current social relationships. It is not only common among the elderly, but also widely among young adults. In this study, we investigated the effects of loneliness on visual attention of social and non-social stimuli.
Materials and Methods
Here, two different category judgments (emotions and buildings) were separately used to investigate the cognitive differences of individuals with loneliness when faced different (social and non-social) stimulus. Mixed design variance analysis was used to analyze the behavioral differences between the lonely group and the non-lonely group, and ERP technology was used to analyze the brain activity differences between the lonely group and the non-lonely group during the experiment.
Results
Finally, Results showed that not only the behavioral response of lonely individuals to negative emotions was significantly faster than non-lonely individuals, but also the N170 latency was significantly shorter, and the amplitude of left hemisphere P100 was significantly higher. These findings indicated that lonely individuals had attentional bias for negative emotions. This bias was manifested as early attention enhancement and middle attention alertness.
Conclusion
The present research further sheds light on the neral mechanisms of visual attentional bias in lonely individuals.
Keywords:
1. Introduction
Most of us have experienced loneliness [Citation1], and it is a universal experience, a synonym for perceived social isolation [Citation2], which was characterized in early scientific investigations as “a chronic distress without redeeming features,” [Citation3] and loneliness has harmful effects on mental functioning and physical health [Citation4,Citation5]. Young adults are at a stage of development where they choose to socialize frequently, and too little or poor quality of social interaction can lead to strong feelings of loneliness [Citation1]. A large number of behavioral studies have shown that young adults who are perceived lonely are likely to suffer from anxiety [Citation6], depression, and other emotional problems [Citation7], and may even choose to end their lives in advance [Citation8].
Recent research had confirmed that the social pain of loneliness evolved as a signal that one’s connections to others are weakening, and it was to motivate us to repair and maintain connections with others [Citation9], which further made us feel unsafe, and this set off implicit hyper-vigilance for (additional) social threats in the environment [Citation10,Citation11]. Especially, unconscious surveillance of social threats would develop attention and memory biases. One of the consequences of loneliness’s implicit vigilance against social threats is the reduction of self-regulation, including the regulation of attention. Previous research had examined lonely individuals who were less able to regulate their attention than non-lonely individuals [Citation12,Citation13] and had more difficulties decoding social stimuli (for example, the ability to recognize emotions was reduced). However, previous studies on loneliness mostly zoomed on functional magnetic resonance imaging (fMRI) [Citation14,Citation15], Cacioppo investigated how loneliness was associated with different activation of the ventral striatum for pleasant social images and matched non-social images [Citation16], and the results showed that: lonely individuals appear to be less rewarded by social stimuli, by contrast, when they see the unpleasant social images (when compared with the social pictures), the visual cortex is activated. The behavior and fMRI research results further indicated that loneliness can increase negative social stimuli (such as social threat) attention, and fMRI has the advantage of high spatial resolution to capture the differences of activated areas during the task the paradigm, but it is difficult to explain the temporal changes of the cognitive process with low temporal resolution.
A key goal of neuroscience and medicine is not only to know what brain areas are activated during a behavioral task but also to identify when and in what specific combinations they are activated [Citation17]. The study of the neural mechanism in cognitive activities has been aided by the use of an electroencephalogram (EEG) [Citation18–20], with high temporal resolution. Furthermore, studies reported that N170 induced by faces was larger than other objects [Citation21], providing a neural measure of facial stimulation. In experimental tasks, recording event-related potentials can provide a more detailed, time-sensitive observation of attentional bias that may not be captured by reaction time.
Firstly, the earliest event-related potential (ERP) component evoked by face stimulation is P1, or P100, which refers to the maximum positive potential about 100 ms after the stimulus. P1 was widely used in visual tasks, and some studies have found that face stimulation can induce P1 differently from other objects [Citation22]. Secondly, N170 is also the main component of face stimulation. N170 refers to the negative potential that reaches its maximum of about 170 ms after the stimulus was presented, mainly distributed in the bilateral temporo-occipital lobe. N170 can distinguish faces from other visual stimuli, so it is considered to be an effective indicator of the structural encoding of faces [Citation21,Citation23,Citation24]. Bentin et al. first found the N170 component in an ERP study, which selected human faces [Citation23], animal faces, cars, scrambled faces, scrambled cars, furniture, and human hands as research materials. They found that human faces induced larger N170 amplitude in the temporo-occipital lobe and showed lateralization on the right compared to other types of objects. Traceability analysis also found that N170 components were mainly distributed in the fusiform gyrus [Citation24,Citation25]. Finally, P200 is a positive amplitude recorded at the temporoparietal lobe about 200 ms after the stimulus presentation. Some studies suggested that P200 greatly reflected the configuration processing information of faces [Citation26]. These results suggested that ERPs (P100, N170, P200) provided a neural measure of facial stimulation.
In past studies, most of the experimental paradigms were word or point probe paradigms [Citation27–29]. On the one hand, the bias for threatening social words may be attributed to the semantic processing period rather than the attentional period; on the other hand, there was no facial emotion recognition in the point probe paradigm to investigate the attention bias. In this study, we first selected emotional face images as representative social stimuli and building images as typical non-social stimulus materials. In terms of the experimental paradigm, category recognition was used to investigate the differences in visual attention between the two groups (lonely vs. non-lonely individuals) on social and non-social stimuli. Compared with traditional research, emotion recognition can further reveal the cognitive bias and intrinsic emotional motivation bias of the lonely group. In addition, the addition of non-social stimuli can further study whether the difference in visual attention between the two groups is related to social stimuli.
In the current study, we aim at investigating the attentional bias of lonely individuals in the face of different (social and non-social) stimuli by using two different category judgments (emotion and building). We tested the experimental hypothesis that attentional bias to negative emotional social stimulation. Meanwhile, the correlation analysis between the loneliness score and behavior was used to further illustrate the influence of loneliness on visual attentional behavior. Additionally, recording event-related potentials in experimental tasks can provide a more detailed observation of time-sensitive attentional bias, which may not be captured by the reaction time. Therefore, ERPs were used as a biomarker to measure which components of neurophysiological activity could be affected by loneliness, and further, illustrate the specific period of visual attentional bias of lonely individuals.
2. Materials and methods
2.1. Experiment
2.1.1. Participants
The participants were all right-handed [Citation30] students from Chongqing University of Posts and Telecommunications with normal vision or normal vision after correction. Finally, a total of 30 participants (21 males) participated in this research. The average age of participants was 19.83 years (range 17–24 years for females; 17–29 years for males). Participants without any mental or neurological problems signed informed consent before the study and were compensated after the experiment. All experiments were approved by the Ethics Committee of Chongqing University of Posts and Telecommunications.
2.1.2. Self-report questionnaires
All participants completed the UCLA (University of California, Los Angeles) Loneliness Scale [Citation31], which included 20 items that measured one’s loneliness and satisfaction with social relationships (e.g. I have no one to talk to), before participating in the experiment (which never uses the word lonely or loneliness). Participants were asked to choose among four possible choices (never, rarely, sometimes, often) what they felt the same as themselves. The scale had good internal consistency on the frequency scale (α = 0.95). Those with scores greater than 41 were classified as the lonely group (15 individuals), while those less than 40 were classified as the non-lonely group (15 individuals). There were significant differences in scores between the two groups (p < 0.001).
2.1.3. Stimuli
Stimuli were 90 images that varied in social and non-social. The social stimulus consists of three emotion categories: positive, neutral, and negative. The non-social stimulus consists of three building types: home, church, and school. The face images in the experiment were generated by Facegen software (https://www.facegen.com). In order to prevent interference from other factors, the ears, hair, and neck parts were removed using Photoshop (https://www.helpx.adobe.com).
2.1.4. Procedure
When participants arrived at the lab, the study information script approved by the local Institutional Review Board was read to the participants. The script told them how to do the experiment, asked them if they would give verbal consent to their participation, and asked them about handedness and other questions about loneliness.
Participants were asked to sit straight in front of a computer, and they were asked to press the button as quickly as possible on the keyboard. After the experiment, participants were asked, paid, and allowed to ask questions.
2.1.5. Experimental design
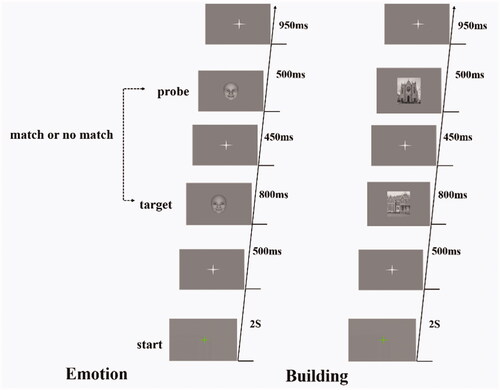
Participants performed tasks of category judgment while recording EEG. At the beginning of each trial, a green cross appeared in the center of the screen for 2 s, followed by a fixed gray cross for 500 ms, then a target for 800 ms, a gray cross for 450 ms, followed by a probe for 500 ms, and finally a fixed cross. Participants tested whether the target stimulus and probe stimulus category were consistent or inconsistent by pressing the index or middle finger of their right hand (see ). Trials ended with the response or after a time out of 3.2 s after onset, then take a break and repeat the experiment. Reaction time (RT) was recorded using E-Prime 2.0 software (http://www.pstnet.com/eprime.cfm). The experiment consisted of 2 sessions, and each session consisted of 2 blocks. Emotion block contains 90 trials, specifically 30 trials in the positive emotion category, 30 trials in the neutral emotion category, and 30 trials in the negative emotions category; Building block contains 90 trials, specifically 30 trials in the home category, 30 trials in the church category, and 30 trials in the school category.
Figure 1. Trial schematic. Participants performed category discrimination against the probe (second picture) according to the category of target (the first picture), press “1” for consistency and press “2” for inconsistency.
2.2. Electroencephalogram recording
EEG data were recorded using a 64-channel NeuroScan EEG system (impedance < 10 ), where EEG electrodes are arrayed in a dense and regular distribution across the head surface. The EEG was digitized at 1000 Hz, with ears mastoid (M1, M2) serving as an online recording reference. Participants sat in a comfortable chair about 130 cm from a computer screen with a picture in the center.
2.3. Analysis
2.3.1. Behavioral processing
The response data had been screened according to each participant’s experimental data and outliers were removed. If the experimental results were 3 criteria higher or lower than the participant’s average, the experiment was deleted (12.31% of observations were rejected) [Citation32]. Then calculated the average of each subject in each task, and took ln for the average value.
2.3.2. Electroencephalogram processing
EEG data had been analyzed using EEGLAB toolbox [Citation33], and were re-referenced to Rest reference [Citation34]. The processing of raw data is referenced in the research of Romy et al. [Citation35]. EEG data had been filtered (0.5 Hz low cut off and 32 Hz high cutoff). Data had been segmented from −200 to 800 ms relative to the target stimulus event, and the baseline was corrected to the pre-stimulus interval. Segments contained artifacts, thus removing fragments with values of ±75 μV or with a gradient greater than ±50 μV were invalid and therefore excluded from further analysis. Trials of all participants were combined in a 3D matrix (channels, time points, trials by participants), which formed the basis for all further ERP analyses.
2.3.3. Statistical plans for event-related potential analyses
In the present research, we used a prior orthogonal comparison to investigate the difference in amplitude and latency of ERPs induced by social stimuli between lonely and non-lonely individuals. The comparison of 2 × 3×2 stimuli was conducted using SPSS 25, as described below. In this study, factor A (loneliness level) was the between-subject-factor, while factor B (emotional mood type) and factor C (left and right hemispheres) were the within-subject-factor, so a simple main effect test would be calculated at each level of A.
2.3.4. Event-related potentials
The ERP data of different stimulus categories of each subject were calculated separately. We determined that the electrode showed the maximum amplitude of ERPs (P100, N170, and P200). In view of the strong activity of faces in the temporo-occipital lobe region, and maximum visual ERPs induced by PO7 and PO8 in this study, we selected PO7 and PO8 as the observation electrodes of this study. Especially, P1 is the positive component caused by 60–130 ms after the presentation of the stimulus (target stimulus), and the N170 was quantified as the maximum amplitude in the incubation period of 130–200 ms. Finally, P2 is the positive component caused by 200–260 ms after the stimulus presentation.
3. Results
3.1. Behavioral results
A mixed variance analysis of 2 (lonely vs. non-lonely) × 3 (positive vs. neutral vs. negative) was used on RT. Ln was taken for RT in order to conform to Normal Distribution. The results showed that the intra-subjective emotion effect was significant (F(2, 56) = 44.032, p < 0.001, = 0.611), and the interaction between group and emotion effect were marginal significantly (F(2, 56) = 2.723, p = 0.076,
= 0.089, Greenhouse–Geissler correction). The subject main effect was not significant (F(1, 28) = 2.922, p > 0.05,
= 0.094), and the within-subjective effect was further analyzed by an intra-group paired t-test. The results showed that in the lonely group, positive and negative (t(14) = −6.287, p < 0.001) and neutral and negative (t(14) = −3.320, p = 0.005) have significant differences. Non-lonely group: positive and natural (t(14) = −2.672, p = 0.018), neutral and negative (t(14) = −6.671, p < 0.001), positive and negative (t(14) = −6.706, p < 0.001) have significant differences (see ). A simple effect analysis of interaction effects showed that there were significant differences in negative emotions between the two groups (t(28) = −2.530, p = 0.017) (see ).
Figure 2. Behavioral data visualization. (a) The comparison between the two groups in the emotion experiment; (b) the comparison of three categories in the building experiment of two groups; (c) the comparison of negative emotions between the two groups in the emotion experiment; (d) negative emotions RT was associated with the loneliness scores.
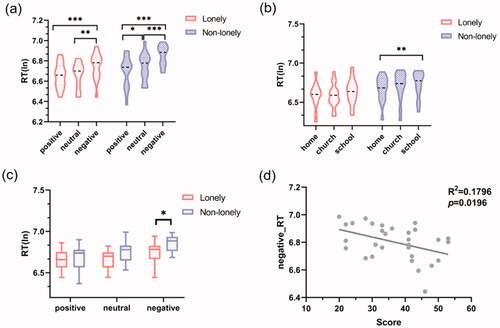
Similarly, a mixed variance analysis of 2 (lonely vs. non-lonely) × 3 (home vs. church vs. school) showed that: The effect of building type within the main effect was significant (F(2, 56) = 6.576, = 0.190, p = 0.003), but the effect between the main effect and the interaction effect was not significant. Intra-group paired t-test results showed that there were significant differences between the home-school in the non-lonely group (t(14) = −3.102, p = 0.008) (see ). RT was displayed in . Correlation analysis showed that the recognition speed of negative emotions was significantly negatively correlated with the loneliness score (see ). These results examined that the two groups only had significant differences in social stimulus, especially negative social stimulus (negative emotions). For negative emotions, the lonely group was significantly faster than the non-lonely group and was associated with the loneliness scores, indicating that the lonely group has an attentional bias for negative social stimulus.
Table 1. Statistical results of RT (mean ± SD (ms)) of the two groups in experiment (in order to make it a normal distribution, we took the ln).
3.2. Electroencephalogram results
3.2.1. P1 amplitudes
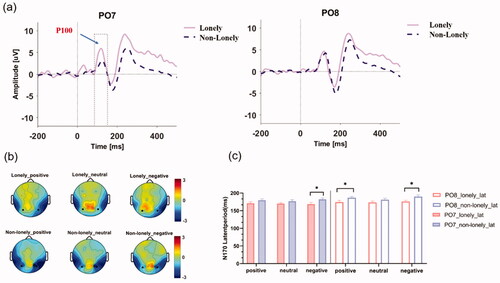
Since the results of behavioral data showed that there were significant differences between the two groups mainly in social stimulation, and no significant differences were found in non-social stimulation, the subsequent EEG analysis focused on the emotion experiment. SPSS 25 was used for statistical analysis of amplitude and latency of P100. Mixed variance analysis 2 (lonely vs. non-lonely) × 3 (positive vs. neutral vs. negative) × 2 (left vs. right) showed a significant interaction effect between the inner hemisphere of the subject and the group (F(1, 28) = 6.493, = 0.188, p = 0.017), simple effect analysis showed that the amplitude of negative emotions in the left hemisphere of the lonely group was significantly higher than non-lonely group (t(14) = 2.101, p = 0.045), indicating that the lonely individuals have an attentional bias for negative emotions in the early visual attention (See ).
Figure 3. EEG data visualization. (a) negative emotions of ERPs in two groups at PO7 and PO8 electrodes; (b) N170 topology; (c) statistical analysis visualization of N170 latency period at PO7/PO8.
3.2.2. N170 amplitudes
Considering the topological structure of N170 (see ), the amplitude and latency of N170 at PO7 and PO8 electrodes had been analyzed using SPSS 25. Mixed variance analysis of 2 (lonely vs. non-lonely) × 3 (positive vs. neutral vs. negative) × 2 (left vs. right) showed a significant effect in the subject’s inner hemisphere (F(2, 56) = 5.509, = 0.175, p = 0.027). Furthermore, intra-group paired t-test analysis was conducted on the effect of subjects’ inner hemispheres. The results showed that: negative emotions (t(14) = 2.852, p = 0.014) and positive emotions (t(14) = 2.233, p = 0.042) had a right hemisphere advantage in the lonely group, while no right hemisphere advantage was found in the non-lonely group.
3.2.3. P200 amplitudes
Mixed variance analysis did not find any significant effects.
3.2.4. P100 latency period
Statistical analysis did not find any significant effects.
3.2.5. N170 latency period
The subject main effect was significant (F(1, 28) = 4.721, = 0.154, p = 0.039). Two-sample t-test results showed that when facing negative emotional stimulation, the lonely group was significantly faster than the non-lonely group at PO7 electrode (168.7 vs 182.1 ms, t(28) = −2.132, p = 0.043). At PO8 electrode, the lonely group was significantly faster than the non-lonely group in positive (167.3 vs. 179.2 ms, t(28) = −2.294, p = 0.03) and negative stimulation (168.8 vs. 182.0 ms, t(28) = −2.345, p = 0.027) (see ).
3.2.6. P200 latency period
The interaction effect was significant between intra-subject emotion and hemispheres (F(2, 27) = 5.689, = 0.296, p = 0.009). Intra-group paired t-test results showed that the latency of negative emotions was significantly shorter than neutral emotions in the right hemisphere of the non-lonely group (239.4 vs.252.3 ms, t(14) = −2.538, p = 0.024), indicating that non-lonely individuals in this period, the processing speed of negative emotional stimulus was significantly faster than neutral emotional stimulus.
4. Discussion
Existing research examining lonely individuals would be related to high paying attention to social targets in the environment, it could be used to prevent social exclusion and promote opportunity in society [Citation16,Citation36,Citation37]. The goal of the present study was to examine the experimental hypothesis that the implicit attentional bias to negative emotions differs between lonely and non-lonely individuals, in contrast to nonsocial images, using social stimulus (emotional face) and non-social stimulus (buildings) categories were identified, and ERP analysis was performed on high-density EEG data.
The results showed that there was no significant difference between the two groups in the building task, and the difference was mainly in the emotional face recognition experiment. In addition, perceived social isolation mainly affected visual attention processing of social stimuli, that is, visual attention to emotional faces (see ). Emotions are important social cues because they convey information about the inner state of the person expressing the emotion and may reflect whether the person is willing to accept or reject others [Citation38], and emotion recognition is considered to be a key factor in social monitoring [Citation39]. This confirmed that compared with non-lonely individuals, lonely individuals can enhance their social supervision, which was manifested faster in the emotional face recognition task, and strengthening the social supervision can increase the sense of belonging. Lonely individuals experienced their social life as unsatisfying, and have experienced for a long time without meeting the demand for a sense of belonging, which would cause them to reconnect the social desire [Citation40], and more attention to social cues.
Cacioppo’s loneliness model assumed that perceived social isolation led to implicit over-vigilance to (additional) social threats in the environment [Citation10,Citation11]. Moreover, over time, their memories of other people’s interactions became more negative [Citation41], resulting in less benevolent expectations, and reasoning and they may engage in behaviors that push away their nearest and dearest to better meet their social needs [Citation42,Citation43]. This was consistent with our findings.
Firstly, we found that the P100 amplitude of negative emotions in the left hemisphere of the lonely group was significantly higher than in the non-lonely group when viewing the social stimulus pictures (faces), which indicates that lonely individuals had an attentional bias for negative emotions, and this bias was reflected in the attentional intensity. Furthermore, the left rather than the right hemisphere would suggest that the attention of lonely individuals to negative emotions may be localized (e.g. mouth) visual attention. Secondly, the priority response of N170 indicated that in the early period of attention, the attentional bias of lonely individuals for negative emotions was reflected in the processing speed (see ). In particular, we found that lonely individuals had a right hemisphere advantage in negative and positive emotional stimuli, indicating that lonely individuals may lead to the general over-activation of emotional stimuli (see ). Finally, P200 latency analysis results showed that, in the middle stage of visual attention, the right hemi processing speed of negative emotional faces in non-lonely individuals was significantly faster than neutral emotional faces, which was consistent with the evolutionary theory that individuals are alert to negative stimuli.
For behavioral analysis, we found that there was no significant difference in response time between positive and neutral faces in lonely individuals. The researchers found that individuals tended to classify faces with positive emotions faster than negative ones [Citation44–47], and occasionally faster than neutral ones [Citation48]. There was no classification advantage of positive emotion over neutral emotion in the lonely group, and the happy expression was a natural reward. The reduced classification advantage of happy expression pointed to the functional abnormality of the intrinsic motivation system of loneliness [Citation49]. This was consistent with previous studies that lonely individuals had certain impairments of social cognitive function [Citation10,Citation50]. In addition, lonely individuals perceived negative emotions significantly faster than non-lonely individuals. From the behavioral point of view, it indicated that loneliness was related to a negative bias of attention in social information processing. This was consistent with previous research on loneliness emotion recognition behavior [Citation51]. Finally, the correlation analysis showed that loneliness was associated with increased sensitivity to negative emotions (see ), which was consistent with previous studies [Citation40,Citation51,Citation52]. That is, loneliness will cause attention to negative emotions, and at the same time, this will affect the loneliness, forming a vicious circle. Based on these findings, we suggested that loneliness was associated with the ability to recognize negative emotions, and may experience higher arousal to negative emotions.
In this study, the improved category recognition experiment was used to explore the attentional bias of lonely individuals from the emotional perspective, which broadened the idea for studying the mechanism of attentional bias of lonely individuals. Additionally, from the perspective of correlation, we explore the influence of loneliness on relevant cognitive behaviors and further provide new ideas for the interpretation of cognitive behavior outcome patterns.
There were a couple of limitations of the present study: (1) it included only a small number of subjects; (2) the analysis of behavior was only limited to the reaction time, and the drift-diffusion model should be used to further explain the behavior data; and (3) there was no valence for non-social stimuli. A larger number of participants will increase the generality of these findings and facilitate further generalization of the study.
In sum, the current study provides additional explanations for how loneliness affects the processing of negative emotional social stimuli. For example, in the recognition of negative emotions speed, there was a significant negative correlation with the loneliness score, lonely individuals were faster to recognize the negative emotions, for positive emotions and neutral emotional recognition did not differ significantly. These clearly expounded the loneliness to the social motive of the negative emotions of attention bias and lacked intrinsic motivation for positive emotions. In this paper, the study of visual attention in the lonely group provided a research basis for visual attention cognitive intervention in lonely individuals and was expected to further promote the clinical intervention for the social improvement in lonely individuals.
5. Conclusion
Based on these findings, we propose that lonely individuals are highly alert to social stimuli, especially negative emotions, and this bias is reflected in the processing intensity of local features of faces with negative emotions at the beginning of attention, and in processing speed at the early and middle periods of visual attention. To sum up, this research studied the difference in visual attention between lonely and non-lonely groups from two aspects of behavior and ERPs and found that lonely individuals have an attentional bias toward negative emotion. These findings provide a new way to explain the neural mechanism of visual attentional bias in lonely individuals.
Disclosure statement
The authors declare that the research was conducted in the absence of any commercial or financial relationships that could be construed as a potential conflict of interest.
Additional information
Funding
Notes on contributors
Xiao Du
Xiao Du is a graduate student of Chongqing University of Posts and Telecommunications. The main research direction is attention cognitive bias of lonely individuals. She received her bachelor's degree in Electronical Information Engineering from Xi 'an University of Science and Technology in 2019.
Yi Tang
Xiao Du, College of Bio-information, Chongqing University of Posts and Telecommunications, Chongqing, China.
Yin Tian
Yin Tian, received the Ph.D. degree in biomedical engineering from the School of Life Science and Technology, University of Electronic Science and Technology of China, in 2009. She is currently a Professor with the College of Computer Science and the Bioinformation College, Chongqing University of Posts and Telecommunications. Her research interests include cognitive neuroscience, EEG/fMRI data processing, machine learning, brain network technology, and brain–computer interface.
References
- Qualter P, Vanhalst J, Harris R, et al. Loneliness across the life span. Perspect Psychol Sci. 2015;10(2):250–264.
- Hawkley LC, Cacioppo JT. Loneliness matters: a theoretical and empirical review of consequences and mechanisms. Ann Behav Med. 2010;40(2):218–227.
- Weiss RS. Loneliness: the experience of emotional and social isolation. Cambridge (MA): MIT Press; 1973.
- Cacioppo JT, Hawkley LC, Crawford LE, et al. Loneliness and health: potential mechanisms. Psychosom Med. 2002;64(3):407–417.
- Heinrich LM, Gullone E. The clinical significance of loneliness: a literature review. Clin Psychol Rev. 2006;26(6):695–718.
- Mijuskovic B. Loneliness, anxiety, hostility, and communication. Child Study J. 1986;16(3):227–240.
- Fontaine RG, Yang C, Burks VS, et al. Loneliness as a partial mediator of the relation between low social preference in childhood and anxious/depressed symptoms in adolescence. Dev Psychopathol. 2009;21(2):479–491.
- Roberts I, Schierhout G, Alderson P. Absence of evidence for the effectiveness of five interventions routinely used in the intensive care management of severe head injury: a systematic review. J Neurol Neurosurg Psychiatry. 1998;65(5):729–733.
- Cacioppo J, Patrick W. Loneliness: human nature and the need for social connection. London (UK): W W Norton & Co.; 2008.
- Cacioppo JT, Hawkley LC. Perceived social isolation and cognition. Trends Cogn Sci. 2009;13(10):447–454.
- Cacioppo JT, Hawkley LC, Ernst JM, et al. Loneliness within a nomological net: an evolutionary perspective. J Res Personality. 2006;40(6):1054–1085.
- Cacioppo JT, Ernst JM, Burleson MH, et al. Lonely traits and concomitant physiological processes: the MacArthur social neuroscience studies. Int J Psychophysiol. 2000;35(2–3):143–154.
- Hawkley LC, Thisted RA, Cacioppo JT. Loneliness predicts reduced physical activity: cross-sectional & longitudinal analyses. Health Psychol. 2009;28(3):354–363.
- Tian Y, Yang L, Chen S, et al. Causal interactions in resting-state networks predict perceived loneliness. PLoS One. 2017;12(5):e0177443.
- Yi Y, Li LMW, Xiao Y, et al. Brain activity mediates the relation between emotional but not instrumental support and trait loneliness. Soc Cogn Affect Neurosci. 2018;13(9):995–1002.
- Cacioppo JT, Norris CJ, Decety J, et al. In the eye of the beholder: individual differences in perceived social isolation predict regional brain activation to social stimuli. J Cogn Neurosci. 2009;21(1):83–92.
- Cacioppo S, Weiss RM, Runesha HB, et al. Dynamic spatiotemporal brain analyses using high performance electrical neuroimaging: theoretical framework and validation. J Neurosci Methods. 2014;238:11–34.
- Boksem MAS, Meijman TF, Lorist MM. Effects of mental fatigue on attention: an ERP study. Brain Res Cogn Brain Res. 2005;25(1):107–116.
- Brouwer A-M, Hogervorst MA, van Erp JBF, et al. Estimating workload using EEG spectral power and ERPs in the n-back task. J Neural Eng. 2012;9(4):045008.
- Solomon B, DeCicco JM, Dennis TA. Emotional picture processing in children: an ERP study. Dev Cogn Neurosci. 2012;2(1):110–119.
- Tian Y, Zhang H, Pang Y, et al. Classification for Single-Trial N170 during responding to facial picture with emotion. Front Comput Neurosci. 2018;12:68.
- Wynn JK, Lee J, Horan WP, et al. Using event related potentials to explore stages of facial affect recognition deficits in schizophrenia. Schizophr Bull. 2008;34(4):679–687.
- Bentin S, Allison T, Puce A, et al. Electrophysiological studies of face perception in humans. J Cogn Neurosci. 1996;8(6):551–565.
- Itier RJ, Taylor MJ. N170 or N1? Spatiotemporal differences between object and face processing using ERPs. Cereb Cortex. 2004;14(2):132–142.
- Itier RJ, Taylor MJ. Inversion and contrast polarity reversal affect both encoding and recognition processes of unfamiliar faces: a repetition study using ERPs. Neuroimage. 2002;15(2):353–372.
- Latinus M, Taylor MJ. Face processing stages: impact of difficulty and the separation of effects. Brain Res. 2006;1123(1):179–187.
- Cacioppo S, Balogh S, Cacioppo JT. Implicit attention to negative social, in contrast to nonsocial, words in the stroop task differs between individuals high and low in loneliness: evidence from event-related brain microstates. Cortex. 2015;70:213–233.
- Qualter P, Rotenberg K, Barrett L, et al. Investigating hypervigilance for social threat of lonely children. J Abnorm Child Psychol. 2013;41(2):325–338.
- Wei M, Roodenrys S, Miller L. Attentional bias for threat and anxiety: the role of loneliness. Psychiatry. 2020;83(3):278–291.
- Oldfield RC. The assessment and analysis of handedness: the Edinburgh Inventory. Neuropsychologia. 1971;9(1):97–113.
- Russell D, Peplau LA, Ferguson ML. Developing a measure of loneliness. J Pers Assess. 1978;42(3):290–294.
- Chen Q, Zhou X. Vision dominates at the preresponse level and audition dominates at the response level in cross-modal interaction: behavioral and neural evidence. J Neurosci. 2013;33(17):7109–7121.
- Delorme A, Makeig S. EEGLAB: an open source toolbox for analysis of single-trial EEG dynamics including independent component analysis. J Neurosci Methods. 2004;134(1):9–21.
- Dong L, Li F, Liu Q, et al. MATLAB toolboxes for reference electrode standardization technique (REST) of scalp EEG. Front Neurosci. 2017;11:601.
- Frömer R, Maier M, Abdel Rahman R. Group-level EEG-processing pipeline for flexible single trial-based analyses including linear mixed models. Front Neurosci. 2018;12:48.
- Bangee M, Harris RA, Bridges N, et al. Loneliness and attention to social threat in young adults: findings from an eye tracker study. Personal Individual Diff. 2014;63:16–23.
- Gardner WL, Pickett CL, Jefferis V, et al. On the outside looking in: loneliness and social monitoring. Pers Soc Psychol Bull. 2005;31(11):1549–1560.
- Ekman P. Facial expression and emotion. Am Psychol. 1993;48(4):384–392.
- Pickett CL, Gardner WL, Knowles M. Getting a cue: the need to belong and enhanced sensitivity to social cues. Pers Soc Psychol Bull. 2004;30(9):1095–1107.
- Lodder GMA, Scholte RHJ, Goossens L, et al. Loneliness and the social monitoring system: emotion recognition and eye gaze in a real-life conversation. Br J Psychol. 2016;107(1):135–153.
- Duck S, Pond K, Leatham G. Loneliness and the evaluation of relational events. J Soc Pers Relationships. 1994;11(2):253–276.
- Murray SL, Bellavia GM, Rose P, et al. Once hurt, twice hurtful: how perceived regard regulates daily marital interactions. J Pers Soc Psychol. 2003;84(1):126–147.
- Rotenberg KJ. Loneliness and interpersonal trust. J Soc Clin Psychol. 1994;13(2):152–173.
- Horan WP, Blanchard JJ, Clark LA, et al. Affective traits in schizophrenia and schizotypy. Schizophr Bull. 2008;34(5):856–874.
- Engel M, Lincoln TM. Motivation and pleasure Scale-Self-Report (MAP-SR): validation of the German version of a self-report measure for screening negative symptoms in schizophrenia. Compr Psychiatry. 2016;65:110–115.
- Winer ES, Veilleux JC, Ginger EJ. Development and validation of the specific loss of interest and pleasure scale (SLIPS). J Affect Disord. 2014;152–154:193–201.
- Adolphs R. Neural systems for recognizing emotion. Curr Opin Neurobiol. 2002;12(2):169–177.
- Günther V, Lindner C, Dannlowski U, et al. Amygdalar gray matter volume and social relating in schizophrenia. Neuropsychobiology. 2016;74(3):139–143.
- Gorwood P. Neurobiological mechanisms of anhedonia. Dialogues Clin Neurosci. 2008;10(3):291–299.
- Lara E, Caballero FF, Rico-Uribe LA, et al. Are loneliness and social isolation associated with cognitive decline? Int J Geriatr Psychiatry. 2019;34(11):1613–1622.
- Vanhalst J, Gibb BE, Prinstein MJ. Lonely adolescents exhibit heightened sensitivity for facial cues of emotion. Cogn Emot. 2017;31(2):377–383.
- Vanhalst J, Soenens B, Luyckx K, et al. Why do the lonely stay lonely? Chronically lonely adolescents’ attributions and emotions in situations of social inclusion and exclusion. J Pers Soc Psychol. 2015;109(5):932–948.