
ABSTRACT
This research was funded through the American Speech and Hearing Foundation’s 2012 StudentResearch Grant in Early Childhood Language Development awarded to Vanessa Harwood as well as an anonymous generous donation to Haskins Laboratories. Electrophysiological measures of language within early childhood provide important information about neurolinguistic development. We investigated associations between amplitude and latency of the P1 and N2 event-related potential components in response to spoken pseudowords, and clinical measures of language performance within a sample of 58 typically developing children between 24 and 48 months. N2 amplitude differences between repeated and new tokens were correlated with measures of expressive and receptive language and speech sound production. Phonemic sensitivity measured by the N2 component may reflect the integrity of neural networks that are important for speech perception and production in young children.
Introduction
Speech perception is a complex phenomenon which supports a young child’s spoken language development. Multiple factors contribute to the development of sophisticated speech perception, such as maturation of the auditory pathways (Ponton, Eggermont, Coupland, & Winkelaar, Citation1992) and extended exposure to the ambient language (Nittrouer, Manning, & Meyer, Citation1993). Moreover, speech perception and speech production appear to mutually influence each other during language acquisition. Early evidence for this perception–production relationship is observed in the development of categorical perception. Specifically, categorical perception of both native and non-native speech sounds is observed in infants as young as 4 months (Eimas, Siqueland, Jusczyk, & Vigorito, Citation1971), indicating early sensitivity to the phonetic features of speech. As infants get older, these categories become more finely tuned through experience and infants lose the ability to discriminate between phonetic categories that are not meaningful in their native language (Werker & Tees, Citation1984). Critically, this tuning happens as children begin to speak their first words in their native language, suggesting an overlapping time course for the development of speech perception and speech production (Kuhl, Conboy, Padden, Nelson, & Pruitt, Citation2005; Vihman, Citation2017).
Event-related potentials (ERPs) measure stimulus-locked averages of the ongoing encephalogram (EEG). ERPs provide excellent temporal information about neural processing of rapidly unfolding input, such as spoken language. ERPs also provide sensitive measures of individual differences, which can be useful for examining typical and atypical language development. For example, ERPs to speech recorded during infancy predict later language outcomes, including spoken vocabulary (Kuhl, Conboy, Padden, Rivera-Gaxiola, & Nelson, Citation2008; Leppanen et al., Citation2011; Molfese, Citation2000). ERPs also provide excellent temporal information about the neural processing of language comprehension in young children (Molfese, Citation1990; Asano et al., Citation2015; Friedrich & Friederici, Citation2015. Further, school-aged children with a developmental language disorder (DLD) show atypical ERP responses to varying phonological input when compared to typically-developing children (Archibald & Joanisse, Citation2012). These studies suggest that the ability to process salient features of the speech signal early in development is important for later language development and academic success. Further, they validate the use of ERPs as a tool for examining individual differences in the neural processing of speech and language development.
While a substantial body of research has investigated the neural mechanisms associated with speech processing in infants and school-aged children, fewer studies have examined these mechanisms in toddlers. Although there is no universal definition of toddlerhood, toddlers are often described as children between the ages of 18–36 months who have not yet entered preschool (American Academy of Pediatrics, Citation2021). Despite the inherent difficulties in task compliance, toddlers are a critical population to study given the rapid changes in linguistic competence observed at this age. Moreover, this time is important clinically, as it is typically the first time that parents seek clinical services for children with speech and language delays (Skeat, Eadie, Ukoumunne, & Reilly, Citation2010). Thus, including toddlers in neurobiological research is essential to gain insights into the nature of the neural mechanisms associated with early language change (Borgstrom et al., Citation2016, p. 2019).
ERPs as markers of language in children
As noted above, ERP components recorded in response to speech in infancy are associated with language and literacy development. For example, in a series of studies, Molfese and colleagues demonstrated that ERP responses recorded at infancy to a series of nine syllables, using a /bi-gi/continuum and non-speech homologues, strongly predicted later language and literacy ability for preschool and school-age children (Molfese & Molfese, Citation1985; Molfese & Molfese, Citation1997; Molfese, Citation1995; Molfese, Citation2000). Further, Molfese and Molfese (Citation1997) demonstrated that classification into high and low-functioning language ability at age five was possible based on ERP responses (N220 and N630) to speech syllables as newborns. Specifically, group differences at birth in ERP response to speech were reflected in the large initial negative peak (N220) recorded over the left hemisphere and a second negative peak (N630), which occurred over both hemispheres.
In a subsequent report, these findings were extended to determine the extent to which early ERPs to speech relate to later literacy development. Molfese (Citation2000) re-analyzed the ERP responses in newborns shortly after birth and used them to predict literacy at age 8. These data revealed three ERP components, N1, P2, and N2, the first and second negative peaks and the second positive peak, recorded over the left and right hemispheres classified children into three groups (dyslexic, poor, and average readers). The effects were generally characterized by faster latencies and larger N1 amplitudes for the typical readers. Thus, ERP responses to speech stimuli recorded shortly after birth predicted literacy outcomes at age 8. The authors suggested that perceptual mechanisms at birth, which allow for the rapid detection and processing of stimuli, may be advantageous in learning language.
While the aforementioned studies used single stimulus recordings, other ERP studies show that infants who demonstrate strong discrimination between phonemic contrasts in their native language and minimal distinctions between non-native categories have better language skills in the toddler years (Kuhl et al., Citation2006; Rivera-Gaxioloa, Silva-Pereyra, & Kuhl, Citation2005). For example, Kuhl and colleagues (Citation2008) recorded ERPs in a group of monolingual English infants within the first year of life (7.5 months). The mismatch negativity (MMN) component (an early component from ~100–250 ms) was recorded in response to native and nonnative speech contrasts. Data was averaged across frontal and temporal electrode sites. Within the MMN, greater negativity to deviant stimuli for the native syllable contrasts was related to vocabulary production, sentence complexity, and sentence length at ages 2 and 3. More recent studies on monolingual and bilingual infants and toddlers further highlight the importance of early ERP components as perceptual indices associated with language skills (Garcia-Sierra, Ramírez-Esparza, & Kuhl, Citation2016; Kuipers & Thierry, Citation2015). Considered together, this body of work reveals that sensitivity to phonemic information within early development lays the foundation for future language and literacy, and that deficits in phonological processing may be associated with language impairment. These studies provide evidence that phonological sensitivity measured by early ERP components (e.g., MMN, P1, N1, P2, and N2) relates to individual differences in language and literacy skills in children.
While this work has been foundational for understanding very early neurobiological responses in relation to later individual differences, few studies have used ERPs to measure the neural response to speech within the toddler population. One previous study from our group (Harwood et al., Citation2017), used ERPs to test aspects of the Perceptual Deficit Theory (Joanisse & Seidenberg, Citation2003), a model used to explain language impairment, in a sample of toddlers and young children (n = 40). The authors predicted that phonemic sensitivity (measured by ERPs) and phonological working memory (measured by the Test of Early Nonword Repetition, TENR; Stokes & Klee, Citation2009) would both independently contribute to language performance in toddlers. Harwood et al. (Citation2017) used a “data driven-approach” in which a Spatial-Temporal Principal Components Analysis (PCA) was used to identify ERP components of interest while the participants listened to pseudowords within an old/new design. The PCA revealed two distinct components. A P3a component (located within a midline frontal electrode montage) was predictive of language performance and highly related to TENR performance. The authors concluded that the P3a may be indexing phonological working memory. The second ERP component within a temporal electrode montage (negative deflection, 136–220 ms) also explained a significant portion of variance when predicting language measures. This component may be indexing lower-level processing of phonological information. The latency differences between old and new stimuli within the P3a and N 136–220 ms identified by the PCA were related to clinical assessments of language such that “faster” latencies for the deviant response were associated with higher performance on language measures.
The current study is a reanalysis and extension of Harwood et al. (Citation2017). The current study utilizes a larger sample (n = 58) and is an a-priori investigation of two ERPs, the P1 and N2 components, to determine their relationship with a variety of clinically relevant assessments commonly used with the toddler population. By investigating the P1 and N2 components, we link our results to other laboratories and investigations of brain and behavior in young children and expand on methodologies that are used with toddlers and young children. This study intends to add to the literature by establishing the presence of the P1 and N2 components within a relatively large sample of typically developing toddlers. To the authors’ knowledge, no study has specifically investigated discrimination within these components within the toddler population and determined how these components relate to clinically useful language measures.
Purpose and hypothesis
Here, we investigate the P1 and N2 components in response to pseudowords in a sample of toddlers and young children (aged 24–48 mos.). Our focus on these two components is informed by Silva and colleagues (Citation2017), who conducted a systematic review of auditory ERPs to determine developmental trends in ERP components. Their analysis of the literature revealed that the P1, the first positive peak occurring between 100 and 150 ms, was the most frequently observed auditory ERP component in young children. The P1 component is thought to be generated in Heschl’s gyrus (Smith & Kraus, Citation1988) and reflect the encoding of the acoustic features of sound. Similarly, the N2, the second negative peak occurring at approximately 200 ms, was observed as the second most common auditory component present in young children. When recorded in young children, the P1 and the N2 peaks are proposed to index transient encoding of the acoustic sound features within the central nervous system and can be recorded from central-midline recording sites (Ceponiene Citation2001, p. 2002). The N2 amplitude can increase with stimulus repetition in children, and therefore has been suggested as a “build up” of neural representations of repetitive sounds (Karhu et al., Citation1997). The P1 and N2 components appear to change with age and take on more adult-like morphology by age 16 with the development of the N1-P2 complex (Ceponiene et al., Citation2003). This is suggested to mark maturation of the central auditory pathways. Therefore, investigation of the P1 and N2 components within toddlerhood can provide critical information on early development and the auditory pathways and maturation associated with language development.
In this study, ERP stimuli consisted of two pseudowords /bidu/ and /ɡibu/, in an old/new design, modeled after Molfese et al. (Citation1990) and used by Landi, Crowley, Wu, Bailey, and Mayes (Citation2012) and Harwood et al. (Citation2017). These stimuli consisted of voiced stop consonants and cardinal vowels consistent with the phonotactic patterns of English. These were presented in an old/new design, which via presentation of both repeated tokens in the first block, and novel tokens in the second block, affords exploration of phonemic processing as well as initial sub-lexical aspects of word learning. Much of the previous ERP literature on infants has focused on phonemic discrimination using single syllables (typically CVs). The use of bisyllabic pseudowords provides a more naturalistic context to investigate how young children (between the ages of 2–3) process phonemic information across multisyllabic units. Researchers who have investigated early components, particularly the N2 component, have documented those children with typical language development demonstrate less neural effort (decreased negativity) to processes changes in acoustical/phonological stimuli (Bonte & Blomert, Citation2004; Landi et al., Citation2012; McArthur & Bishop, Citation2004). Previous literature and theory posit that efficient phonemic processing sets the foundation for future word learning and eventually the phonemic processing skills necessary for literacy development (Joanisse & Seidenberg, Citation2003; Jusczyk & Bertoncini, Citation1988; Kuhl et al., Citation2008; Molfese, Molfese, & Pratt, Citation2007). It is also consistent with other studies documenting differences in the neural mechanisms responsible for speech processing within children with speech sound disorders (Preston et al., Citation2010, Citation2012).
We hypothesized:
The P1 (occurring at approximately 100 ms) and the N2 (occurring at approximately 200 ms) auditory ERPs would be elicited in response to pseudowords within central midline channels.
Differences in amplitude and latency within the P1 and N2 components would show differential response for the new stimulus relative to the old (repeated) stimulus such that less negativity for the new stimulus would be associated with clinical measures of speech and language.
Methods
Participants
A sample of 70 children between the ages of 24 to 48 months were recruited from public advertisements. Twelve participants did not comply with the ERP task and are not reported on within this manuscript; therefore, the current sample consists of 58 children (M age: 32.8 mos, 34 male). The methods of data collection are similar to those reported in Harwood et al. (Citation2017); however, the participant pool is extended in the current sample and the ERP components of interest differ. These participants were from the Haskins Laboratories Language and Early Assessment Research Network (LEARN), which assessed neurobiological markers of speech perception and production in young children. All children met the following criteria: 1) monolingual English speakers, 2) no known psychiatric or neurological deficits per parent report, and 3) hearing and vision within normal limits at the time of the study per parent report. All children were reported to have passed newborn hearing screenings. All study experimental procedures were approved through the University of Connecticut and Yale University’s Institutional Review Boards. Parents signed consent for child participation prior to the start of the study.
Standardized assessments were used to provide descriptive data regarding the participants’ language abilities. Considering language as a continuous construct and to account for children who demonstrate lower language performance at an early age, 7% of the sample included children demonstrating language delay (4 participants; Rescorla, Roberts, & Dahlsgard, Citation1997). Children with language delay were identified by a standard score of <85 on the Total Language Index of the Preschool Language Scale-Fifth Edition (PLS-5; Zimmerman, Steiner, & Pond, Citation2011). Children with no history of delay met all developmental milestones within the average range as indicated by parent report and presented average speech and language scores within the assessments administered. Typically developing children were considered to have average language skills based on the Total Language Score on the PLS-5 as well as average visual reception on the Mullen Scales of Early Learning (see for mean standard scores on behavioral assessments). The sample included 44 Caucasian participants, 6 Black participants, 1 Hispanic participant, 5 Asian/Pacific Islander participants and 2 participants who identified as “Other” in terms of ethnicity.
Table 1. Language and cognitive assessment scores for sample
Procedures
A parent completed a background questionnaire regarding medical and audiological history as well as information on motor and language developmental milestones. The children participated in 1–2 visits. Each visit lasted approximately 120 minutes. Children first completed a battery of standardized measures and conventional language sampling to determine current language skills. Children who were unable to complete the language sample in the lab were given the Language ENvironmental Analysis System (LENA; LENA Foundation, Citation2014) device, a digital language processor in the home to obtain a naturalistic sample of language; parents were asked to return the device two weeks later. Next, they participated in the ERP task. Throughout the visit, children were provided with breaks and reinforcements (e.g., small edibles, stickers, books) as needed.
Behavioral speech and language assessment
Commonly used clinical speech and language assessments were administered including standardized assessment, parent report, and language sampling (Crais, Citation2011). The PLS-5 was utilized to provide information on receptive and expressive language skills. The Goldman–Fristoe Test of Articulation-2 (GFTA-2; Goldman & Fristoe, Citation2000) was administered to obtain information regarding the child’s articulation abilities. The visual reception portion of the Mullen Scales of Early Learning (Mullen, Citation1995) was also administered to provide information regarding nonverbal skills as they pertain to patterns, memory, and sequencing. The MacArthur-Bates Communicative Development Inventories-2 (mCDI-2; Fenson et al., Citation2007) was utilized as a parent report of vocabulary development; raw scores from the mCDI-2 were used as a measure of vocabulary production because the age of some of the participants (n = 13) extended beyond that of the normative sample.
Additionally, a language sample of approximately 50 utterances was collected for each participant (Heilmann et al., Citation2010). Conventional language sampling procedures during a play-based communicative exchange were used to gather a representative sample of the child’s language in the laboratory setting. If a sample could not be collected in the lab, a LENA device was used to collect a sample within the home environment. For 10 participants, samples were gathered in both the lab and at home with the LENA system to determine comparability among home and lab samples. There was no significant difference in mean length of utterance (MLU) collected from the home (M = 2.72, SD = 0.90) compared to the MLU collected at the lab (M = 2.48, SD = 1.11); t(9) = 1.29, p = .23). Laboratory samples were used for the final analysis for children who provided both samples.
Trained research assistants transcribed the language samples according to conventional transcription procedures. Computerized Profiling v9.7 was used to analyze the transcriptions. A Language Assessment Remediation and Screening Procedure (LARSP; Crystal, Fletcher, & Garman, Citation1989) provided an MLU in morphemes, which was used as a behavioral measure of morphosyntactic complexity and utterance length. Inter-rater reliability checks were performed on randomly selected participants (50% of the participant pool). A second trained transcriber re-analyzed the sample to account for accurate transcription of all words produced by the child and calculated the similarity between the initial transcriber and the second transcriber. Inter-rater reliability for words produced was 86%.
ERP procedures
Children were fitted with a 128-sponge Ag/AgCl electrode high-density sensor array net (EGI, Inc.) that was used to record electrophysiological data. The net was soaked for 10 minutes in a warm potassium-chloride (KCl) solution to improve conductance and then fitted on the child’s head using standard procedures outlined by EGI (Dien, Citation2010). EEG data were recorded using Net Station v.4.5 software (EGI Inc.) with an EGI Net Amps 300 high impedance amplifier, at a sample rate of 500 Hz. All electrode impedances remained under 40kΩ as indicated by impedance measures made immediately before and after the test sessions. Children sat on their caregiver’s lap in a comfortable chair. A small portable DVD player was located 50 inches in front of the child. The DVD player displayed a silent movie (clips of Yo Gabba Gabba! Puppets) that facilitated compliance and attention.
ERP task
Participants were presented with two pseudoword speech tokens, /bidu/ and /ɡibu/, in an old/new design. The stimuli were recorded by a female native English speaker. The first block was a sensitization block, which consisted of one token (/ɡibu/), repeated for 50 trials, followed by 20 second rest-delay. The second block was a mixed block during which 100 tokens were randomly presented, including 50 /bidu/ (or “new” token), and 50 /ɡibu/ (the repeated or “old” token). Data from the second block were used for the P1 and N2 analysis. The auditory stimulus was presented via an overhead speaker positioned above the participant (distance from the floor to the speaker 190 cm) presented at 85 dB SPL. The stimulus duration for each token was 595 ms with a varied ISI of 1800 or 2800 ms to avoid habituation.Footnote1 E-Prime v.2.0 (PST, Inc.) was used to control stimulus presentation and record stimulus onsets in Net Station. ERPs were time- locked to the onset of the stimulus. The experiment was 10 minutes long.
ERP processing
EEG data were analyzed using the EEGLAB v2019.1 toolbox (Delorme & Makeig, Citation2004) except as noted below. As data from some participants were contaminated with line noise, notch filters were applied at line frequencies (60, 120, 180, and 240 Hz; order = 180). Next, the PREP pipeline (Bigdely-Shamlo et al., Citation2015) was used to identify electrodes that were bad throughout data collection (all active electrodes were considered candidates for replacement except for channels 125–128, which are located below and next to the eyes, and were never replaced at this stage); these electrodes were replaced using spherical spline interpolation (Perrin, Pernier, Bertrand, & Echallier, Citation1989); the mean number of electrodes replaced was 6.00 SD = 3.67, range = [0–14]). Data were band-pass filtered from 0.3 to 30 Hz (Butterworth filter, 12 db./oct roll-off); re-referenced to the average reference (the vertex reference, Cz, was used during recording); segmented into 700 ms epochs including a 100 ms pre-stimulus baseline and a 600 ms post-stimulus interval; and baseline-corrected using the mean of the pre-stimulus window (Junghofer, Elbert, Tucker, & Braun, Citation1999). The horizontal electrooculogram (HEOG) was measured as the difference between channels 125 and 128, and the vertical electrooculogram (VEOG) was represented by four pairwise differences between channels 126 and 8, 126 and 14, 127 and 21, and 127 and 25.
Artifact detection and trial averaging were performed using the ERPLAB 7.0 toolbox (Lopez-Calderon & Luck, Citation2014). Epochs were marked as containing ocular activity if HEOG activity (max-min) exceeded 55 μV within a sliding 80-ms window (indicating a lateral eye movement) or if VEOG activity in any of the four electrode pairs (max-min) exceeded 150 μV within a sliding 80-ms window (indicating a blink); these epochs were not analyzed further. Subsequently, automated routines marked an electrode as bad in an epoch if its activity (max-min) within that epoch exceeded 200 μV. If an epoch contained more than 10 bad electrodes, the epoch was marked as bad and excluded from analyses. Otherwise, if an electrode was marked as bad in more than 40% of epochs, data from that electrode were interpolated in all epochs using spherical spline interpolation (no participant had more than two electrodes interpolated at this stage, and no electrodes in the cluster described below were interpolated for any participant). If an electrode was marked as bad in fewer than 40% of epochs, it was interpolated only in epochs in which it was bad (affecting an average of 0.6% of the data across participants; range = 0.0–2.1%, SD = 0.4%; no electrodes in the cluster described below were interpolated on more than 4% of trials for any participant). All interpolations for a given epoch were performed simultaneously. (This interpolation step was accomplished using custom MATLAB code modeled after the “Bad Channel Replacement” routine in EGI Net Station Tools.)
Finally, artifact-free segments were averaged within the old and new conditions. A criterion of at least 20 preserved trials within at least 1 condition was used to include participants in the ERP analysis.Footnote2 There was no significant difference in the number of good trials preserved between the old condition (M = 34.60, SD = 7.18) and the new condition (M = 34.76, SD = 8.21); t(57) = −0.26, p = .80).
ERP analysis method
Data were visually inspected for peak identification of the P1 and N2 components. Electrodes and time windows of interest were chosen as in prior studies (Ceponiene, Citation2003; Landi et al., Citation2012; Wunderlich & Cone-Wesson, Citation2006). The P1 and N2 components were identified visually in a cluster of six electrodes in the medial-central region (see for electrode montage). Within this cluster, custom code was used to identify the most positive peak occurring between 50 and 200 ms post-stimulus onset (P1) and the most negative peak occurring between 200 and 300 ms (N2). Adaptive mean amplitude was computed as the average amplitude within ±50 ms of the peak within each condition (old and new) for P1 and N2 timeframes separately. Peak latency was also obtained for each condition and component. The averaged data from these six electrodes was used for data analysis.
Figure 1. Electrode montage for P1 & N2. The six electrodes analyzed in the component-driven analyses (Section 3.1) are shaded green. The 29 electrodes that contributed to the cluster in the data-driven analyses (Supplemental Materials 1) are surrounded by a dashed line and shaded gray.
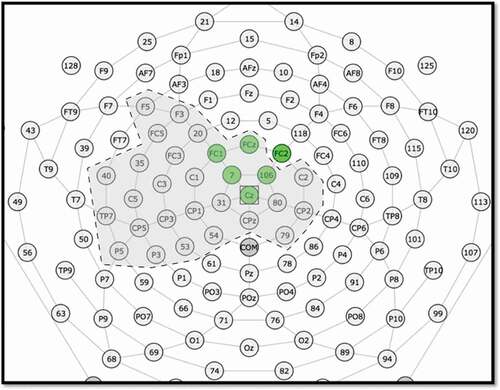
This component-driven analysis allowed us to test a-priori hypotheses regarding well-studied ERP components present in the data. However, component-driven analyses necessarily required subjective decisions about which electrodes to include in the analysis, how peaks for each individual should be measured, and how to combine information from multiple measures of language performance. Thus, we supplemented the component-driven analysis with an additional cluster-based permutation test that reduced analytic degrees of freedom while simultaneously showing when and where the relationship between language measures and the stimulus novelty effect was strongest. Please see Supplemental Materials 1 for a description and results of the cluster-based analyses.
Language factor score
Factor analysis is a statistical method used to derive the shared variance among multiple variables and reduce the number of variables (factors). For the current study, factor analysis was beneficial for two reasons: 1) Single language variables for young children are limited in sensitivity; therefore, a factor analysis was used to identify factors that encompass similarities among multiple language and speech measures; 2) Using one variable rather than several limits Type I error while eliminating the need to control for multiple comparisons. Prior to performing factor analysis, predictive mean matching (PMM) was performed using Hmisc package in R to impute random missing behavioral data for 13 children who did not have full data sets (Little, Citation1988). PMM imputes missing values by means of the nearest-neighbor donor with distance based on the expected values of the missing variables conditional on the observed covariates. One thousand imputations were run and averaged to impute each missing value. As there were five behavioral measures, a maximum of two missing values per participant was permitted for PMM.
Following PMM, a factor analysis was run on the five language measures using an oblique rotation as correlated factors were expected. The following measures were included in the factor analysis: 1) total number of words reported by the parent of the mCDI-2, 2) raw score on the auditory comprehension portion of the PLS-5, 3) raw score on the expressive portion of the PLS-5, 4) the number of errors produced on the GFTA-2 (reverse coded/multiplied by −1) and 5) MLU. Raw scores on the PLS-5 and GFTA-2 were used due to other non-standardized variables in the analysis such as total words reported on the mCDI-2 and MLU. A scree plot suggested the presence of one latent factor with an eigenvalue above 1. The commonality, or proportion of variance contributed by the common factor, is 63.8% (see for factor loadings). The factor score was calculated based on the factor loadings (termed Language Factor Score, LFS hereafter) thereby summarizing the five behavioral measures into one broad measure of language for each participant.
Table 2. Factor pattern for language factor score (LFS)
Statistical analyses
Partial correlation analyses, controlling for age, were conducted to determine the relationship between ERP response (P1 and N2 amplitude and latency differences between the new and old conditions) and measures of language. By controlling for age, we were able to determine if a relationship existed among ERP data and language skills without the influence of age. First, correlations were run among the ERP data and the LFS. If a significant correlation was present within the amplitude domain and/or latency domain and the LFS, further analyses were run with each speech/language test to determine the relationship among ERP data (within amplitude or latency domain) and individual measures of language. This method reduced the number of correlations on the same data set and therefore reduced the likelihood of Type I error. Holm-Bonferroni Sequential Correction was used to adjust for multiple correlations among individual tests (Holm, Citation1979).
Results
P1, N2, and language performance
To contrast the amplitude of the old and new conditions we subtracted the amplitude of the old tokens from the new tokens (i.e., new minus old) within the P1 timeframe (50–200 ms) and the N2 timeframe (200–300 ms) separately for each participant. A paired samples t-test was conducted to determine if the amplitude between the old and new conditions within the P1 and N2 timeframes were significantly different. On average, there was no significant difference between the amplitude within the old condition and new condition within the P1 timeframe (t(56) = 0.92, p = .36) or the N2 timeframe (t(57) = 0.12, p = .91). For P1 and N2 latency, we subtracted the peak latencies of the old tokens from the new tokens (i.e., new minus old) for the P1 and N2 timeframes separately for each participant. There were no significant differences in latency between the old and new conditions within the P1 timeframe (t(56) = 0.23, p = .82) nor within the N2 timeframe (t(57) = 0.24, p = .81). Please see for data on mean amplitudes, latencies, and difference effects for each condition. See for grand average ERP waveforms, and for ERPs binned by LFS quartile for ease of visualization.
Table 3. Mean amplitude and latency data for P1 and N2 ERPs for old and new conditions
Figure 2. Grand average ERP waveforms for six-electrode montage for old and new conditions averaged across cluster and within individual electrodes.
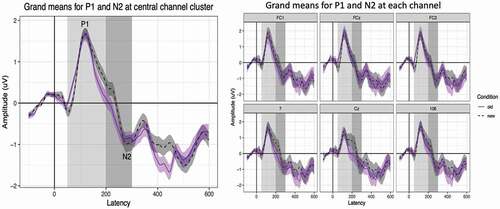
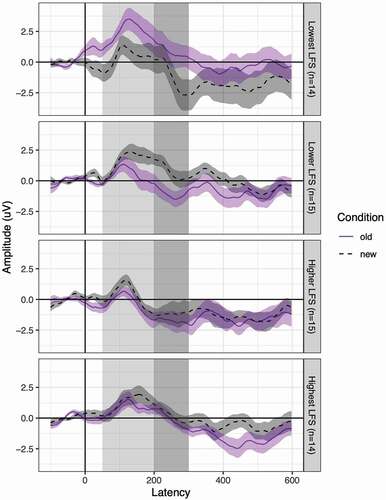
Figure 3. Average ERP waveforms at the six-electrode montage for old and new conditions. Waveforms are binned by LFS quartile for ease of visualization. The time windows used in identifying P1 and N2 peaks for each participant are highlighted in light and dark gray, respectively. Error ribbons = 1 SEM.
There was a significant positive partial correlation (controlling for age) between the P1 amplitude difference and the LFS (r(54) = .32, p = .02) suggesting that higher language scores were associated with increased positivity to the new stimuli relative to the old stimuli. In turn, children with lower language scores demonstrated less positivity to novel stimuli. The P1 amplitude difference explained approximately 10% of the variance within the LFS when controlling for age (r2 = .10). Following the analyses of the LFS, analyses were conducted to establish the relationship between the P1 amplitude difference and the individual language measures. We observed a significant positive partial correlation, controlling for age, between the P1 amplitude difference and the PLS-5 Expressive Communication Index (r(54) = .35, p = .01). A significant negative partial correlation was present among the P1 amplitude difference and speech sound production on the GFTA-2, (r(54) = −.43, p = .001). Given that the raw scores for the GTFA-2 represent speech sound errors produced by the participants, the nature of this correlation suggests that fewer articulation errors (i.e., more accurate speech sound productions) are associated with increased positivity for the new stimulus relative to the old stimulus.
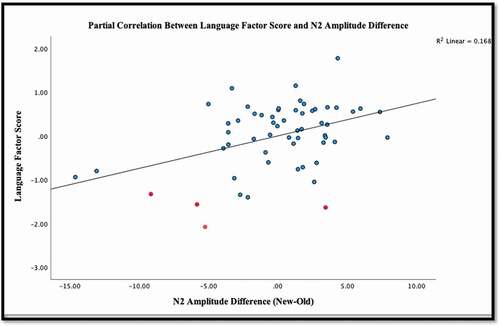
Similar patterns were found between amplitude differences within the N2 timeframe. There was a significant partial correlation controlling for age within the N2 timeframe and the LFS (r(55) = .41, p = .001). The N2 amplitude difference explained approximately 17% of the variance within the LFS (r2 = .17). Partial correlations, controlling for age, were then run between the N2 amplitude difference and the individual language measures. Significant positive correlations were present among the N2 amplitude difference and the PLS-5 Expressive Communication Scale (r(55) = .40, p = .001) as well as the PLS-5 Auditory Comprehension Scale (r(55) = .36, p = .004). These correlations suggest that children with higher language scores demonstrated increased positivity for new stimuli in relation to the old stimuli. A significant negative correlation was present among the N2 amplitude difference and number of articulation errors present on the GFTA-2 (r(55) = −.43, p < .001) meaning that fewer articulation errors were associated with greater positivity for the new stimulus relative to the old stimulus. (See for correlations and for correlation plot. See Supplemental Materials 2 for correlation plot of individual language measures and ERP amplitude differences.)
Table 4. Partial correlations among language measures and the P1 and N2 ERP components
Figure 4. Partial correlations between the language factor score and n2 amplitude difference.
No significant correlations were observed between latency differences within the P1 timeframe (r(54) = .084, p = .53) or the N2 timeframe (r(55) = −.13, p = .33) with the LFS within this electrode cluster. Further correlations were not run on individual speech and language measures due to the non-significant correlations with the LFS.
As shown in , there was some evidence that the relationship between LFS and the novelty effect began early, possibly even in the pre-stimulus (baseline) window. Accordingly, we ran an additional analysis to determine whether the relationship between LFS and the novelty effect in the baseline could account for the observed relationships in component windows. First, we ran correlations (as above) at every latency in the baseline window to determine the time window in which the LFS predicted the novelty effect (after controlling for age) in the same direction as in the component time windows; a significant relationship (uncorrected p < .05) was observed between −16 and 0 ms. Next, we averaged over those latencies to compute each participant’s mean baseline novelty effect, and then included these baseline novelty effects as an additional predictor (along with LFS and age) of component novelty effects. With this additional control, LFS remained a significant predictor of stimulus novelty in the N2 time window, r(54) = 0.29, p = .01, but not in the P1 time window, r(53) = 0.20, p = .12. Accordingly, we can rule out the possibility that spurious differences in pre-stimulus activity between participants can account for the relationship between LFS and the novelty effect reported in the N2 time window, but not the P1 time window.
Interpreting the effect of stimulus novelty
To determine whether the observed effect truly indexes stimulus novelty or whether it can be entirely ascribed to perceptual differences in ERP responses to the stimulus tokens linear mixed-effects modeling (lme4 v. 1.1–21; Baayen et al., Citation2008) was used to determine if the amplitude in the original block (block 1, 50 repetitions of /ɡibu/ only) demonstrated increasingly more negative μV over the course of block one as repetitions and trial number increased. If this is the case, then it can be determined that the “new-old” effect demonstrated in block 2 (/bidu/ “new” demonstrating more positive μV than /ɡibu/ “old”) is indicative of a new stimulus effect. Results of the model revealed that increased familiarity with a single stimulus (/ɡibu/ original) was associated with a significant negative shift in N2 amplitude – but not P1 amplitude – as trial number increased (P1: B = −0.014, SE = 0.021, t(116) = −0.63, p = .528; N2: B = −0.049, SE = 0.021, t(114) = −2.29, p = .024), though this effect did not interact with language scores (all ps > .37). Importantly, the significant group-level effect of trial number was observed at the same component for which – even after controlling for baseline activity – higher language scores were significantly associated with more positive effects of stimulus novelty (or, phrased differently, more negative effects of stimulus familiarity). Accordingly, that effect of stimulus novelty cannot be reduced to differences in processing the speech tokens /bidu/ and /ɡibu/. (See Supplemental Materials 3 for a detailed description of these single-trial analyses.)
Discussion
Early ERP components and associations with language
The present study examined ERPs in response to pseudoword speech tokens in an old/new design to contrast neural responses to repeated vs. novel phonological information in a sample of toddlers. Amplitude differences between the repeated or “old” stimuli relative to the “new” stimuli were related to expressive language, receptive language and speech sound production. Specifically, for the N2 component, more positive amplitudes for the new as opposed to the old stimuli (or less negativity for the novel stimulus), were associated with higher receptive and expressive language skills measured by the PLS-5, and fewer speech sound errors measured by the GFTA-2. Conversely, the analyses also revealed that children with lower language skills demonstrated less positivity to the novel stimuli. Greater positivity to new as opposed to old stimuli for the P1 was also associated with better expressive language skills measured by the PLS-5 and fewer speech sound errors on the GFTA-2. However, the P1 effect did not remain significant after accounting for differences in ERP baseline activity. Therefore, the discussion will focus on effects that remained significant within the N2 component.
Consistent with previous work, these findings suggest that early ERPs (prior to 300 ms) index phonemic properties of the acoustic signal. Our findings suggest that greater positivity for the novel stimulus relative to the old stimulus is related to greater language ability. Thus, children with higher language skills showed less negativity for a novel stimulus within the N2 component compared to children with lower language skills. This pattern of less negative N2 responses for controls or individuals with higher language skills has also been seen in investigations of children with prenatal cocaine exposure (Landi et al., Citation2012), dyslexia (Bonte & Blomert, Citation2004), and SLI (McArthur & Bishop, Citation2004). This may reflect reduced effort during phonological processing for children with higher language abilities. In turn, children with lower language abilities may require increased neural effort to access phonological representations necessary for processing changes in phonological stimuli. In general, an association between the auditory N2 and individual differences in language is consistent with previous literature, including Molfese (Citation2000), who found that a negative deflection occurring at approximately 200 ms within infants predicted language and reading measures further along the developmental trajectory.
A second clinically significant finding was that fewer speech sound errors were associated with greater positivity (or less negativity) to the novel stimulus relative to the old stimulus within the N2 timeframe. This finding is consistent with other studies of children suggesting that speech perception skills are linked to more accurate speech sound production. Indeed, a recent meta-analysis Hearnshaw, Baker, and Munro (Citation2019), concluded that children with speech production difficulties frequently demonstrate deficits in speech perception. Attention to key acoustic information in speech may allow for strong categorical perception skills, which in turn may influence motor representations (Walker & Hickok, Citation2016). In general, our findings reveal a relationship between perception and production indexed by early ERP responses within children between 24 and 48 months.
Although significant correlations were observed between ERPs and the Auditory Comprehension and Expressive Communication scales of the PLS-5, as well as speech sound production on the GFTA-2, no significant associations were observed for words produced on the mCDI-2 or MLU. The relationship between words produced on the mCDI-2 and the N2 amplitude however approached significance (p = .067). It is possible that the mCDI-2 did not comprehensively measure expressive vocabulary for this sample of children, or that expressive vocabulary may be related to other neural mechanisms. Similarly, it is possible that measures such as MLU, gathered from conventional transcription, or parent report, lack the sensitivity of standardized measures of language.
The current findings are consistent with our previous findings, reported in Harwood et al. (Citation2017). ERPs indexing phonological sensitivity are associated with clinically relevant speech and language skills observed in 2- and 3-year-old children. Harwood et al. (Citation2017) found that latency differences within a P3a component and an early negative deflection (136–220 ms within a left temporal montage) differentially explained a significant proportion of variance in language skill. The current study adds to the literature by examining the P1 and N2 ERP components within an overlapping sample of 58 typically developing toddlers and identifying a significant relationship between the N2 and clinically relevant assessments of speech and language. .
While we did not observe latency effects here, as we did in our previous report with a partially overlapping sample, the amplitude effect provides additional information regarding the nature of ERPs for indexing phonemic processing within children. Further, the present study included a larger sample of children and focused on a-priori selected ERP components (P1 and N2) rather than the principal components analysis-derived temporal-spatial components. Data-driven approaches and the peak-based statistical methods can provide complementary information. Within this study, the peak-based method allowed us to link our findings with previous studies that established the presence of the P1 and N2 auditory components with young children (Čeponien et al., Citation2003), and those that have linked the N2 to individual differences in language (e.g., Molfese, Citation2000). ERP studies involving children often interpret results at the group level and establish differences between typically developing and clinical populations. This study may provide clinically relevant insights regarding individual differences in ERPs in young children and their associations with language. Further, we expand upon meaningful ERP methodologies (both the data-driven approach and peak-based method) that can provide unique insight into both electrophysiological and behavioral markers of language in young children
The current findings are consistent with theories, which posit that strong speech perception skills lay the foundation for speech-related processes, including production (Hickok, Citation2012). They are also consistent with the idea that well-developed speech perception skills enable language learning such that parsing the speech stream, speech sound production, word learning, and eventually morphosyntactic learning stem from early appropriate categorization of phonological units (Jusczyk & Bertoncini, Citation1988). While our findings imply the importance of phonemic perception for language learning, it is important to acknowledge that speech perception in the context of a child’s language environment is a complex, multi-sensory process that includes the integration of auditory, visual, and kinesthetic aspects of learning (Pegg, Werker, & McLeod, Citation1992).
Clinical implications
This work has implications for clinical assessment and intervention for children with language impairment. Regarding assessment, relations between phonological processing and language production imply that clinicians should consider measures of perceptual skills in assessment batteries for young children. In addition to our findings, other studies have linked electrophysiological measures of perception to a variety of developmental disorders including specific language impairment (Basu, Krishnan, & Weber-Fox, Citation2010), (central) auditory processing disorders (Rocha-Muniz, Befi-Lopes, & Schochat, Citation2012), dyslexia (Banai et al., Citation2009; Billiet & Bellis, Citation2011), and attention deficit hyperactivity disorders (Azzan & Hussan, Citation2010). ERPs which measure sensitivity to changes in the phonological structures of language (i.e., early components such as MMN, P1, N1, P2, or N2) may provide a measure of phonological processing that is difficult to obtain with young children using behavioral methods. Although ERP measures of perception do not yet demonstrate qualities of diagnostic accuracy similar to those of behavioral assessment of language, establishing covariance between ERPs and clinical measures of language functioning is an essential first step. Next stages might include examining psychometric properties of ERPs and calculating measures of sensitivity and specificity (which are measures critical for all assessments). As the paradigms are refined, it is possible that ERPs could provide useful clinical information regarding aspects of speech perception.
Regarding intervention, our results suggest that children who demonstrated lower language skills may require increased effort to detect changes in phonological stimuli. Currently, many of the language interventions used with young children focus on whole word approaches and expanding general expressive language skill. This approach underweights the importance of sub-lexical phonetic and phonemic perceptual processes (i.e., perception and discrimination of phonological contrasts). Input-focused interventions (e.g., Bruinsma, Wijnen, & Gerrits, Citation2020; Rvachew & Brosseau-Lapré, Citation2015) may be a way to orient young children to the salient features of speech, improve phonological representations, increase phonological awareness, and support general language ability. These interventions have the potential to not only support early language development but also stave off language learning disabilities, such as dyslexia, which may occur later in childhood. Both whole word approaches and input-focused phonemic interventions have their respective benefits, however, and it is yet to be determined if one approach is more efficacious then the other.
Limitations and future directions
These findings should be considered in the context of a few limitations. First, it should be reiterated that the current sample overlaps partially with the sample of children included in Harwood et al. (Citation2017), therefore the samples are not independent; replication with an independent sample would further validate these findings. Moreover, while our sample is large for an ERP study of toddlers and included children with a range of language skills, our sample of 58 children included only four with demonstrated language delay. Future studies that include more children with language delays would extend the clinical relevance of these findings.
Second, our experimental stimuli were not counterbalanced; therefore, the effect of stimulus novelty should be interpreted with caution. The analysis of the baseline block suggests increased negativity within the N2 as a sign of learning; however, the possibility remains that the difference effect within the analysis block is at least partially driven by acoustic/phonetic properties of the stimulus. Third, condition differences in pre-stimulus activity correlated with language scores, complicating the interpretation of the P1 component and cluster analyses. However, relationships between language scores and the N2 component remained significant even after controlling for baseline activity. Further investigation into the P1 ERP component and its relationship to language in young children is needed. Fourth, the mCDI-2 was used beyond the age limit for which it was intended for 13 children in our sample and therefore may not be comprehensively measuring vocabulary for the children between 36 and 48 months. Finally, the literature on ERPs in the toddler/young child population is limited (Borgström et al., Citation2016; Kuhl et al., Citation2005), which restricts the context for guiding analyses and interpreting data. Further studies are necessary to inform on ERP measures of speech perception and developmental changes with children in this age range.
General conclusions
In this study, we demonstrated P1 and N2 auditory ERP components in response to repeated spoken pseudowords in children aged 24–48 months and explored the relationship between these components and clinical measures of language. We found that amplitude differences between repeated and novel stimuli within the N2 timeframe were associated with speech and language abilities. This work extends upon previous work that has linked early auditory ERPs in infancy to individual differences in later language and literacy (e.g., Kuhl et al., Citation2008; Molfese, Citation2000). These findings suggest that phonemic sensitivity, measured by the N2 component, may reflect the integrity of neural networks that are important for speech perception and production in young children.
Acknowledgments
We would like to thank all the undergraduate students, graduate student, and research assistants who supported this project as well as all of the families and children that participated in Haskins LEARN study. Special thanks to Dr. Bernard Grela, Dr. Michael Harwood, and Dr. Gavino Puggioni who provided statistical support.
Disclosure statement
No potential conflict of interest was reported by the author(s).
Additional information
Funding
Notes
1. Jittered ISI was used to reduce short-term sensory habituation. The authors acknowledge that it may not fully remove habituation effects across the full 50 block trial.
2. Three participants within the data set presented obtained less than 20 trials in one condition (participant 1: 22 old, 17 new; participant 2: 18 old, 22 new; participant 33: 24 old, 19 new).
References
- American Academy of Pediatrics, 2021. Healthychildren.org. Available at: https://www.healthychildren.org/English/ages-stages. Accessed 30 April, 2021
- Archibald, L., & Joanisse, M. (2012). Atypical neural response to phonological detail in children with developmental language impairements. Developmental Cognitive Neuroscience, 2, 139–151. doi:https://doi.org/10.1016/j.dcn.2011.07.003
- Asano, M., Imai, M., Kita, S., Kitajo, K., Okada, H., & Thierry, G. (2015). Sound symbolism scaffolds language development in preverbal infants. Cortex, 63, 196–205. doi:https://doi.org/10.1016/j.cortex.2014.08.025
- Azzan, H., & Hussan, D. (2010). Speech evoked auditory potentials in attention deficit hyperactivity disorder. Audiological Medicine, 8(3), 129–136. doi:https://doi.org/10.3109/1651386X.2010.499738
- Baayen, R. H., Davidson, D. J., & Bates, D. M. (2008). Mixed-effects modeling with crossed random effects for subjects and items. Journal of Memory and Language, 59(4), 390–412.
- Banai, K., Hornickel, J., Skoe, E., Nicol, T., Zecher, S., & Kraus, N. (2009). Reading and subcortical auditory function. Cerebral Cortex, 19(11), 2699–2707. doi:https://doi.org/10.1093/cercor/bhp024
- Basu, M., Krishnan, A., & Weber-Fox, C. (2010). Brainstem correlates of temporal auditory processing in children with specific language impairment. Developmental Science, 13(1), 77–91. doi:https://doi.org/10.1111/j.1467-7687.2009.00849.x
- Bigdely-Shamlo, N., Mullen, T., Kothe, C., Su, K. M., & Robbins, K. A. (2015). The PREP pipeline: Standardized preprocessing for large-scale EEG analysis. Frontiers in Neuroinformatics, 9, 16.
- Billiet, C., & Bellis, T. (2011). The relationship between brainstem temporal processing and performance on tests of central auditory function in children with reading disorders. Journal of Speech Language and Hearing Research, 54(1), 228–242. doi:https://doi.org/10.1044/1092-4388(2010/09-0239)
- Bonte, M. L., & Blomert, L. (2004). Developmental dyslexia: ERP correlates of anomalous phonological processing during spoken word recognition. Cognitive Brain Research, 21(3), 360–376. doi:https://doi.org/10.1016/j.cogbrainres.2004.06.010
- Borgström, K., Torkildsen, J. V. K., & Lindgren, M. (2016). Visual event-related potentials to novel objects predict rapid word learning ability in 20-month-olds. Developmental Neuropsychology, 41(5–8), 308–323. doi:https://doi.org/10.1080/87565641.2016.1243111
- Bruinsma, G., Wijnen, F., & Gerrits, E. (2020). Focused stimulation intervention in 4-and 5-year-old children with developmental language disorder: Exploring implementation in clinical practice. Language, Speech, and Hearing Services in Schools, 51(2), 247–269. doi:https://doi.org/10.1044/2020_LSHSS-19-00069
- Čeponien, R., Lepistö, T., Alku, P., Aro, H., & Näätänen, R. (2003). Event-related potential indices of auditory vowel processing in 3-year-old children. Clinical Neurophysiology, 114(4), 652–661. doi:https://doi.org/10.1016/S1388-2457(02)00436-4
- Čeponiené, R., Shestakova, A., Balan, P., Alku, P., Yiaguchi, K., & Naatanen, R. (2001). Children’s auditory Event-Related Potentials index sound complexity and “speechness.” International Journal of Neuroscience, 109(3–4), 245–260. doi:https://doi.org/10.3109/00207450108986536
- Crais, E. (2011). Testing and beyond: Strategies and tools for evaluating and assessing infants and toddlers. Language Speech and Hearing Services in Schools, 42(3), 341–364. doi:https://doi.org/10.1044/0161-1461(2010/09-0061)
- Crystal, D., Fletcher, P., & Garman, M. (1989). Grammatical Analysis of Language Disability- (2nd Edition. ed.). London: Cole and Whurr.
- Delorme, A., & Makeig, S. (2004). EEGLAB: An open source toolbox for analysis of single-trial EEG dynamics including independent component analysis. Journal of Neuroscience Methods, 134(1), 9–21. doi:https://doi.org/10.1016/j.jneumeth.2003.10.009
- Dien, J. (2010). The ERP PCA Toolkit: An open source program for advanced statistical analysis of event related potential data. Journal of Neuroscience, 187(1), 138–145.
- Eimas, P., Siqueland, E., Jusczyk, P., & Vigorito, J. (1971). Speech perception in infants. Science, 171(3968), 303–306. doi:https://doi.org/10.1126/science.171.3968.303
- Fenson, C., , (2007). MacArthur-Bates Communicative Development Inventories. Baltimore, MD: Paul H. Brookes Publishing Company.
- Foundation, L. (2014) Retrieved from lena foundation.org: www.lenafoundation.org
- Friedrich, M., & Friederici, A. D. (2015). The origins of word learning: Brain responses of three-month-olds indicate their rapid association of objects and words. Developmental Science, 20(2), e12357. doi:https://doi.org/10.1111/desc.12357
- Garcia-Sierra, A., Ramírez-Esparza, N., & Kuhl, P. K. (2016). Relationships between quantity of language input and brain responses in bilingual and monolingual infants. International Journal of Psychophysiology, 110, 1–17. doi:https://doi.org/10.1016/j.ijpsycho.2016.10.004
- Goldman, R., & Fristoe, M. (2000). Goldman Fristoe Test of Articulation. Circle Pines, MN: AGS.
- Harwood, V., Preston, J., Grela, B., Roy, D., Harold, O., Turcios, J., & Landi, N. (2017). Electrophysiology of perception and processing of phonological information as indices of toddlers’ language performance. Journal of Speech, Language, and Hearing Research, 60(4), 999–1011. doi:https://doi.org/10.1044/2016_JSLHR-L-15-0437
- Hearnshaw, S., Baker, E., & Munro, N. (2019). Speech perception skills of children with speech sound disorders: A systematic review and meta-analysis. Journal of Speech, Language, and Hearing Research, 62(10), 3771–3789. doi:https://doi.org/10.1044/2019_JSLHR-S-18-0519
- Heilmann, J., Nockerts, A., & Miller, J. (2010, october). Language sampling: Does the length of the transcript matter? Language, Speech, and Hearing Services in Schools, 41(4), 393–404. doi:https://doi.org/10.1044/0161-1461(2009/09-0023)
- Hickok, G. (2012). Computational neuroanatomy of speech productions. Nature Reviews Neuroscience, 13(2), 135–145. doi:https://doi.org/10.1038/nrn3158
- Holm, S. (1979). A simple sequentially rejective multiple test procedure. Scandinavian Journal of Statistics, 65–70.
- Joanisse, M., & Seidenberg, M. (2003). Phonology and syntax in specific language impairment: Evidence from a connectionist model. Brain and Language, 86(1), 40–56. doi:https://doi.org/10.1016/S0093-934X(02)00533-3
- Junghofer, M., Elbert, T., Tucker, D., & Braun, C. (1999). The polar average reference effect: A bias in estimating the head surface integral in EEG recording. Clinical Neurophysiology, 110(6), 1149–1155. doi:https://doi.org/10.1016/S1388-2457(99)00044-9
- Jusczyk, P., & Bertoncini, J. (1988). Viewing the development of speech perception as an innately guided learning process. Language and Speech, 31(3), 217–238. doi:https://doi.org/10.1177/002383098803100301
- Karhu, J., Herrgård, E., Pääkkönen, A., Luoma, L., Airaksinen, E., & Partanen, J. (1997). Dual cerebral processing of elementary auditory input in children. Neuroreport, 8(6), 1327–1330. doi:https://doi.org/10.1097/00001756-199704140-00002
- Kuhl, P. K., Conboy, B. T., Coffey-Corina, S., Padden, D., Rivera-Gaxiola, M., & Nelson, T. (2008). Phonetic learning as a pathway to language: New data and native language magnet theory expanded (NLM-e). Philosophical Transactions of the Royal Society B: Biological Sciences, 363(1493), 979–1000.
- Kuhl, P. K., Conboy, B. T., Padden, D., Nelson, T., & Pruitt, J. (2005). Early speech perception and later language development: Implications for the” critical period”. Language Learning and Development, 1(3–4), 237–264.
- Kuhl, P., Conboy, B., Padden, D., Rivera-Gaxiola, M., & Nelson, T. (2008). Phonetic learning as a pathway to language: New data and the native language magnet theory expanded (NLM-e). Philosophical Transactions: Biological Sciences, 363, 979–1000.
- Kuhl, P., Stevens, E., Hayshi, A., Deguchi, T., Kiritani, S., & Iverson, P. (2006). Infants show a facilitation effect for native language phonetic perception between 6 and 12 months. Developmental Science, 9(2), F13–F21. doi:https://doi.org/10.1111/j.1467-7687.2006.00468.x
- Kuipers, J. R., & Thierry, G. (2015). Bilingualism and increased attention to speech: Evidence from event-related potentials. Brain and Language, 149, 27–32. doi:https://doi.org/10.1016/j.bandl.2015.07.004
- Landi, N., Crowley, M., Wu, J., Bailey, C., & Mayes, L. (2012). Deviant ERP response to spoken non-words among adolescents exposed to cocaine in utero. Brain and Language, 120(3), 209–216. doi:https://doi.org/10.1016/j.bandl.2011.09.002
- Leppanen, P., Hamalainen, J., Guttorm, T., Eklund, K., Salminen, H., Tanskanen, A., … Lyytinen, H. (2011). Infant brain responses associated with reading related skills before and at school age. Clinical Neurophysiology, 42(1–2), 35–41. doi:https://doi.org/10.1016/j.neucli.2011.08.005
- Little, R. J. (1988). Missing-data adjustments in large surveys. Journal of Business & Economic Statistics, 6(3), 287–296.
- Lopez-Calderon, J., & Luck, S. J. (2014). ERPLAB: An open-source toolbox for the analysis of event-related potentials. Frontiers in Human Neuroscience, 8, 213. doi:https://doi.org/10.3389/fnhum.2014.00213
- McArthur, G. M., & Bishop, D. V. M. (2004). Which people with specific language impairment have auditory processing deficits? Cognitive Neuropsychology, 21(1), 79–94. doi:https://doi.org/10.1080/02643290342000087
- Molfese, D. L. (1995). Electrophysiological responses obtained during infancy and their relation to later language development: Further findings. Advances in child neuropsychology (pp. 1–11). New York, NY: Springer.
- Molfese, D. (2000). Predicting dyslexia at 8 years of age using neonatal brain responses. Brain and Language, 72(3), 238–245. doi:https://doi.org/10.1006/brln.2000.2287
- Molfese, D. L., & Molfese, V. J. (1985). Electrophysiological indices of auditory discrimination in newborn infants: The bases for predicting later language development?. Infant Behavior and Development, 8(2), 197–211.
- Molfese, D., & Molfese, V. (1997). Discrimination of language skills at five years of age using event-related potentials recorded at birth. Developmental Neuropsychology, 13(2), 135–156. doi:https://doi.org/10.1080/87565649709540674
- Molfese, D., Molfese, V., & Pratt, N. (2007). The use of event related evoked potentials to predict developmental outcomes. In M. D. Haan (Ed.), Infant EEG and event related potenitals (pp. 200–227). New York, NY: Psychology Press.
- Molfese, D. L., Morse, P. A., & Peters, C. J. (1990). Auditory evoked responses to names for different objects: Cross-modal processing as a basis for infant language acquisition. Developmental Psychology, 26(5), 780–795. doi:https://doi.org/10.1037/0012-1649.26.5.780
- Mullen, E. (1995). Mullen Scales of Early Learning. San Antonio, Texas, USA: NCS Pearson Inc.
- Nittrouer, S., Manning, C., & Meyer, G. (1993). The perceptual weighting of acoustic cues changes with linguistic experience. Journal of the Acoustical Society of America, 94(3), 1865-1865. doi:https://doi.org/10.1121/1.407649
- Pegg, J. E., Werker, J. F., & McLeod, P. J. (1992). Preference for infant-directed over adult-directed speech: Evidence from 7-week-old infants. Infant Behavior and Development, 15(3), 325–345. doi:https://doi.org/10.1016/0163-6383(92)80003-D
- Perrin, F., Pernier, J., Bertrand, O., & Echallier, J. (1989). Spherical splines for scalp potential and current density mapping. Electroencephalography and Clinical Neurophysiology, 72(2), 184–187. doi:https://doi.org/10.1016/0013-4694(89)90180-6
- Ponton, C. W., Eggermont, J. J., Coupland, S. G., & Winkelaar, R. (1992). Frequency-specific maturation of the eighth nerve and brain-stem auditory pathway: Evidence from derived auditory brain-stem responses (ABRs). The Journal of the Acoustical Society of America, 91(3), 1576–1586. doi:https://doi.org/10.1121/1.402439
- Preston, J. L., Felsenfeld, S., Frost, S. J., Mencl, W. E., Fulbright, R. K., Grigorenko, E. L., … Pugh, K. R. (2012). Functional brain activation differences in school-age children with speech sound errors: Speech and print processing. Journal of Speech, Language, and Hearing Research, 55(4), 1068–1082. doi:https://doi.org/10.1044/1092-4388(2011/11-0056)
- Preston, J. L., Frost, S. J., Mencl, W. E., Fulbright, R. K., Landi, N., Grigorenko, E., Jacobsen, L., & Pugh, K. R. (2010). Early and late talkers: School-age language, literacy and neurolinguistic differences. Brain, 133(8), 2185–2195.
- Rescorla, L., Roberts, J., & Dahlsgard, K. (1997). Late talkers at 2: Outcomes at age 3. Journal of Speech Language and Hearing Research, 40(3), 556–566. doi:https://doi.org/10.1044/jslhr.4003.556
- Rivera-Gaxioloa, M., Silva-Pereyra, J., & Kuhl, P. (2005). Brain potentials to native and non-native speech contrasts in 7- and 11-month-old American infants. Developmental Science, 8(2), 162–172. doi:https://doi.org/10.1111/j.1467-7687.2005.00403.x
- Rocha-Muniz, C., Befi-Lopes, D., & Schochat, E. (2012). Investigation of auditory processing disorder and language impairment using the speech-evoked auditory brainstem response. Hearing Research, 294(1–2), 143–152. doi:https://doi.org/10.1016/j.heares.2012.08.008
- Rvachew, S., & Brosseau-Lapré, F. (2015). A randomized trial of 12-week interventions for the treatment of developmental phonological disorder in francophone children. American Journal of Speech-Language Pathology, 24(4), 637–658. doi:https://doi.org/10.1044/2015_AJSLP-14-0056
- Silva, L. A. F., Magliaro, F. C. L., Carvalho, A. C. M., & Matas, C. G. (2017, May). Maturation of long latency auditory evoked potentials in hearing children: Systematic review. In Codas, 29(3), e20160107–e20160107.
- Skeat, J., Eadie, P., Ukoumunne, O., & Reilly, S. (2010). Predictors of parents seeking help or advice about children’s communication development in the early years. Child: Care, Health and Development, 36(6), 878–887. doi:https://doi.org/10.1111/j.1365-2214.2010.01093.x
- Smith, D. I., & Kraus, N. (1988). Intracranial and extracranial recordings of the auditory middle latency response. Electroencephalography and Clinical Neurophysiology/Evoked Potentials Section, 71(4), 296–303. doi:https://doi.org/10.1016/0168-5597(88)90030-5
- Stokes, S., & Klee, T. (2009). The diagnostic accuracy of a new test of early nonword repetition for differentiating late talking and typically developing children. Journal of Speech, Language, and Hearing Research, 52(4), 872–882. doi:https://doi.org/10.1044/1092-4388(2009/08-0030)
- Vihman, M. M. (2017). Learning words and learning sounds: Advances in language development. British Journal of Psychology, 108(1), 1–27. doi:https://doi.org/10.1111/bjop.12207
- Walker, G. M., & Hickok, G. (2016). Bridging computational approaches to speech production: The semantic–lexical–auditory–motor model (SLAM). Psychonomic Bulletin & Review, 23(2), 339–352. doi:https://doi.org/10.3758/s13423-015-0903-7
- Werker, J. F., & Tees, R. C. (1984). Cross-language speech perception: Evidence for perceptual reorganization during the first year of life. Infant Behavior and Development, 7(1), 49–63. doi:https://doi.org/10.1016/S0163-6383(84)80022-3
- Wunderlich, J. L., & Cone-Wesson, B. K. (2006). Maturation of CAEP in infants and children: A review. Hearing Research, 212(1–2), 212–223. doi:https://doi.org/10.1016/j.heares.2005.11.008
- Zimmerman, I., Steiner, V., & Pond, R. (2011). Preschool language scale-fifth edition: examiner’s manual. San Antonio, TX: The Psychological Corporation.