201. Diagnostic Value of Low Dose Dobutamine Stress in Addition to the Assessment of Late Enhancement for the Prediction of Functional Recovery
Eike Nagel, MD,1 Ernst Wellnhofer, MD,2 Adriana Olariu, MD,2 Christoph Klein, MD,2 Michael Gräfe, MD,2 Andreas Wahl, MD,3 Jan Lokies, MD,2 Eckart Fleck, MD.2
Cardiology—CMR, German Heart Institute Berlin, Berlin, Germany,German Heart Institute Berlin, Berlin, Germany,Inselspital Berne, Berne, Switzerland.
Introduction: “Late enhancement” (LEH) techniques have been shown to yield a high value for the prediction of functional recovery of hibernating myocardium (HM). Stress imaging with low dose dobutamine by echocardiography (DSE) or magnetic resonance imaging (DSMR) has been successfully used in clinical routine to predict HM for years.
Purpose: The scope of this study was to determine the diagnostic value of DSMR or DSE in addition to LEH for the detection of HM.
Methods: In 25 consecutive patients with coronary artery disease (67±8 yrs, 4 female, ejection fraction 35±7%), scheduled for revascularization wall motion was evaluated semi-quantitatively (16-segments) by echocardiography and magnetic resonance imaging (Philips ACS, NT, 1.5 Tesla) before and 3 months after intervention. Scar imaging (late enhancement; Gd-DTPA) was performed before revascularisation and the transmural extent of scar was assessed (25% steps). The analysis was based on 155 revascularized segments with wall motion abnormalities at rest. Kappa statistics were used to assess the additional value of the stress tests.
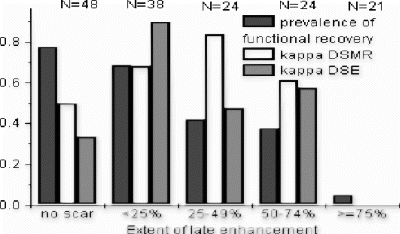
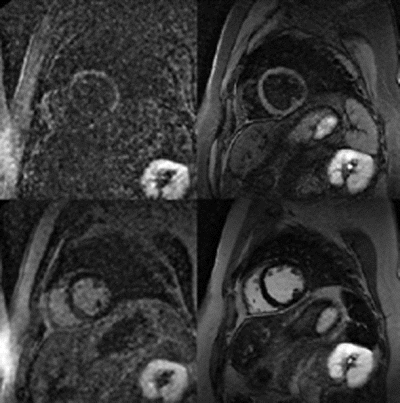
Results: If the prevalence of functional recovery was intermediate in the LEH subgroups the additional diagnostic value of DSMR or DSE (kappa) was high. DSMR tends to be superior to DSE for diagnosis (exception: endocardial scars <25%) (Fig. )
Conclusions: In segments with non-transmural late enhancement additional dobutamine stress testing improves predictive value for hibernating myocardium.
Figure 1.
202. Dobutamine Stress MR with Spiral Real Time SSFP Reliably Detects Wall Motion Abnormalities
Patricia Nguyen, MD,1 Krishna Nayak, PhD,2 Girish Narayan, MD,1 David Liang, MD, PhD,1 Ingela Schnittger, MD,1 John Pauly, PhD,2 Michael McConnell, MD,1 Bob Hu, MD,2 Phillip Yang, MD.1
Cardiovascular Medicine, Stanford University, Stanford, CA, USA,Electrical Engineering, Stanford University, Stanford, CA, USA.
Introduction: Although gated gradient-echo acquisitions for dobutamine stress MR (DSMR) have been validated, a newly developed real-time SSFP (RT-SSFP) may provide additional advantages. Rapid imaging and interactivity of the real-time platform allow continuous monitoring of all wall segments and eliminate the need for cardiac-gating and breath-holding. This flexible imaging protocol becomes desirable in stress-induced tachycardia with frequent arrhythmia. The superior blood-myocardial contrast achieved by SSFP enables more accurate assessment of regional wall motion. Combined RT-SSFP sequence with low- and high-frame rate capabilities has been developed. This integrated system may facilitate DSMR.
Purpose: A study was conducted to determine the clinical utility of RT-SSFP in DSMR by systematic comparison to Dobutamine Stress Echocardiography (DSE), the current gold standard.
Method: The RT-SSFP sequence was implented using a GE 1.5T Signa Twin Speed (GE, Milwaukee, WI) with high-performance gradient capable of 40 mT/m peak amplitude and 150 mT/m/msec slew rate with a 5-inch surface coil. The timing parameters of RT-SSFP sequence are 5.9-ms TR, 0.7-ms TE, and 90° flip-angle and consist of rest and stress versions. Both versions utilize 0.6-ms slice-selective pulse, 2.4-ms spiral read-out with sliding window and 20 cm FOV. The difference between the rest and stress sequences is the number of spiral interleaves. The rest sequence utilizes 20 spiral interleaves to achieve 1.88 mm spatial resolution and 118 ms temporal resolution reconstructed at 10 frames/second. The stress sequence utilizes 10 spiral interleaves to achieve 2.95 mm spatial resolution and 59 ms temporal resolution reconstructed at 20 frames/second. A total of 8 subjects (6 patients and 2 volunteers) were recruited consecutively within 2 weeks following DSE. Patients were scanned at rest and at each pharmacological dose of dobutamine stress until target heart rate was achieved. Images were acquired in 3 short- and 3 long-axes (4-, 3-, and 2-chamber) views. Using the standard 16 segment model accepted by the American Society of Echocardiography, 3 blinded investigators analyzed the MR images. Image quality was defined as excellent (90–100% visualization of an endocardial segment), good (60–89%), adequate (40–59%) and poor (0–39%). Segmental wall motion was graded as normal, hypokinetic, akinetic or dyskinetic. Findings were validated by a comparison to DSE studies, each analyzed by 3 echocardiographers. Any discrepancy in the assessment of wall motion and image quality was resolved by consensus reading.
Results: Scan time to acquire all 6 views using RT-SSFP was less than 3 minutes at rest and less than 45 seconds during each dobutamine dose. Hemodynamic data including blood pressure, heart rate and rate-pressure product did not differ significantly between DSMR and DSE. Image quality at target heart rate was excellent or good in 128/128 segments (100%) using RT-SSFP and 113/128 segments (88.3%) using echocardiography. Wall motion abnormalities were noted in 30/96 segments at rest and 31/96 segments at peak stress using RT-SSFP and 46/96 at rest (p=NS) and 47/96 at peak stress (p=NS) using DSE. There were 79% and 80% agreement in the assessment of the wall motion between RT-SSFP and DSE at rest and stress, respectively. All patients with WMA at rest and stress detected with DSE were detected with RT-SSFP. Short- and long-axis images acquired with rest and stress sequences at end-diastole and end-systole, respectively, are shown in Figs. .
Conclusion: An interactive RT-SSFP sequence capable of low- and high-frame-rates has been developed. This integrated system implemented in a real-time environment enables DSMR without breath-holding or cardiac-gating while allowing high temporal resolution and excellent tissue contrast. The reliable detection of wall motion abnormality and continuous monitoring of all wall segments demonstrate the potential clinical utility of this technique.
Figure 1.
Figure 2.
Figure 3.
Figure 4.
203. T2-Weighted MRI of Microvascular Obstruction in Patients with Acute Reperfused Infarcts
Hassan Abdel-Aty, Nidal Al-Saadi, Andreas Kumar, Matthias G. Friedrich.
Cardiology, Franz-Volhard-Klinik, Charite,Campus Berlin-Buch, Humboldt University, Berlin, Germany.
Introduction: An increase of membrane permeability caused by acute ischemia leads to cellular sodium accumulation with intracellular edema. Since this process is dependent on microvascular integrity in the reperfused, but infarcted region, it is delayed in areas of microvascular obstruction as compared to regions with remaining vascular integrity. In acute myocardial infarction (AMI), MRI allows the detection of both, myocardial edema by T2-weighted sequences, and microvascular obstruction by contrast-enhanced techniques (hypointense core in an area of high signal intensity).
Purpose: We investigated the feasibility of T2-weighted MR to detect microvascular obstruction in AMI patients.
Methods: Forty-two patients (34 males, mean age 54±11y.) were examined 3±4 days after first reperfused AMI on a clinical 1.5T MR scanner using a breathhold black-blood short-TI-inversion-recovery sequence (STIR, TR 2 R–R intervals, TE 64 ms, TI 140 ms). Inversion recovery gradient echo sequence (TR 5.5 ms, TE 1.4 ms, TI200–250 ms) was applied at 2 (to identify microvascular obstruction MO+) and 15 minutes after iv bolus injection (0.2 mmol/kgBW) of Gd-DTPA (Magnevist, Schering AG, Germany) to identify delayed enhancement (DE). Images of each pulse sequence were evaluated separately. The signal to noise ratio (SNR) in STIR images was calculated for the center and the periphery of the infarct.
Results: Twenty-three infarcts exhibited evidence of MO+, whereas 19 infarcts showed homogeneous contrast enhancement (MO−). In the STIR images, a heterogenous signal pattern was detectable in 20/23 MO+ infarcts (87%), with a subendocardial area of low signal (mean SNR 6.1±>0.9) corresponding to the MO+ area (2 minutes after Gd-DTPA injection) surrounded by a high signal area (mean SNR 11.7±1) that exceeded the infarct size as defined by DE (15 minutes after Gd-DTPA injection). The mean percent contrast difference between the infarct center and periphery in STIR in these 20 infarcts was 178±32%.The remaining 3 MO+ and all MO− infarcts showed a homogeneous increase of STIR signal intensity.
Conclusion: A distinct signal intensity pattern is present in T2-weighted MR images of myocardial regions with MO after reperfused acute myocardial infarction. The finding that not all MO+ infarcts show this pattern likely reflects a complex pathophysiological and severity profiles of MO following AMI.
204. Four-Pixel Velocity Analysis Is the Preferential Approach in Evaluating Magnetic Resonance Velocity Maps of Coronary Artery Bypass Grafts
Liesbeth P. Salm, MD,1 Susan E. Langerak, PhD,1 Hubert W. Vliegen, MD, PhD,1 Wouter Jukema, MD, PhD,1 Jeroen J. Bax, MD, PhD,1 Aeilko H. Zwinderman, PhD,2 Ernst E. van der Wall, MD, PhD,1 Albert de Roos, MD, PhD,3 Hildo J. Lamb, PhD.3
Cardiology, Leiden University Medical Center, Leiden, Netherlands, Medical Statistics, Academic Medical Center, Amsterdam, Netherlands,Radiology, Leiden University Medical Center, Leiden, Netherlands.
Introduction: Phase-contrast Magnetic Resonance (MR) velocity maps can be evaluated by measuring volume flow or velocity. The workload of both methods differs considerably. Whether their accuracy differs is unknown.
Purpose: The purpose of our study is to compare both approaches in the analysis of coronary artery bypass grafts.
Methods: Patients with recurrent chest pain after bypass surgery underwent both coronary angiography and MRI with velocity mapping of the grafts at rest and during adenosine stress. Post-processing volume flow (whole vessel) and velocity (4 pixels) analyses were performed and compared.
Results: In 130 venous and arterial bypass grafts in 69 patients volume flow and velocity parameters were measured. The duration of one volume flow analysis was 25.9±4.3 min; one velocity analysis took 11.1±2.2 min. Highly significant correlations were found when comparing volume flow and velocity parameters (for all parameters, p<0.01). Comparison of ROC areas under the curve of both analyses revealed no significant difference for detection of stenoses ≥70%. In single vein grafts the sensitivity/specificity/diagnostic accuracy for the volume flow were 91%/92%/92% and for the velocity parameters 96%/92%/93%, respectively.
Conclusion: In the analysis of MR velocity maps in bypass grafts four-pixel velocity analysis is at least as accurate as volume flow analysis and significantly less time consuming. Therefore, velocity analysis may be considered the preferential approach in the analysis of MR velocity maps of bypass grafts.
205. Admission Troponin I Predicts the Volume of Myocardial Infarction Measured by Contrast Enhanced Cardiac Magnetic Resonance Imaging
Thomas N. Martin, BSc, MBChB, MRCP,1 Bjoern A. Groenning, MD, FAHA,1 Tracey Steedman, BSc,1 Alan Pettigrew, BSc, MSc,2 John E. Foster, PhD,1 Alex T. Elliott, PhD,1 Henry J. Dargie, MD, FRCP, FESC.1
Glasgow Cardiac Magnetic Resonance Unit, Western Infirmary, Glasgow, United Kingdom,Biochemistry Department, Gartnavel General Hospital, Glasgow, United Kingdom.
Introduction: Troponin I (TnI) correlates strongly with prognosis in acute coronary syndromes. However, the relationship between the single TnI measurement used in routine clinical practice and infarct size and left ventricular (LV) dimensions and ejection fraction (LVEF) is unkonown.
Purpose: The purpose of the study was to assess the relationship between TnI at 8 to 12 hours after onset of chest pain and infarct size measured by gadolinium-DTPA late contrast enhanced magnetic resonance (ceMR) imaging and MR measures of LV dimensions and LVEF.
Methods: 13 male and 6 female (mean (range) age=60 (37–83) years) incident hospital admissions with acute coronary syndromes were consecutively recruited. 9/19 (47%) were treated with primary thrombolysis. Blood sampling for TnI took place 8–12 hours after onset of chest pain and samples for creatine kinase (CK) and CKMB were collected at admission, after 12 hours and at the MR scan. MR was performed at a median (range) of 69 (16–120) hours from onset of chest pain on a Siemens Sonata 1.5T system using a phased array chest coil. LV dimensions were evaluated by cinematographic (TrueFISP) breath-hold sequence. ceMR was performed 15 minutes after peripheral injection of 0.2 mmol/kg gadolinium-DTPA using a breath-hold segmented turboFLASH sequence with non-selective inversion-recovery. Images were evaluated by 2 independent and blinded observers.
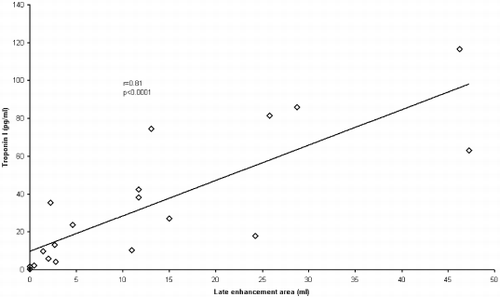
Results: TnI (median (range) 24 (0.3–117) pg/ml) strongly correlated with late enhancement (LE) volume (mean (SD) 13 (15) ml): r=0.81, p<0.0001 and with LVEF (mean (SD) 59 (9.7)%): r=−0.58, p=0.0009. TnI was unrelated to LV end-diastolic (140 (36) ml) and end-systolic (58 (19) ml) volumes and LV mass (134 (42) g). CK (median (range)) at 8–12 hours (620 (74–1344) IU/l) and at the MR scan (228 (57-2508) IU/l) correlated with LE volume: r=0.78, p=0.0001 and r=0.70, p=0.002, respectively. CK (111 (69-4869) IU/l) on admission was unrelated to LE volume. CKMB (median (range)) at 8–12 hours (54 (3.4-226) mg/ml) and at the MR scan (11 (1.2-406) mg/ml) correlated with LE volume: r=0.59, p=0.01 and r=0.58, p=0.02, respectively. CKMB on admission was unrelated to LE volume.
Conclusions: Plasma concentrations of TnI measured 8–12 hours after onset of chest pain are very closely related to the volume of late enhancement measured by ceMR suggesting that the currently recommended timing of TnI sampling does provide an accurate reflection of infarct size.
Figure 1.
206. Delayed Hyperenhancement Contrast MR Imaging of Non-viable Myocardium: Intra- and Inter-observer Variability
Joseph Selvanayagam, Attila Kardos, Jane Francis, Stefan Neubauer.
Department of Cardiovascular Medicine, University of Oxford Centre for Clinical Magnetic Resonance Research, John Radcliffe Hospital, Oxford, United Kingdom.
Introduction: Delayed hyperenhancement MRI is being increasingly used to identify areas of irreversible myocardial damage, however it's intra- and inter-observer variability in quantifying non-viable cardiac tissue has not been reported.
Purpose: To assess the intra- and inter-observer variability of delayed hyperenhancement MRI in quantifying size of non-viable myocardium in patients post myocardial infarction.
Methods: 22 patients (age range 31–81 years) after a first myocardial infarction were studied with cine (True FISP sequence) and gadolinium contrast enhanced (segmented inversion recovery Turbo FLASH sequence) MRI. Myocardial infarction was defined as presentation to hospital with chest pain lasting >30 mins and troponin I elevation. Left ventricular volume and mass measurements were obtained by planimetry of all short axis cine slices. 2 independent observers, blinded to cineMRI findings evaluated the total area of hyperenhanced myocardium by planimetry of all late gadolinium slices (Argus Analysis, Siemens Medical Systems, Erlangen, Germany). This was then multiplied by the slice thickness (7 mm) to arrive at the total volume of hyperenhanced myocardium, for each patient.
Results: Mean ejection fraction was 42+/−9 %. In all patients, areas of delayed hyperenhancement corresponded to regional wall motion abnormalities. All 22 patients showed delayed hyperenhancement in the infarct related territory. Assuming a myocardial specific gravity of 1.05 g/cm3 the median mass of infarcted tissue based on the volume of hyperenhanced myocardium was 18.0 g (range 3 g to 35.8 g) or 13% of absolute LV mass (range 2.3% to 25%). Intra-observer and inter-observer variability of hyperenhanced tissue mass was 1.1+/−0.4 g (4+/−2%) and 1.9 +/−0.6 g (7+/−3%) respectively.
Conclusion: Delayed hyperenhancement MRI assessment of irreversibly injured myocardial tissue has low intra-observer and inter-observer variability as expected from the excellent spatial resolution and image quality of the technique.
207. Influence of Interslice Gap and Sample Frequency on Semiquanitative Evaluation of First Pass Myocardial Perfusion with Magnetic Resonance
Nidal Al-Saadi, Hassan Abdel-Aty, MD, Daniel Messroghli, MD, Rainer Dietz, MD, Matthias Friedrich, MD.
Cardiology, Franz-Volhard-Klinik, Charite, Campus Berlin-Buch, Humboldt University, Berlin, Germany.
Introduction: MR has a high spatial resolution for the evaluation of myocardial perfusion. To achieve full coverage of the myocardium 8–10 short axis slices are necessary. Generally this requires image acquisition every second beat.
Purpose: We evaluated the effect on the diagnostic performance of perfusion studies of:
Decreasing slices number with increasing inter-slice gaps.
The reduction of sample frequency (temporal coverage).
Methods: First pass MR perfusion studies, acquired on a 1.5T cardiovascular system (Signa CV/i GE Medical Systems) of 15 patients with coronary artery disease were analyzed. Images were acquired using a GRE-EPI hybrid sequence (4 slices each heart beat) at rest and after adenosine stress (140 mg/kg). Original images (1RR) were compared with the same series after deleting all even image numbers (2RRa) and, in a second data set, all odd image numbers (2RRb). Slices were randomized before the blinded evaluation (=180 slices, 60 for each group). Semiquantitative analysis (upslope and perfusion reserve index calculated from the upslope in 6 Segments of every slice) was performed in all examinations and compared between groups. In 15 additional patients with advanced coronary artery disease but without myocardial infarction, two rest studies were performed. The first with 4 slices every heart beat (4SL) and the second repeated after 60 Minutes acquiring 8 slices every other heart beat (8SL). Comparisons were performed with an ANOVA for repeated measurements in a model considering the factors patients, slices and segments. Linear regression analysis and Bland–Altman Plots were used.
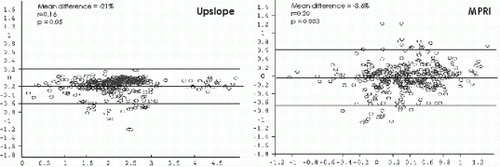
Results: Semiquantitative analysis of the upslope showed moderate correlations between 1RR and 2RR with a bias resulting in underestimation of the upslope in the 2RR groups (mean difference −21%, p=0.05). Moderate correlations with a considerable scatter was found between 2RRa and 2RRb (95% confidence interval −25% to 53%). Perfusion reserve index showed a moderate correlation between the groups but no bias was found (mean difference −3.6%, ns). Perfusion reserve index was less sensitive for the detection of coronary stenosis in the 2RR groups (79% in 2RR vs. 84% in 1RR). Similar results were achieved for the upslope in 4SL and 8SL (underestimation of the slope in the 8SL group, p<0.05). On segmental basis more ischemic segments were diagnosed in the 8SL group as compared to 4SL.
Conclusion: Semiquantitative evaluation of myocardial perfusion seems more accurate in image sets with a higher temporal coverage (image acquisition every heart beat), whereas increasing the number of slices (with an image acquisition every second heart beat) increases the sensitivity for the detection of small perfusion defects.
Figure 1.
208. Robust Determination of Optimal Inversion Delay in Delayed Enhancement Imaging Using a Fast Look-Locker Sequence in a Single Breath-Hold
Raja Muthupillai, PhD,1 Scott D. Flamm, MD.2
Clinical Science and Diagnostic Radiology, Philips Medical Systems and Baylor College of Medicine, Houston, TX, USA, Departments of Cardiology and Radiology, St. Luke's Episcopal Hosp/Texas Heart Institute, Houston, TX, USA.
Introduction: It has been shown that in the minutes following the administration of Gd-DTPA, the T1 of irreversibly injured myocardium is shorter than that of the normal myocardium due to the differences in Gd-DTPA kinetics and differences in Gd-DTPA distribution volume between normal and injured tissue [1,2]. This T1 difference between normal and irreversibly injured myocardium is exploited to reveal areas of irreversible injury, in the so-called delayed enhancement (DE) imaging [3]. Following contrast administration, the DE uses an inversion-recovery (IR) preparation followed by T1-TFE readout at an appropriate inversion delay (TI) to null the signal from the normal myocardium [3]. In the background of dark normal myocardium, irreversibly injured myocardium is conspicuously bright. A correct TI maximizes the contrast between infarcted and normal myocardium. However, choosing a “correct” TI is complicated because T1 of both normal and injured myocardium continues to change (due to continued Gd-DTPA kinetics) during the course of the examination. At present, the optimal TI is determined iteratively in multiple acquisitions and the process is heuristic, time-consuming, and is operator dependent. The choice of TI has been a source of recent controversy in estimating infarct size using the DE technique [4,5].
Purpose: The purpose of this work is to describe a Look-Locker type sequence [6] that can correctly determine the optimal TI for nulling the signal from tissues with a broad range of T1 in a IR-TFE sequence in a breath-hold.
Methods: MRI acquisition: All imaging was done on a 1.5T commercial imager (Philips Gyroscan Intera, Rel. 813), using a 5-element synergy cardiac coil with VCG triggering.
Pulse-sequence: A conventional multi-phase T1-TFE sequence was modified to include a non-selective inversion pre-pulse. The evolution of the longitudinal magnetization (Mz) was sampled with a low flip angle RF excitation (12 deg), and an EPI readout (5 lines/TR). This measurement process continued throughout the cardiac cycle and phase encoding steps were incremented between RR intervals. The specific acquisition parameters were: FOV: 288×288 mm; matrix: 96×96, reconstructed as 256×256; TR/TE: 7.3/3.4 msec; and total breath-hold duration: 19 heartbeats. About 100 images were acquired at different delay times at a temporal sampling rate of 7 msec during the breath-hold. A single short axis slice was chosen at the mid-ventricular level for data acquisition. The appropriate TI was readily determined from the image that showed the least signal from the desired tissue. The visual choice of TI was verified by drawing small regions-of-interest on the tissue of interest. The TI at which the tissue of interest was nulled was determined directly from the graphical display.
Optimization: The choice of pre-pulse, EPI readout duration, flip-angle, and temporal resolution were optimized in normal volunteers without administration of contrast, and in bulk phantoms with known T1 relaxation times (oil to mimic fat with a well known T1, and water phantoms doped with CuSO4 to mimic tissue).
Delayed Enhancement sequence: In patients, the TI determined from the Look-Locker sequence was used in the following T1-TFE DE sequence with the following parameters: FOV: 340×340; matrix: 256×256; slice thickness: 10 mm; TR/TE: 6.3/1.8 msec; flip: 15 deg; # of lines/hb: 32 lines; acquisition time: 14 heartbeats.
Results: In patients, correct inversion delays were directly determined using the Look-Locker approach. The evolution of longitudinal magnetization reflecting T1 relaxation is shown in Fig. for three different tissues, blood, myocardium, and spleen as measured from regions of interest in the Look-Locker sequence. Note the different nulling times for each of the tissues with distinctly different longitudinal relaxation times. The corresponding Look-Locker images, as well as the DE images are shown in Fig. , side-by-side for comparison.
Discussion: Oshinski et al. have shown that the DE technique can yield different estimates of infarct size if the TI time is maintained constant over a 40 minute period following Gd-DTPA administration, and can vary by as much as 30%, in a rat model [4,5]. A rapid method to estimate the correct TI that accounts for the wash-out effects of Gd-DTPA in normal myocardium eliminate the variability introduced by the constant TI and maintain sufficient CNR between normal and injured myocardium throughout the imaging period.
The adoption of Look-Locker sequence cardiac imaging poses several challenges. First, the data is collected throughout the cardiac cycle. This requires that each image is collected in a very short amount of time, to minimize motion artifacts arising from cardiac pulsation. This is particularly difficult given that the entire acquisition should be completed within a breath-hold to minimize respiratory motion. These problems were circumvented partly by using a echo-planar readout to speed up acquisition, as well as by using a non-selective preparation pulse to minimize errors caused by through-plane motion. Therefore, it is necessary to choose an appropriate slice orientation that has minimal through-plane motion, e.g., a mid-ventricular short axis slice compared to a basal short axis slice. In addition, heart rates vary between patients and the amount of longitudinal magnetization available at the end of each RR interval is a function of heart rate. This requires that the time between the IR preparations must be maintained the same between the Look-Locker sequence as well as the DE sequence to avoid errors in TI determination.The high temporal sampling available with this Look-Locker approach also makes it possible to directly visualize the shortened T1 of infarcts, and can potentially be used to distinguish between peri-infarct regions (which have a mixture of infarcted tissue, and normal tissue) from the infarct core as they have slightly different T1 s. It is also conceivable that direct estimates of T1 relaxation times may be obtained using the Look-Locker approach, which could provide a means for linking T1 with actual Gd-DTPA concentration. This requires further experimental validation.
Conclusions: The Look-Locker based determination of inversion delay is a robust means for determining the appropriate TI that maximizes the normal to injured myocardial contrast in delayed enhancement imaging. It is non-heuristic, operator independent, and can be readily applied in a clinical setting.
Figure 1. Signal evolution following the inversion pulse in the Look-Locker sequence. The zero crossing is indicated by the signal notch close to zero in this magnitude reconstruction.
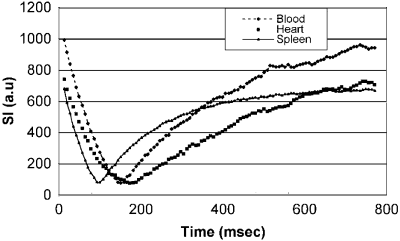
Figure 2. Look-Locker sequence images (left) and the high-resolution DE images at the same TI (right).
References:
1. Kim RJ, Chen EL, Lima JA, and Judd RM. Myocardial Gd-DTPA kinetics determine MRI contrast enhancement and reflect the extent and severity of myocardial injury after acute reperfused infarction. Circulation. 1996 Dec 15; 94(12):3318–26.
2. Rehwald WG, Fieno DS, Chen EL, Kim RJ, and Judd RM. Myocardial magnetic resonance imaging contrast agent concentrations after reversible and irreversible ischemic injury. Circulation. 2002 Jan 15;105(2):224–9.
3. Kim et al. The use of contrast-enhanced magnetic resonance imaging to identify reversible myocardial dysfunction. N Engl J Med. 2000 Nov 16;343(20):1445–53.
4. Oshinski JN, Yang Z, Jones JR, Mata JF, and French BA. Imaging time after Gd-DTPA injection is critical in using delayed enhancement to determine infarct size accurately with magnetic resonance imaging. Circulation. 2001 Dec 4;104(23):2838–42.
5. Judd RM, and Kim RJ, Letter to the editor in response to Ref. 4, Circulation 2002, Jul 9; 106 (2):e6; discussion e6.
6. Look DC, and Locker, DR. Time Saving in Measurement of NMR and EPR Relaxation Times. Phys. Rev. Lett. 1968 20:987.
209. Stability of Myocardial Infarction Size After Gadolinium Administration Is Less Dependent on Post-Contrast Imaging Time Than on Varying the Inversion Delay Time
Scott D. Flamm,1 Mercedes Pereyra,1 Eric L. Douglas,1 Raja Muthupillai.2
Texas Heart Institute, Houston, TX, USA, Philips Medical Systems, Bothell, WA, USA.
Introduction: Contrast-enhanced, delayed enhancement (DE) cardiac MRI provides a potent means for identifying both acute and chronic Myocardial Infarction (MI) as demonstrated by multiple recent publications. The findings in chronic MI are relatively well established and controversy with the technique primarily rests with the relationship between degree of transmurality and extent to which functional recovery may occur following revascularization. The use of DE-MRI in acute MI, however, remains controversial with some investigators suggesting that the extent of hyperenhanced regions corresponds precisely to the irreversibly damaged tissue (1;2), while others suggest that the extent of infarction seen with DE-MRI varies relative to the time after Gadolinium chelate administration or that the hyperenhanced regions have reversible and not irreversible damage (3;4). Multiple factors are critical to the appropriate utilization of DE-MRI for acute MI evaluation and likely play a role in these discrepancies. These factors include: the precise sequence employed (spin-echo or gradient-echo), choice of preparation pulse(s), time following contrast administration, and inversion delay time (TI) (time following the inversion pulse to image acquisition).
The two factors most likely responsible for these discrepancies are the time following contrast administration when images are acquired and the choice of inversion delay time. The use of DE-MRI depends on satisfactory “nulling” of the normal myocardium, remote from the area of infarction (5). T1 shortening following Gadolinium administration changes in tissues over time depending on different wash-in and wash-out rates, as well as the volume of distribution of Gadolinium in various tissues. Infarcted tissues, both acute and chronic, have a greater degree of interstitial space and thus greater enhancement than normal myocardium. As a result, it should be critical to vary the TI over time following Gadolinium administration in order to maintain the differential contrast between normal and infarcted myocardium.
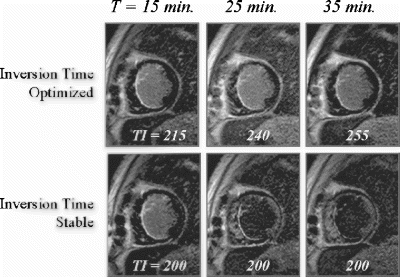
Purpose: The purpose of the study was to determine the spatial extent of hyperenhancement in both acute and chronic MI over time under conditions of: 1) an unchanging TI, and 2) a varying TI sequentially and iteratively optimized for nulling of remote normal myocardium.
Methods: Patient Population: 6 patients with MI (3 chronic, 3 acute) were imaged with DE-MRI. Acute MI was diagnosed by ECG and enzyme criteria and patients were imaged within 96 hours of the acute event.
MRI data acquisition: All MRI data were collected at 1.5T (Philips NT-Intera, Rel. 8.1). The delayed enhancement protocol is as follows. Fifteen minutes after the administration of Gd-DTPA (0.2 mmol/kg), short axis slices covering the entire LV were acquired using a Vector-cardiogram gated, 3D inversion-recovery prepared, segmented gradient echo (T1-TFE) technique during breath-holding. The specific acquisition parameters were: Field-of-View: 320–400 mm depending on patient size; matrix: 256×256; slice thickness/gap: 10 mm/0 mm; number of slices: 10–12 slices depending on size of heart; TR/TE/flip=7.1/1.5/15 deg; acquisition duration/RR interval: 180–200 msec during diastole; breath-hold time: 16–18 heartbeats. The inversion delay time (TI) was iteratively adjusted to null the signal from the normal myocardium, and ranged from 170–250 msec.
Then a single slice 2D short axis DE-MRI sequence (baseline image) was acquired at the level demonstrating the greatest amount of infarcted myocardium. The specific acquisition parameters were: Field-of-View: 320–400 mm depending on patient size; matrix: 256×256; slice thickness/gap: 10 mm/0 mm; TR/TE/flip=6.3/1.8/15 deg; acquisition duration/RR interval: 180 msec during diastole; NSA=2; breath-hold time: 16 heartbeats. The TI was iteratively adjusted to null the signal from the normal myocardium, and ranged from 170–250 msec. At 25 and 35 minutes following contrast administration (10 min. and 20 min. after the initial optimized image) additional images were acquired using the initial TI time (stable TI) and with a newly optimized TI (optimized TI).
MRI data analysis: The stable TI and optimized TI MRI data were analyzed first by determining the signal intensity (SI) of the normal remote myocardium in each image. Areas of hyperenhancement were defined as those with SI>2 SD above normal remote myocardium and then planimetered. The planimetered areas were compared relative to the baseline image.
Results: Infarct size: Baseline infarction size=100%.
Acute MI:
At 35 minutes the hyperenhanced region in the Stable TI images was significantly smaller than in the Optimized TI images: 60+12% vs 92+6%.
Chronic MI:
At 35 minutes the hyperenhanced region in the Stable TI images was significantly smaller than in the Optimized TI images: 72+10% vs 94+4%.
Conclusions: In this study both acute and chronic MI's by DE-MRI were significantly smaller in size on Stable TI images (where the TI was maintained at a fixed value) compared to baseline images. Conversely, when the TI was iteratively optimized over time to “null” normal remote myocardium the size of both acute and chronic MI's demonstrated only small changes in size compared to baseline images. These findings suggest that the time of image acquisition following Gadolinium administration is less critical than optimizing the TI to achieve myocardial nulling.
Figure 1. Acute myocardial infarction.
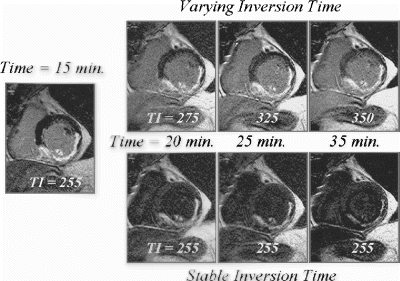
Figure 2. Chronic subendocardial myocardial infarction.
References
(1) Choi KM, Kim RJ, Gubernikoff G, Vargas JD, Parker M, Judd RM. Transmural extent of acute myocardial infarction predicts long-term improvement in contractile function. Circulation 2001; 104(10):1101–1107.
(2) Rehwald WG, Fieno DS, Chen EL, Kim RJ, Judd RM. Myocardial magnetic resonance imaging contrast agent concentrations after reversible and irreversible ischemic injury. Circulation 2002; 105(2):224–229.
(3) Oshinski JN, Yang Z, Jones JR, Mata JF, French BA. Imaging time after Gd-DTPA injection is critical in using delayed enhancement to determine infarct size accurately with magnetic resonance imaging. Circulation 2001; 104(23):2838–2842.
(4) Rogers WJJ, Kramer CM, Geskin G, Hu YL, Theobald TM, Vido DA, Petruolo S, Reichek N. Early contrast-enhanced MRI predicts late functional recovery after reperfused myocardial infarction [see comments]. Circulation 1999; 99(6):744–750.
(5) Kim RJ, Fieno DS, Parrish TB, Harris K, Chen EL, Simonetti O, Bundy J, Finn JP, Klocke FJ, Judd RM. Relationship of MRI delayed contrast enhancement to irreversible injury, infarct age, and contractile function. Circulation 1999; 100(19):1992–2002.
210. Evaluation of the Accuracy of Quantitative Myocardial First-Pass Perfusion Analysis
Marcel Breeuwer, PhD,1 Ursula Goette.2
MIMIT Advanced Development, Philips Medical Systems, Best, Netherlands, Department of Mathematics and Technology, Fachhochschule Koblenz, RheinAhrCampus, Remagen, Germany.
Introduction: During contrast-enhanced ECG-triggered myocardial first-pass perfusion imaging, the passage of a contrast agent through the myocardium is monitored dynamically. Typically, this imaging results in 3–5 short-axis slices per heartbeat. The image intensity in the myocardium as a function of time (henceforth called the time-intensity profile) is a measure for how well blood flows from the coronary arteries into the myocardium. Several studies have shown that quantitative analysis based on comparing the maximum upslope of the myocardial time-intensity profiles scanned when the heart is at rest and when it is stressed has a high sensitivity and specificity for the detection of ischemic heart diseases [1,2].
Myocardial first-pass perfusion images may however contain many artifacts, such as noise, intensity inhomogeneities due to the specific placement of the MR surface coils, partial volume effects due to the limited scanning resolution, myocardial motion due to breathing or movement of the patient, incorrectly scanned images due to failure of the ECG triggering, and incomplete clearance of the contrast agent from previous scans. These artifacts will certainly influence the accuracy of the quantitative analysis. Furthermore, the accuracy of the analysis may depend on the pre-processing applied to the myocardial time-intensity profiles (e.g. the application of noise reduction methods) and on user-specific choices, such as the placement of the contours delineating the myocardium and the division of the myocardium into a number of segments.
Purpose: The purpose of our study was to evaluate the accuracy of quantitative myocardial first-pass perfusion analysis based on maximum-upslope estimation as a function of image artifacts, analysis parameters and user interaction. We aimed at quantifying the variation in the estimated maximum upslope and especially in the perfusion reserve index, i.e. the ratio of the maximum upslope at stress and at rest, as a function of all above-mentioned influences. This knowledge will help to decide whether or not a specific value of the perfusion reserve index is indicating an insufficiently perfused myocardium.
Methods: To be able to quantify the accuracy of first-pass perfusion analysis it is necessary to exactly know the myocardial time-intensity profiles. We therefore developed a software package which with first-pass perfusion image series with exactly known local myocardial time-intensity profiles and exactly known artifacts can be generated. The passage of the contrast agent was modeled by a gamma-variate function [3]. By means of a specifically developed user-interface, the user has the freedom to choose the geometry of the myocardium, divide it into a number of segments, select a specific contrast uptake function for each segment, and select the magnitude of each of the artifacts.
We generated over 250 perfusion image series with large range of single and multiple artifacts and with various realistic time-intensity profiles. We then analyzed each of these image series with the semi-automatic analysis method described in [4]. This method basically implements the maximum upslope estimation and the calculation of the perfusion reserve index as proposed in [2]. For each of the myocardial segments, we calculated the difference (mean, maximum, standard deviation) between the ideal (i.e. generated) upslope and the measured upslope and perfusion reserve index. We generated several tens of graphs showing these numbers for different magnitudes of single and multiple artifacts.
Finally, for a large number of patient scans we estimated the magnitude of artifacts. The expected accuracy of the quantitative perfusion analysis can then be read from the graphs using these estimated artifact magnitudes.
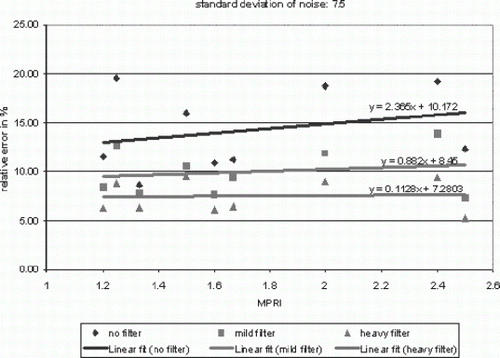
Results: We found that for image series generated with realistic types and amounts of artifacts, the error in the myocardial perfusion reserve index can easily be as high as ±25%. Noise in the images was found to have the most severe effect. Noise reduction by means of low-pass filtering of the time-intensity profiles was found to significantly increase the accuracy. The graph in Fig. shows an example of the absolute error (in %) in the perfusion reserve index (vertical axis) as a function of the perfusion reserve index value (horizontal axis) and as a function of the amount of filtering that was applied (the three different lines), using a realistic noise level (Gaussian noise, standard deviation of 7.5) to generate the image series. We found that partial volume effects can also have a significant influence especially in the septum, where the myocardial time-intensity profile can be significantly influenced by that of the right and left ventricle (errors up to ±20%). These errors can however be avoided by drawing the contours conservatively in this area (reduction to only several %).
Other artifacts, especially the combination of intensity inhomogeneities and myocardial motion were also found to have a significant influence on the analysis accuracy (errors up to ±6%).
Conclusions: We have studied the influence of various types and magnitudes of image artifacts on the accuracy of quantitative myocardial first-pass perfusion analysis. We concluded that errors in the perfusion reserve index in the order of ±25% are no exception for realistic artifact magnitudes. This has important implications for the interpretation of the outcome of the perfusion analysis. The hypothesis underlying quantitative perfusion analysis is that ischemic and healthy myocardial tissues have different perfusion reserve index values, so that they can be discriminated by a thresholding operation, e.g. <1.5=ischemic, ≥1.5=not ischemic. Knowledge about the analysis accuracy d makes it possible to refine this operation to: <1.5−d=ischemic, ≥1.5+d=not ischemic.
Figure 1. Absolute relative error in the MPRI as a function of the MPRI value and the amount of noise filtering.
References
1. H. Thiele et al., Color-encoded semi-automatic analysis for multi-slice first-pass magnetic resonance perfusion imaging: comparison to 99m Technetium single-photon emission computed tomography, Proceeding SCMR 2002, Florida, USA, January 25–27, 2002.
2. N. Al-Saadi et al., Non-invasive detection of myocardial ischemia from perfusion reserve based on cardiovascular magnetic resonance, Circulation 101, 2000, pages 1379–1383.
3. M.T. Madsen, A simplified formulation of the gamma-variate function, Phys. Med. Biol. Vol. 7, 1992, pages 1597–1600.
4. M. Breeuwer et al., Towards automatic quantitative analysis of cardiac MR perfusion images, Proceedings CARS 2001, pages 922–927.
211. Determination of Infarct Size by Contrast-Enhanced Magnetic Resonance Imaging: Comparison Between Quantitative Planimetry and the Semiquantitative Visual Score Method
Clerio F. Azevedo,1 Marcelo Hadlich,1 João L. Petriz,1 Luis A. Mendonça,1 Jorge Moll,1 Carlos E. Rochitte.2
Cardiac MRI, Rede D'Or & Labs, Rio de Janeiro, Brazil, Cardiac MRI, Heart Institute (InCor) University of São Paulo Medical School, São Paulo, Brazil.
Introduction: Contrast-enhanced magnetic resonance imaging (MRI) offers high spatial resolution and can be used to precisely delineate the nonviable necrotic areas in patients with previous myocardial infarction. It has been previously demonstrated that infarct size, expressed as a percent of total left ventricular (LV) mass, has important clinical and prognostic significance and therefore could be routinely calculated in all cardiac MRI evaluations of patients with previous myocardial infarction.
Purpose: We examined whether the faster semiquantitative visual score method is valid to determine infarct size when compared to the quantitative and time-consuming planimetric method.
Methods: Sixty-two patients with previous myocardial infarction underwent contrast-enhanced MRI between oct/2001 and aug/2002 on a 1,5T whole-body magnet (Intera NT, Philips). The imaging protocol was based on the delayed-enhancement technique and included 8 short-axis views covering the whole LV. The myocardial infarction territory, defined as the regions the showed delayed hyperenhancement, was then analised in two ways: 1- Manual drawing of the hyperenhanced regions in all 8 slices to determine infarct mass (planimetry,PL) and of the endocardial and epicardial borders to define LV mass. Infarct size was then defined as 100*infarct mass/LV mass; 2- Visual evaluation by score (VS) of all 8 slices, divided in a total of 48 segments (2 basal slices with 8 segments, 4 middle slices with 6 segments and 2 apical slices with 4 segments, therefore weighting for each segment's mass), by two independents observers that were blind to the planimetry results. The transmural extent of segmental myocardial necrosis was graded on a four-point scale in which a score of 0 indicated no hyperenhancement, a score of 1 hyperenhancement of 1 to 25% of tissue, a score of 2 hyperenhancement of 26 to 75% of tissue and a score of 3 hyperenhancement of more than 75% of the tissue in each segment. The final score of each patient was then divided by the total possible score, providing the infarct size as percent of LV mass.
Results: Mean infarct size was similar when measured by either method (19.8±1.4% for PL vs. 18.6±1.3% for VS, P=NS). Pearson's correlation coefficient for PL vs. VS was good for both observers (r=0.90 and 0.82, P<0.01). Bland–Altman analyses revealed a mean difference of −1.2%, with a 95% confidence interval for the differences between both methods ranging from −11.0 to 8.6%. Moreover, good correlation was observed between infarct size measured by the visual score method and LV ejection fraction (r=0.75, P<0.01).
Conclusions: The visual semiquantitative evaluation of the delayed-enhanced images by the score method showed good accuracy and reproducibility to determine the percent of infarcted LV mass when compared to the quantitative planimetric method. Therefore, infarct sizing by the score method can be used in routine cardiac MRI exams, adding objective data to the report and significantly decreasing post-processing time.
212. Comparison Between Single Shot Truefisp And Segmented Turboflash For The Detection Of Myocardial Infarction
Daniel C. Lee, M.D.,1 Edwin Wu, M.D.,1 Yiu-Cho Chung, Ph.D.,2 Orlando P. Simonetti, Ph.D,2 Michael Elliott, M.D.,1 Thomas A. Holly, M.D.,1 Francis J. Klocke, M.D.,1 Robert O. Bonow, M.D.1
Division of Cardiology, Northwestern University, Chicago, IL, USA,Siemens Medical Solutions, Chicago, IL, USA.
Introduction: Contrast-enhanced MRI has emerged as a useful clinical tool in the identification of reversible myocardial dysfunction prior to coronary revascularization.1 The inversion recovery, segmented turbo FLASH (IR-TFL) sequence produces the greatest difference in signal intensity between infarcted and normal myocardium.2 However, the segmented technique yields suboptimal results during cardiac arrhythmias or when an adequate breath-hold cannot be maintained. Single shot, inversion recovery trueFISP (IR-trueFISP) is not susceptible to these problems3 and can be used as an alternative infarct imaging technique.
Purpose: The aim of the present study was to systematically compare IR-trueFISP and IR-TFL in the evaluation of the extent of myocardial infarction and the difference in signal intensity between hyperenhanced and non-hyperenhanced myocardium.
Methods: Patient Imaging: We imaged twenty-nine patients in a 1.5 T clinical scanner (Siemens Sonata, Erlangen, Germany) for viability assessment. A series of contrast enhanced images were acquired 10–15 minutes after intravenous contrast injection (Gadoteridol 0.1–0.2 mmol/kg). A representative slice position was imaged using both IR-TFL and IR-trueFISP. The inversion time (TI) was chosen to null normal myocardium. Further imaging parameters have been described previously.2,3
Image Analysis: A total of fifty-eight contrast enhanced images, both IR-trueFISP and IR-TFL, were placed in random order and analyzed by two observers who were unaware of the patient's identity. Four patients without evidence of infarction were included to reduce the potential for observer bias. Each image was scored on a six segment model for the extent of hyperenhancement. Each segment was graded on a 5-point scale: 0=no hyperenhancement; 1=1 to 25% hyperenhanced; 2=26–50%; 3=51–75%; 4=76–100%. The sum of all six segments yielded the total hyperenhancement score. Additionally, mean signal intensity was measured in a hyperenhanced area and a remote area of normal myocardium.
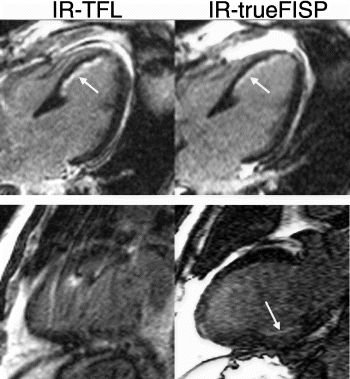
Results: Hyperenhancement visualized by IR-TFL was readily identified by IR-trueFISP (Fig. ). The total hyperenhancement score demonstrated a good correlation between the two techniques (Fig. ). However, IR-trueFISP slightly underestimates the extent of hyperenhancement when compared to IR-TFL (Mean hyperenhancement scores were 3.5±3.0 and 4.2±3.1, respectively, p=0.005). The mean hyperenhanced to normal myocardial signal intensity ratio (infarct SI/normal SI) was 4.2±1.9 for IR-trueFISP and 5.5±1.8 for IR-TFL (p<0.01).
Conclusions: IR-trueFISP produces quality contrast enhanced images of the heart despite heart rate irregularity and the patient's inability to breath hold. However, the extent of myocardial infarction may be underestimated and small infarcts may be missed by IR-trueFISP as compared to IR-TFL. This may be due to the smaller difference between hyperenhanced and normal myocardial signal intensity seen in IR-trueFISP. Therefore, IR-TFL remains the preferred infarct imaging technique when patient conditions allow.
Figure 1.
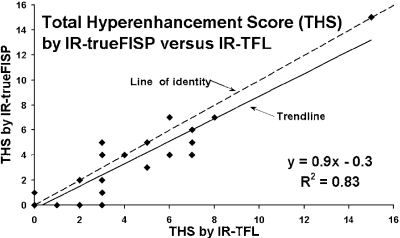
Figure 2. Top Panel: A septal infarct (white arrow) is identified by IR-TFL and IR-trueFISP. Bottom Panel: Breathing artifact is readily apparent in the IR-TFL image. Acquisition using IR-trueFISP enabled a clearer image to be obtained. A subendocardial inferior infarct can be seen (white arrow).
References
[1] Kim RJ et al., NEJM 343: p. 1445–53, 2000.
[2] Simonetti OP et al., Radiology 218: p.215–223, 2001.
[3] Chung et al., JCMR vol.4, no.1, p.12, 2002.
213. Multisequential Cardiac Magnetic Resonance Detects Microvascular Stunning in Patients with Acute Reperfused Myocardial Infarction
Nidal Al-Saadi, MD, Hassan Abdel-Aty, MD, Andrew J. Taylor, MD, Rainer Dietz, MD, Matthias G. Friedrich, MD.
Cardiology, Franz-Volhard-Klinik, Charite, Campus Berlin-Buch, Humboldt University, Berlin, Germany
Introduction: The differentiation between reversible and irreversible microvascular injury following acute myocardial infarction (AMI) is of clinical and prognostic importance.
Purpose: To investigate the clinical utility of a multi-sequential cardiac magnetic resonance (MR) approach to characterize microvascular injury and identify microvascular stunning following AMI.
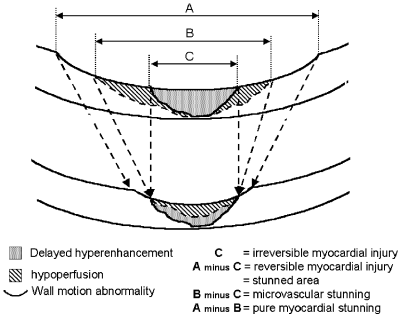
Methods: Patients were examined 4±2 days after AMI (n=26) and were followed up 6 month later (n=15). The multisequential MR approach included a multislice evaluation of wall motion analysis, first pass myocardial perfusion, and irreversible myocardial injury (delayed hyperenhancement). Slice thickness and slice orientation were kept constant for all sequences. For all four injuries the circumferential extent was assessed by quantitative analysis. Slice thickness and slice orientation were kept constant for all applied sequences.
Results: In the acute phase perfusion defects (93±35°) were smaller than wall motion abnormalities (109±38°, p<0.001) and were larger than the delayed hyperenhancement (60±25°, p<0.001). Two perfusion patterns were observed. No flow, which was only present within the area of irreversible myocardial injury and a delayed wash in pattern mainly outside this area. Dysfunctional myocardium with normal perfusion represents pure myocardial stunning. Perfusion defects outside delayed hyperenhancement represents additional microvascular stunning, since it resolved on follow up examination (extent in the acute phase 82±12°, on follow up 59±10°, p<0.001, n=15). Perfusion defects presenting microvascular stunning always showed a delayed wash in pattern. At follow up perfusion defects and delayed hyperenhanced areas were closely correlated and did not differ in extent resulting in close match between perfusion defects and delayed hyperenhancement (59±10° and 55±12°, ns).
Conclusion: Multisequential cardiac MR provides a comprehensive means for assessment of microvascular and myocardial viability states following AMI. It identifies microvascular stunning in a single rest examination.
Figure 1.
214. Quantitative Assessment of Global LV Function Using Sensitivity Encoding (SENSE) Accelerated Balanced FFE
Mercedes Pereyra, Radiology Technologist,1 Margit A. Nemeth, MD,2 Raja Muthupillai, PhD,3 Scott D. Flamm, MD.4
Cardiovascular MRI, St luke's Episcopal Hospital/Texas Heart Institute, Houston, TX, USA, Department of Cardiology, St. Luke's Episcopal Hospital at Texas Heart Institute, Houston, TX 77030, TX, USA, Clinical Science and Radiology, Philips Medical Systems and Baylor College of Medicine, Bothel, WA, TX, USA, Departments of Cardiology and Radiology, St. Luke's Episcopal Hospital, Houston, TX, USA.
Background: An important and routine component of cardiac MRI is the determination of global LV function. Because of the higher SNR and myocardium to blood contrast offered by the Steady State Free Precession (Balanced FFE, TrueFISP, FIESTA) techniques compared to conventional gradient echo techniques (T1-TFE, SPGR, FLASH), they are now routinely used for assessing global LV function [1,2]. Recent developments in parallel imaging techniques such as SENSE permit trading SNR to gain acquisition speed, without compromising spatial resolution [3]. Routine clinical adoption of MRI for the evaluation of heart disease would be facilitated by a rapid assessment of LV function without compromising spatial, temporal, and contrast resolution as well as the accuracy of quantitative evaluation. In this respect, the high SNR intrinsic to the Balanced FFE (bFFE) sequence, makes it a suitable candidate for combining it with a parallel acquisition technique such as SENSE for accelerating conventional LV functional assessment.
Purpose: The purpose of the study was to quantitatively compare LV function analysis using a conventional multi-slice, multi-phase bFFE acquisition with a SENSE accelerated cine bFFE acquisition.
Methods: Data Acquisition: 10 patients (5 males, age 55 +/− 12) referred for MRI assessment of LV function were imaged on a 1.5T commercial imager (Philips Gyroscan NT-Intera) using a 5-element synergy cardiac coil and using Vector-cardiographic gating. Following initial scout images, the bFFE sequence was used to obtain a series of short-axis slices to cover the entire LV (10–14 slices, 8 mm slices, skip 2 mm).
bFFE: The acquisition parameters for the bFFE (without SENSE) sequence were: TR/TE/flip=3.4 msec/1.7 msec/55 deg; temporal resolution or cardiac phase interval 36–40 msec; acquired in-plane spatial resolution 1.5–1.75 sq. mm depending on patient size; breath-hold duration: 14 heart beats/slice.
bFFE with SENSE: With SENSE, all acquisition parameters including spatial and temporal resolution were identical to the conventional bFFE cine acquisition above except the following: the number of in-plane phase encoding steps were halved. This reduction in acquisition time per slice permitted collecting two slices per breath-hold using SENSE.
Reference scan: Coil sensitivity maps necessary for SENSE reconstruction were acquired using a low-resolution reference scan (9×9×9 mm) as has been described previously (52 s acquisition duration) [3].
Post Processing: Data were transferred to a post-processing workstation (EasyVision, Philips Medical Systems, Release 5.0) for analysis of LV function. Two observers drew the endocardial and epicardial contours on each slice of the LV at end-diastole and end-systole. From these contours, end-diastolic volume (EDV), end-systolic volume (ESV), and left ventricular mass (LVM) were computed using the Simpson's algorithm. From these, derived parameters such as stroke volume (SV=EDV−ESV), and ejection fraction (EF=SV/EDV) were also calculated. The blood to muscle contrast-to-noise ratio (CNR) was also calculated.
Data Analysis: The mean and standard deviation were calculated for all parameters. The agreement between the conventional and SENSE bFFE measurements was assessed using Bland and Altman's method [4]. Pearson's correlation coefficient (r) was calculated for the two techniques. Inter-observer variability was assessed using the Bland-Altman method.
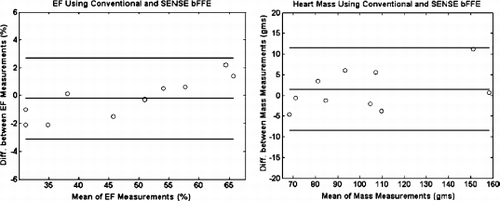
Results: Representative diastolic and systolic LV short axis bFFE images obtained with and without using SENSE are shown in Fig. . The EF and LV mass computed using the two techniques were in good agreement (mean bias EF (in %): −0.2+/−1.45, mean bias LV mass (in gms): 1.5+/−5). The limits of agreement between the two techniques were as follows: EF: 2.7 to −3.1, and LV mass: 11.5 to −8.5. The detailed results are shown in Figs. respectively. The Pearson's correlation coefficient (r2) were: 0.99 and 0.97 for the evaluation of EF and LV mass respectively. With SENSE, the scan time was reduced by 40%, compared to without. Note that the scan time reduction is not 50% as might be expected, because the time for completion of the reference scan is included in the SENSE bFFE total acquisition time. As expected, the blood-to-muscle CNR was virtually identical between the two techniques, viz., 24.6+/−6.8 with conventional bFFE and 24.5+/−7.6 when using SENSE.
Discussion: The main findings of this study are as follows: (a) it is possible to combine SENSE with conventional bFFE cine acquisition and reduce total cine acquisition time by 40%, and (b) this scan time reduction does not impose any compromise on spatial resolution, temporal resolution, blood-to-muscle CNR, or the accuracy of quantitative data used for LV function assessment.
Conclusion: It is feasible to combine SENSE with bFFE to shorten the MRI acquisition times associated with the assessment of LV function.
Figure 1. End diastolic and end systolic volumes using the conventional bFFE (A and B) without using SENSE and with SENSE (C and D).
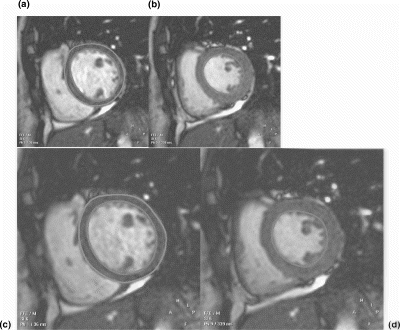
Figure 2. Bland Altman plots reflecting the degree of agreement between the conventional bFFE and SENSE bFFE for the evaluation of EF (left) and LV mass (right). The central line indicates the bias, the outer lines indicate the limits of agreement.
References
1. Carr JC, Simonetti O, Bundy J, Li D, Pereles S, Finn JP. Cine MR angiography of the heart with segmented true fast imaging with steady-state precession. Radiology 2001; 219: 828–834.
2. Plein S, Bloomer TN, Ridgway JP, Jones TR, Bainbridge GJ, Sivananthan MU. Steady-state free precession magnetic resonance imaging of the heart: comparison with segmented k-space gradient-echo imaging. J Magn Reson Imaging 2001; 14: 230–236.
3. Pruessmann KP, Weiger M, Scheidegger MB, Boesiger P. SENSE: sensitivity encoding for fast MRI. Magn Reson Med 1999;42, 952–962.
4. Bland JM, Altman DG. Statistical methods for assessing agreement between two methods of clinical measurement. Lancet 1986; 1: 307–310.
215. Comparison Between Myocardial Blush Grade and MRI Myocardial Perfusion After Successful Percutaneous Coronary Intervention (PCI) in Acute Myocardial Infarction (AMI)
Pavel Hoffmann, Gunvor O. Anker, Magne Brekke, Sigrun Halvorsen, Knut-Haakon Stenseth, Martin Sokjer, Edmund Sovik, Nils-Einar Klow.
Dept. of Cardiovascular Radiology, Ulleval University Hospital, Oslo, Norway.
Introduction: Primary angioplasty of acute myocardial infarction increases both short- and long term survival. Therefore, PCI is the preferred method of therapy of transmural AMI in our institution. However, myocardial perfusion may be impaired after PCI of AMI despite restoration of normal epicardial blood flow. Increasing evidence suggests that disordered micro vascular function and inadequate myocardial tissue perfusion are often present despite infarct vessel patency. Myocardial perfusion assessed as staining and clearance of contrast medium in the myocardium following successful PCI of AMI is a predictor for long-term mortality. Cardiac MRI is also well suited to study myocardial perfusion and viability and may be a valuable tool in risk stratification following successful reperfusion of AMI. In addition, diastolic and systolic myocardial function, infarction size and location can be evaluated.
Purpose: The purpose of the present study was to assess the relationship between angiographically measured myocardial blushing grade and contrast enhanced perfusion MRI, and relate these findings to patient outcome and recovery of left ventricular function.
Methods: Totally 24 patients with ST-elevation AMI and a duration of chest pain of less than six hours were prospectively included to the study. Patients with previous history of AMI were excluded. Following acute PCI, restoration of normal epicardial blood flow was required.
Myocardial blush grade was defined in all patients following PCI as follows: 0=no visible tissue staining, 1=myocardial blush but no wash out, 2=myocardial blush but delayed wash out and 3=normal blush and normal of wash out of contrast from the infarct artery related myocardium. Twelve patients had blush grade 0 & 1 (group I) and twelve patients had blush grade 2 & 3 (group II).
The MRI study was performed on the third day (range 2–5 days) after the AMI, and then repeated after three months. MRI examinations were performed in a Philips 1.5 T scanner (Intera 8). Each MRI examination included a cine 2 chamber short axis view covering the whole left ventricle, a 2 chamber long axis view and a 4 chamber long axis view performed as balanced FFE. First pass perfusion study was performed in 3–4 SA slices after administration of 0.05 mmol/kg bw of Gadolinium DTPA, performed as FGE with saturation prepulse. Finally, late enhancement study was done as FGE with inversion prepulse after 15 minutes, following injection of further 0.1 mmol/kg bw of Gadolinium DTPA and covered again the whole left ventricle in short axis. The study parameters were ejection fraction (EF), end diastolic and end systolic volumes, left ventricular myocardial volume, perfusion measured as peak signal intensity and time to peak signal intensity, and delayed enhancement measured as location and volume of the infarction.
Blood samples of all patients were registered and all patients were further clinically examined and classified prior to discharge from hospital, and again after 3 months. AMI was recorded by leakage of enzymes (CK, CKMB, TnT) and whether a Q-wave was visible in the ECG. Exercise ECG was performed at 3 months.
Data are presented as mean±SD and t-test was used for statistical analyses.
Results: In both groups 12 patients were included. However, at three months, 4 of the patients in group I did not want to participate in the control MRI and clinical examination. One of these 4 patients needed revascularization due to stent occlusion the first week post AMI.
When the results were analyzed according to the blushing grade, there was a significant difference between groups in the time from onset of chest-pain to the revascularization, 238±92 compared to 155±64 minutes (p<0,05), in group I and II, respectively. There were no significant differences between groups in any MRI data or in any laboratory data. However, considering the low number of patients, there was a strong tendency for lower CK values, higher EF and a smaller infarction volume both at 3 days and at 3 months in group II compared to group I (Table ). Further, the infarction size, measured as delayed wash out 15 min after contrast injection, was rather small in both groups (Table ).
Interestingly, when laboratory and MRI data from group I and II were cumulated and analyzed, there was a correlation between time to revascularization and the infarction size (Fig. ), and also between CK values and infarction size measured by MRI (Fig. ), at both initial MRI and at 3 months.
Conclusions: The present study showed significant correlation between the time to revascularization and the blushing grade in patients with ST elevation AMI and normalized epicardial flow. There was also a tendency towards smaller infarction size in group II, measured by CK release and by MRI, although the number of patients included so far was small. Interestingly, there were strong correlations between the CK values and the MI size measured by MRI, and between the time to revascularization and MI size assessed by MRI. This indicates that MRI may be even more sensitive than the angiographic blushing grade as a predictor of cardiac function after AMI and successful PCI.
Figure 1.
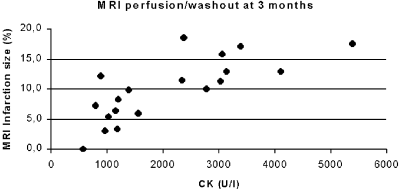
Figure 2.
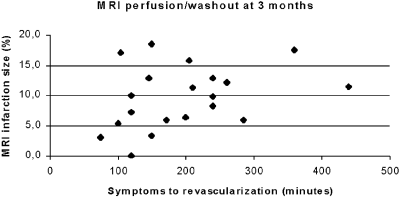
Table 1. Patient characteristics, laboratory data, and MRI data after average 3 days and at 3 months after PCI of AMI
216. The Relation of Different Washout Patterns of Delayed Enhancement MRI to the Severity of Myocardial Injury in Patients with Acute Myocardial Infarction
Hassan Abdel-Aty, Nidal Al-Saadi, Andrew J. Taylor, Jeanette Schulz-Menger, Rainer Dietz, Matthias G. Friedrich.
Cardiology, Franz-Volhard-Klinik, Charite, Campus Berlin-Buch,Humboldt University, Berlin, Germany.
Introduction: Delayed enhancement (DE) MR imaging accurately identifies irreversible myocardial injury following acute myocardial infarction (AMI). However, the relation between the temporal course and spatial extent of DE to the degree of myocardial injury, is not clear.
Purpose: We investigated the clinical utility of a dynamic DE approach in combination with T2-weighted MRI (STIR=short TI inversion recovery), to reflect the severity of the myocardial injury within the infarct zone.
Methods: We studied 26 patients (17 males, mean age 53±12y) 3±2days following reperfused first AMI on a 1.5 T scanner using a breathhold STIR sequence (TR 2 R–R intervals, TE 64 ms, TI 140 ms, number of slices 3) and DE imaging of the same short axis slices applying an inversion recovery gradient echo pulse sequence (TR 5.5 ms, TE 1.4 ms, TI 200–250 ms) applied every minute for 10 minutes following an iv bolus of Gd-DTPA (0.2 mmol/kgBW, Magnevist®, Schering AG, Germany). Only patients without evidence of microvascular obstruction (as detected on minute 2) were included in the analysis. (n=14).
DE was defined as regional myocardial enhancement >200% of the remote myocardium. The spatial extent of DE was calculated as a percentage of the total myocardial slice volume at every time point and was correlated to the percentage spatial extent of myocardial edema. The signal-to-noise ratio (SNR) of the infarct center and infarct periphery (the peripheral lateral 20% of the subendocardial total area of myocardial hyperenhancement and the subepicardial area at minute 3) as well as of the remote myocardium were calculated.
Results: A partial washout occurred at the infarct edges and from the subepicardial myocardium during the acquisition time. At minute 3, DE and edema were closely correlated (r=0.91, p<0.001) and did not differ in size. At minute 10, the area of DE was significantly smaller than at minute 3 (23%±10 vs. 36%±11, p<0.001) and also than that of the edema (23%±10 vs. 37%±9, p<0.001). At minute 10, the mean SNR of the infarct periphery was lower than that of the infarcted center (5.1±3 vs. 10.4±5, p<0.002) but remained significantly higher than that of the remote myocardium (5.1±3 vs. 2.9±0.7, p<0002). As known from the wave front theory, the injury is most severe in center and subendocardial myocardium. Thus, the degree of enhancement might correlate to the severity of myocardial injury. The most severly injured myocardium will show a more degree of DE.
Conclusion: After an intravenous bolus, Gd-DTPA initially accumulates in both, irreversibly injured myocardium and reversibly injured edematous tissue likely due to the increased volume of distribution in both injuries. During the subsequent 10 minutes, its washout is markedly delayed in the necrotic areas, but also decelerated in the peri-infarct edema as compared to remote myocardium. Thus, different washout patterns reflect the severity of myocardial injury.
217. Quantification of Myocardial Infarct Size: Comparison of Contrast-Enhanced Magnetic Resonance Imaging and Cardiac Enzyme Indices
Christian Schlundt,1 Johannes von Erffa,1 Stephan Achenbach,1 Dieter Ropers,1 Ralph Maeffert,1 Robert Kraehner,1 Michaela Schmidt,2 Niels Oesingmann,2 Josef Ludwig,1 Werner G. Daniel,1 Matthias Regenfus.1
Internal Medicine, Division of Cardiology, University of Erlangen-Nuremberg, Erlangen, Germany,Siemens Medical Solutions, Erlangen, Germany.
Introduction: Prognosis of patients with acute myocardial infarction depends on the mass of infarcted tissue and remaining left ventricular function. Contrast-enhanced magnetic resonance imaging (ceMRI) allows visualization and quantification of myocardial necrosis. For evaluation of the extent of infarcted myocardium, we compared enzyme indices of myocardial infarctions (MI) to the MRI measurements of infarct size.
Methods and Results: 39 patients (76% male, mean age: 60.9±11y) who suffered a first acute myocardial infarction underwent contrast-enhanced MRI on a 1.5 T scanner (SONATA®, Siemens) within 7 days of MI. In 25 patients, reperfusion had been achieved by acute percutaneous coronary intervention. Acquisition of short axis slices without inter-slice gap was performed 10 minutes after injection of Gd-DPTA (MAGNEVIST®, Schering 0.1 mmol/kg) with an inversion recovery TurboFLASH sequence (TE 4.0 ms, TR 8.0 ms, flip angle 20°) in multiple breath-holds. The pattern of hyperenhancement representing MI was quantified by planimetry and the mass of infarcted tissue and its percentage of left ventricular mass were calculated. Based on serial measurements of creatin kinase-myocardial band (CKMB) and troponin I (TnI) every 6 hours from onset of MI to normalization of cardiac enzymes, peak values and area under the curve (AUC) were determined. Simple regression analysis was performed for comparison of MRI data and enzyme indices.
In patients with reperfusion therapy, AUC of CKMB (r=0.7, p<0.0004) and TnI (r=0.6, p<0.003) correlated closely to the mass of infarcted myocardium. Correlation for peak CKMB (r=0.8, p<0.0001) and peak TnI (r=0.6, p<0.003) to infarct size were comparable. In patients without acute revascularisation, peak values showed closer correlation (r=0.5, p<0.06 for CKMB and r=0.6, p<0.04 for TnI) to infarct size than AUC measurements (r=0.3, p<0.2 for CKMB and r=0.6, p<0.003 for TnI).
Conclusion: AUC and peak measurements of CKMB and TnI correlate closely to the mass of infarcted myocardium as assessed by ceMRI, especially in patients with reperfusion therapy. In patients without acute reperfusion therapy this is less pronounced.
218. Infarct Size Measurement by Delayed Enhancement as a Primary Endpoint for Studies Comparing Reperfusion Strategies in Acute Myocardial Infarction—A Suitable Tool?
Mathias J. E. Kappl,1 Holger Thiele,1 Stefan Conradi,2 Gerhard Schuler.1
Clinic of Internal Medicine/Cardiology, University of Leipzig—Heart Center, Leipzig, Germany, Radiology, University of Leipzig—Heart Center, Leipzig, Germany.
Introduction: Using mortality as a primary study endpoint in studies comparing different reperfusion strategies requires increasingly large sample sizes to test advances with existing therapy, which is already highly effective. Recently, there has been growing interest in infarct size measurements as a surrogate endpoint, which allows a much smaller sample size. There are several methods to assess infarct size, which include SPECT imaging or the indirect assessment by the release of CK, CK-MB or Troponin T or I. However, SPECT is hampered by a low spatial resolution, which does not allow to assess small infarcted areas and the measurement of cardiac enzyme release is influenced by several factors, thus making these methods not an optimal tool to assess infarct size. Delayed enhancement MRI allows the direct visualization of infarcted or necrotic tissue at a very high spatial and may therefore be an optimal imaging method to assess infarct size, if it can be assessed with low intra- and interobserver variability.
Purpose: To asses intra- and interobserver variability in a large study group of patients with a recent myocardial infarction.
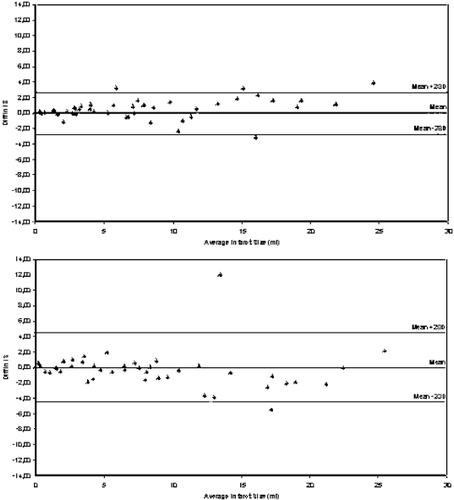
Methods: In 49 patients six months after an acute myocardial infarction cine loops of the complete heart in short and horizontal long-axis planes were acquired using a steady-state free precession technique (TR/TE/flip=3.2/1.2/60). Delayed enhancement images covering the whole ventricle were acquired 20 min after a double-bolus of Gadolinium-BOPTA (Gadovist, Schering, Germany) using a 3 D inversion recovery gradient echo sequence (TR/TE/flip 2.8/1.1/15). Off-line image analysis was performed on a dedicated workstation (EasyVision, Release 5.2, Philips Medical Systems, Best, The Netherlands). Total left ventricular myocardial mass and infarct size volume were assessed by two independent observers. Infarct size was expressed as percentage of the delayed enhancement volume of the total LV mass and compared to the CK-release. Inter- and intraobserver variabilities were assessed according to standard definitions and compared by the method of Bland and Altman. Image quality was assessed by a score ranging from 0–4 (0=not assessable; 4=optimal image quality).
Results: All images were suitable for assessment of the infarct size. Mean percentage infarct size was 7.3±6.7 % range 0–26%). There was a moderate correlation of the infarct size assessed by delayed enhancement in comparison to the area under the curve of the CK-release (r=0.6). However, in 5 patients with a low CK-release no delayed enhancement could be detected. Intra- and interobserver variability was low for the assessment of the infarct size by MRI (r=0.95–0.98). The Figs. show the Bland–Altman-Plots for intra- (Fig. ) and interobserver variability (Fig. ). In patients with good image quality (score 3–4) inter- and intraobserver variability was 0.98–0.99 and with low image quality 0.91–0.98.
Conclusions: Infarct size measurement by delayed enhancement MRI is an excellent tool for infarct size assessment due to its low intra- and interobserver variability even in case of an impaired image quality. It has therefore the potential to serve as a surrogate endpoint to uncover advantages of new reperfusion strategies.
Figure 1a,b. Intraobserver variability.
219. Detection of Severe Coronary Artery Stenoses with Upright Treadmill Magnetic Resonance Imaging; Direct Comparison with Exercise Echocardiography
Pairoj Rerkpattanapipat,1 Sanjay Gandhi,1 Stephen Darty,1 R. Taylor Williams,1 April Davis,1 Wojciech Mazur,1 Hollins Clark,1 William Little,1 Kerry Link,2 Craig Hamilton,3 W. Gregory Hundley.1
Cardiology, Wake Forest University School of Medicine, Winston-Salem, NC, USA,Radiology, Wake Forest University School of Medicine, Winston-Salem, NC, USA,Medical Engineering, Wake Forest University School of Medicine, Winston-Salem, NC, USA.
Introduction: Due to an inability to acquire immediately post-stress images of LV function in slice positions similar to those obtained pre-stress, magnetic resonance imaging (MRI) assessments of left ventricular (LV) regional wall motion after upright treadmill exercise stress testing have not been performed.
Purpose: To overcome this limitation, we developed a method to reproduce pre-stress slice positions and acquire images rapidly after upright treadmill exercise. We compared the utility of this form of testing to stress echocardiography (SE) for detecting severe (>70%) coronary arterial luminal narrowings.
Methods: In 21 patients with exertional chest pain referred for SE and contrast coronary angiography, we performed MRI exams before and immediately after upright treadmill exercise according to a standard Bruce protocol. Cine wall motion images were acquired in 3 short axis planes of the left ventricle using a fast imaging employing steady-state acquisition technique. SE was performed according to the protocol recommended by the American Society of Echocardiography. Two independent observers interpreted the MRI and echocardiographic results without the knowledge of patients' history, and the results of other cardiovascular testing. Inducible ischemia was defined as a deterioration in regional wall motion post stress compared to baseline.
Results: All patients completed the entire exercise MRI protocol (pre exercise imaging, stress test, and post exercise imaging) in 15 to 25 minutes without an untoward complication during testing. Post-exercise image acquisition was completed in an average of 61 seconds after exercise cessation. Apical short axis views were not well visualized in 4 patients due to respiratory motion artifacts; otherwise, all segments were well visualized. Ten patients had coronary arterial luminal narrowings >70% on coronary angiography. The sensitivity and specificity of exercise MRI 80% and 82%, echocardiography 80% and 55% to detect >70% coronary arterial luminal narrowings by coronary angiography were good.
Conclusions: These preliminary results indicate that results obtained with treadmill MRI are comparable to those obtained with SE for detecting >70% coronary arterial luminal narrowings in patients with chest pain.
220. BOLD-MRI Visualizes No-Reflow in Patients with Acute Myocardial Infarction
Andreas Kumar, M.D., Hassan Abdel-Aty, M.D., Jeanette Schulz-Menger, M.D., Rainer Dietz, Prof., M.D., Matthias G. Friedrich.
Cardiology, Charité Franz-Volhard-Klinik, Humboldt University Berlin, Berlin, Germany.
Introduction: No reflow areas within acutely infarcted myocardial segments can be detected by contrast-enhanced MRI. Little is known however about the clinical utility of non-contrast gradient echo MR imaging to detect post reperfusion no reflow.
Purpose: The purpose of this study was to evaluate whether BOLD-MRI could be used as a non-contrast technique for the visualization of no-reflow in patients with acute reperfused myocardial infarction.
Methods: Twenty-four patients (19 males and 5 females, mean age 54.4y +/−9) with reperfused first acute myocardial infarction, infarct age 4d +/−3 (localization: inferior 9, anterior 9 and lateral 6) were studied on a 1.5 T clinical scanner (GE, CV/i, Milwaukee). We applied a BOLD-sensitive Echo Planar Gradient Echo (BOLD-MRI) pulse sequence (TR=1 R–R interval, TE 16–18 msec, flip angle 20) and a contrast-enhanced inversion pulse-prepared gradient-echo sequence (In-GR) every minute after the application of 0.1 mmol/kg bw of Gd-DTPA for five minutes (TR, TE, TI, 5.5, 1.4, 200–250 msec). Images derived from each pulse sequence were evaluated by an independent observer. The early In-GR images were evaluated for the presence or absence of no reflow areas (hypoenhanced core). Regions of interest (ROI) were drawn within areas of abnormal signal in BOLD and in the remote myocardium and signal intensity percentage difference was calculated.
Results: Utilizing In-GR, 14 infarcts showed evidence of no reflow (MO+) whilst 10 showed homogenous Gadolinium enhancement (MO−) in the infarcted area. On BOLD-MRI in the entire MO+ group a subendocardial area of low signal (mean difference 62.65% +/− 5.90) was detectable, matching in location and shape the hypoenhanced core identified in In-GR. Of the 10 MO-infarcts, a corresponding high signal in BOLD-MRI (mean difference 44.32% +/−7) was present in 6 cases.
Conclusion: BOLD-MRI can detect no reflow areas within reperfused acute myocardial infarction without the use of a contrast-agent. This may provide a means of assessing the severity of reperfusion injury after AMI.
221. Perfusion Measurements for the Detection of Coronary Artery Disease
Eike Nagel, MD,1 Christoph Klein, MD,2 Ingo Paetsch, MD,2 Sabine Hettwer,2 Bernhard Schnackenburg, PhD,3 Eckart Fleck, MD.2
Cardiology—CMR, German Heart Institute Berlin, Berlin, Germany, German Heart Institute Berlin, Berlin, Germany, Philips Research Laboratories, Hamburg, Germany.
Introduction: With magnetic resonance imaging (MR) an index of myocardial perfusion reserve (MPRI) can be determined.
Purpose: We assessed the value of this technique for the noninvasive detection of coronary artery disease (CAD) in patients with suspected coronary artery disease.
Methods: 80 patients referred for a primary diagnostic coronary angiography were examined with a 1.5 T MR tomograph (Philips ACS). Each heart beat 5 slices were acquired during the first pass of 0.025 mmol Gd-DTPA/kg body weight before and during adenosine vasodilation using a turbo-gradient-echo-EPI-hybrid sequence. MPRI was determined from the alteration of the upslope of the myocardial signal intensity curves for 6 equiangular segments per slice. Receiver operated characteristics were performed for different MR criteria to differentiate ischemic and nonischemic segments.
Results: Prevalence of CAD was 50%. Best results were achieved, when only the three inner slices were assessed and a threshold value of 1.1 was used for the second smallest value as a marker for significant coronary artery disease. This approach yielded a sensitivity of 90%; specificity of 93% and an accuracy of 91%.
Conclusions: The determination of MPRI with MR yields a high diagnostic accuracy in patients with suspected coronary artery disease.
Figure 1. SM5=smallest value of 5 slices; SM3=smallest value of 3 slices; SSM3=second smallest value of 3 slices.
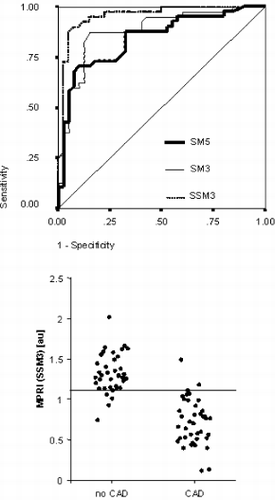
222. Contrast-Enhanced Cine Magnetic Resonance: A New Technique to Simultaneously Evaluate Ventricular Function, Viability, and Microvascular Dysfunction in Myocardial Infarction
Gilbert L. Raff.
Division of Cardiology, William Beaumont Hospital, Royal Oak, MI, USA.
Background: Rapid diagnosis of hibernating myocardium and microvascular dysfunction (MD) may increase use of cardiac magnetic resonance (CMR) for interventional therapy of acute coronary syndromes. Standard techniques (ST) of CMR require a cine function study and a delayed enhancement study to make these diagnoses. We have developed a new method, contrast-enhanced cine CMR (CEC) that evaluates both in one exam. This study compared CEC to ST for diagnosis and exam time.
Methods: 18 patients (pts) have been studied to date; 7 AMI pts studied within 24 hours and 1-week post-MI, and 11 chronic MI pts. After first-pass perfusion with 0.20 mmol/kg Gd-DTPA, pts were imaged using an ECG-gated, segmented k-space, inversion recovery, multi-slice true-FISP sequence with continuous RF excitation to maintain steady-state conditions. 9 interleaved short axis slices and horizontal and vertical long-axis were done on a 1.5T Siemens Sonata with 40mT gradients. SD was done by inversion-recovery turbo-FLASH sequence. Areas and transmurality of delayed hyperenhancement (DH) and MD were measured by planimetry.
Results: DH was strongly correlated between the two methods (0.92, P<0.0001), as was transmurality (0.60, P<0.0001) and MD (0.60, P<0.0001). CEC reduced mean exam time by 38% (15 +/− 6 minutes vs 9 +/− 5 minutes).
Conclusions: Contrast-enhanced cine CMR identifies hibernating myocardium and microvascular dysfunction more rapidly than standard CMR techniques, with comparable results. These potential advantages may enhance the utility of CMR for patients undergoing interventional procedures and improve throughput in busy clinical settings.
223. Safety and Efficacy of Adenosine Stress Perfusion Cardiac MRI in Pediatric Cardiac Disease
Khan M. Siddiqui, MD,1 Cathleen A. Woomert, MD,1 Paul D. Francis, MD,2 Fredrick K. Emge, MD.2
Radiology, Geisinger Medical Center, Danville, PA, USA, Pediatric Cardiology, Geisinger Medical Center, Danville, PA, USA.
Introduction: Children with complex heart diseases are often at risk for ischemic injury related to surgical intervention or an underlying anatomic diagnosis, which can put them at risk for diminished ventricular function, arrhythmias and sudden death. Acquired cardiac diseases, such as Kawasaki disease, may prove even more deadly in the pediatric population. Various forms of imaging modalities and exercise testing have been employed to evaluate the risks in these patients and monitor them longitudinally. For evaluation of ischemia, nuclear cardiac imaging has proven to be inferior in complex pediatric and acquired cardiac diseases. Stress perfusion magnetic resonance imaging has become an accepted and safe method for evaluating ischemic heart disease in the adult population.
Purpose: We evaluated the impact of adenosine stress perfusion magnetic resonance imaging (ASPMRI) on patients with a history of coronary artery ostial re-implantations, aortic root reconstruction and acquired diseases, such as Kawasaki disease.
Methods: We retrospectively evaluated 36 consecutive patients undergoing ASPMRI of the heart (age range: 6 months to 17 years) with various clinical diagnoses. All patients received conscious sedation as per pediatric conscious sedation protocol of our institution. Patients initially underwent anatomic and functional cardiac magnetic resonance imaging (MRI), followed by contrast enhanced ASPMRI. Results of the imaging study were reviewed jointly by the pediatric cardiologists and radiologists.
Results: ASPMRI was 100% diagnostic in our patients. In 100% of patients it provided additional information other than conventional studies such as nuclear cardiac imaging, echocardiography and cardiac catheterization. The variety of findings ranged from frank perfusion defects to evidence of acute or old myocardial infarction or scar. ASPMRI decreased the need for additional or repeat imaging in all cases. There was a positive impact on cost, length of stay and promptness of medical or surgical management in all the patients. Only one patient complained of mild chest pain during the stress imaging, which also had a positive ASPMRI. No other complications were seen. None of the patients were intubated.
Conclusions: In recent years, with advancement in MRI, the ability to image the myocardium for anatomic and functional studies has improved significantly. Cardiac MRI provides definitive findings that correspond to cardiac catheterization and clinical symptoms, as compared to nuclear imaging. Cardiac MRI with stress perfusion offers superior spatial resolution, defining clinically relevant ischemic defects with high sensitivity and specificity, while being a safe test in the pediatric patient.
224. Semiquantitative Analysis of Myocardial Perfusion Imaging with SENSE
Sven Plein, Alexsandra Radjenovic, John P. Greenwood, John P. Ridgway, Stephen G. Ball, Mohan U. Sivananthan.
Cardiac MRI Unit, Leeds General Infirmary, Leeds, United Kingdom.
Introduction: First pass magnetic resonance (MR) perfusion imaging can be used to assess myocardial blood flow but most previous studies have been limited to acquisition of a single imaging slice. More recently, the use of hybrid EPI techniques for MR myocardial perfusion imaging has been reported, allowing faster data acquisition and multislice coverage of the heart. Alternatively, parallel data acquisition methods can be used to shorten data acquisition times and allow multi-slice myocardial perfusion imaging.
Purpose: 1. To assess the feasibility of MR myocardial perfusion imaging combined with sensitivity encoding (SENSE) in a large and unselected patient population.
2. To analyse perfusion data semiquantitatively by calculating a myocardial perfusion index (MPRI).
3. To compare the diagnostic accuracy of MPRI analysis against x-ray angiography.
Methods: One-hundred and four subjects (90 patients and 14 healthy volunteers) underwent MR perfusion imaging on a 1.5 T Gyroscan Intera CV (Philips Medical Systems, The Netherlands) equipped with Master gradients (30 mT/m peak gradients and 150 m/T/sec slew rate). After survey scans and a reference scan to provide a three-dimensional coil sensitivity map for SENSE, resting perfusion was assessed using a dynamic segmented k-space gradient echo pulse sequence combined with SENSE (Saturation recovery T1-weighted Turbo Field Echo, TR 3.1 ms, TE 1.6 ms, flip angle 15°, single saturation pulse, 4 short-axis slices acquired at every heart beat in sequential order from base to apex, saturation recovery times 42, 164, 287 and 410 ms, respectively, in-plane spatial resolution 2.5–4 mm, 8 mm slice thickness, SENSE-factor 2, data acquired over 40 seconds in 2 breatholds). The 4 slices were distributed to cover the heart between apex (slice 1) and outflow tract (slice 4). Gadolinium-DTPA (Magnevist, Schering AG, Berlin, Germany) was injected with a power injector (Spectris MR injection system, Medrad, Indianola, PA) into an antecubital vein at a dose of 0.05 mmol/kg bodyweight and an injection rate of 6 ml/sec, followed by a flush of 10 ml saline.
20 min after the rest perfusion scan, adenosine was infused at a dose of 140 mcg/kg/min for 6 minutes and a stress perfusion scan acquired in the same geometry and using the same pulse sequence.
Slice 4, which was acquired nearest to the outflow tract and with the shortest delay after the saturation pulse, was used to calculate the arterial input function. A region of interest was placed in the blood pool and the maximal upslope of the SI-change calculated by applying a 5-point linear fit. For analysis of myocardial perfusion, slices 1 to 3 were divided radially into 12 segments and signal–intensity–time profiles were determined for the myocardium contained in each segment. The maxial upslope of the SI profiles was calculated using a 3-point linear fit. The data for rest and stress were normalised to the respective arterial input function and the baseline signal intensity. A myocardial perfusion reserve index (MPRI) between rest and stress upslopes was then calculated for each segment.
From the data acquired in 6 of the volunteers, thresholds (mean MPRI minus 1.75 SD) were defined. A separate threshold was defined for each slice. All patients underwent x-ray coronary angiography. Sensitivity and specificity of MPRI analysis to detect coronary artery stenosis of more than 75% on x-ray angiography were determined. The MRI study was considered abnormal if two or more segments were below the threshold in a patient or coronary territory.
Results: 95 of the 104 data sets were suitable for analysis. 3 patients had claustrophobia, 1 was intolerant to Adenosine, in 2 the slice orientations of rest and stress data did not match, data from 1 patient was lost and in 2 subjects there were significant respiratory motion artifacts during the SI upslope.
Thresholds were 0.87, 1.39 and 1.29 for slices 1 to 3, respectively.
Table shows a contingency-table of MRI and x-ray results.
The sensitivity of MPRI analysis to detect signifcant coronary artery disease in patients was 81.6% with a specificity of 77.1% and a diagnostic accuracy of 80%.
Sensitivity and specificity were highest for analysis of the RCA (Fig. ).
On ROC analysis, slice 2 yielded the highest area under the curve and the highest diagnostic accuracy at the selected threshold. The low threshold of slice 1 resulted in low sensitivities for this slice (Fig. ).
Conclusions: Multi-slice MR myocardial perfusion imaging with SENSE is feasible in a clinical population. Semiquantitative analysis using a myocardial perfusion reserve index yields high diagnostic accuracy to detect coronary artery stenosis. Analysis of slices at midventricular level yields the best results.
Figure 1.
225. Contrast Enhanced 3D Free-Breathing Coronary MRA Using the Blood-Pool Agent B22956 (Gadocoletic Acid): Results from a Phase I Study
Ingo Paetsch,1 Michael Huber, MSc,2 Bernhard Schnackenburg, PhD,3 Friedrich Cavagna, PhD,4 Peter Boesiger, PhD,2 Matthias Stuber, PhD,5 Eike Nagel, MD.6
Cardiology, German Heart Institute, Berlin, Germany,University and ETH, Zurich, Switzerland,Philips Clinical Science, Hamburg, Germany,Imaging Department, Bracco Spa, Milan, Italy,BIDMC, Harvard Medical School, Boston, MA, USA,Cardiology, Germna Heart Institute, Berlin, Germany.
Background: Coronary magnetic resonance angiography (MRA) is a useful tool for the evaluation of coronary morphology and stenoses in proximal and mid coronary segments. Yet, assessment of distal coronary arterial segments and side branches is hampered by low signal from the coronary artery lumen. We tested B22956, a gadolinium-based paramagnetic bloodpool agent for contrast enhanced coronary MRA in a phase I trial.
Methods: The left coronary system was imaged in 12 volunteers before, 5 minutes (n=12) and 45 minutes (n=7) after application of 0.075 mmol/kg BW of B22956. Additionally, imaging of the right coronary system was performed. A 3-dimensional gradient echo sequence with T2 preparation (precontrast) or inversion recovery pulse (postcontrast) with real-time navigator correction was used. Signal-to-noise ratio (SNR), contrast-to-noise ratio (CNR), vessel sharpness, a visual score for image quality as well as angiographic parameters (visible vessel length, maximal luminal diameter and the number of visible side branches) were determined.
Results: Parameters of image quality, visible vessel length and the number of visible side branches increased significantly 5, 23 and 45 min after application of B22956 with the strongest effect at 5 min (e.g. SNR +42%, CNR +91%) (Fig. ).
Conclusions: The use of the intravascular contrast agent B22956 substantially improves both objective and subjective parameters of image quality in high-resolution 3D coronary MRA: the increase in SNR, CNR and vessel sharpness help to minimize current drawbacks of high resolution coronary MRA.
Figure 1.
226. Localization of Anterior Myocardial Infarction: Correlation Between Delayed Enhancement, “Scar” Magnetic Resonance Imaging, and Electrocardiographic Findings
Margit A. Nemeth, MD,1 James Michael Wilson, MD,1 Raja Muthupillai, PhD,2 Scott D. Flamm, MD,3 Robert J. Hall, MD.1
Cardiology, St. Luke's Episcopal Hospital/Texas Heart Institute, Houston, TX, USA, Phillips Medical Systems, Bothell, WA, USA, Cardiology and Diagnostic Radiology, St. Luke's Episcopal Hospital/Texas Heart Institute, Houston, TX, USA.
Background: In the late 1940s, Myers et al. established the electrocardiographic (ECG) criteria for localizing myocardial infarction (MI) by comparing ECG findings with autopsy data [1,2]. Since then, despite multiple studies based on autopsy findings, animal studies, and angiographic data, the criteria outlined by Myers et al. have been subjected to only a few modifications [3–6]. In general, while clinicians innately recognize that the accuracy of the spatial localization of MI using ECG is confounded by such factors as age, size, extent and location of the infarct, position and orientation of the heart within the chest, LV hypertrophy or dilatation, and presence of multiple infarcts [7], the ECG continues to be used to localize MI. Recent developments in contrast-enhanced, delayed enhancement (DE) cardiac MRI provide a means for non-invasively identifying irreversibly injured myocardium with very high spatial resolution [8]. Therefore, we hypothesized that MRI could be used to determine the accuracy of ECG based spatial localization of MI.
Purpose: The purpose of the study was to evaluate the diagnosis, spatial localization, and size and extent of MI as determined by the ECG criteria as compared to infarction information obtained from the DE MRI images in patients with isolated anterior MI.
Methods: Patient Population: Patients with isolated, anterior wall MI, as determined by the delayed enhancement MRI were included in this retrospective study (n=23, 19-male, 61+/−13 age). Nine of the 23 patients were imaged within 14 days of the infarction as determined by cardiac enzyme levels.
MRI data acquisition: All MRI data were collected at 1.5T (Philips NT-Intera, Rel. 7.× and Rel. 8.×). The delayed enhancement protocol is as follows. Fifteen minutes after the administration of Gd-DTPA (0.2 mmol/kg), a stack of short axis slices covering the entire LV were acquired using a Vector-cardiogram gated, inversion-recovery prepared segmented gradient echo (T1-TFE) technique during breath-holding. The specific acquisition parameters were: Field-of-View: 320–400 mm depending on patient size; matrix: 256×256; slice thickness/gap: 10 mm/0 mm; number of slices: 10–12 slices depending on size of heart; TR/TE/flip=7.1/1.5/15 deg; acquisition duration/RR interval: 180–200 msec during diastole; breath-hold time: 16–18 heartbeats. The inversion delay time (TI) was iteratively adjusted to null the signal from the normal myocardium, and ranged from 170–250 msec.
ECG data: Standard 12 lead ECGs of the patients were obtained within a week of the MRI for patients with acute MI and within 6 weeks for those with chronic MI. Patients with left bundle branch block were excluded from this study.
MRI data analysis: The short axis MRI data were analyzed using the AHA standardized 17-segment model [9] to assess the extent of infarct. Infarction was identified as those pixels with signal intensity >2SD above the normal remote myocardium. Each segment was graded on a scale of 0 through 5: 0: no-infarct; 1: 1–25% infarct; 2: 26–50% infarct; 3: 51–75% infarct; 4: 76–99% infarct; 5: 100% infarcted (transmural involvement of the entire segment). The percent area of infarction (PAI) was calculated as: (Ninf*Sinf)/(Ntot*Stot)*100, where Ninf, and Ntot are the number of infarcted and total segments respectively, and Sinf is the sum of scores of the infarcted segments and Stot is the maximum possible score (i.e., 17*5).
ECG analysis: Two experienced cardiologists reviewed the 12-lead ECGs without knowledge of the DE-MRI information. The ECG reviewers used the following criteria: (i) Evidence of Q-waves (duration ≥0.04 s), (ii) ST segment elevation (≥0.1 mV), and (iii) T-wave inversion. Based on the ECG findings, the clinicians described the presence of infarct, its spatial location, and the extent of infarct on the AHA standardized 17-segment model.
Results: MRI Results:
Spatial Localization of Infarction: All patients had varying degrees of involvement of the anterior wall; 17/23 (74%) had extension into the apex, 17/23 (74%) with superior and/or inferior septal involvement, and 7/23 (30%) with extension into the anterolateral wall.
Extent of Infarct: The mean percent infarct as described above was: 15 +/− 13, ranging from: 0.4 to 53%.
ECG Data:
Spatial Localization of Infarction: ECG data correctly identified the presence of infarction in 19/23 (83%) cases. ECG criteria correctly identified 12/17 (70%) infarct extensions into the apex, but identified only 10/17 (59%) when septum was involved, reflecting poor spatial localization by ECG.
Q-wave Data: Q-waves were present in V1–2 in 4 patients (17%), V1–3 or V2–3 in 6 patients (26%), and V1–4 or V2–4 in 5 patients (22%), and extended into leads V5 or V6 in 2 patients (8%). Diagnostic Q-waves were completely absent in 4 patients (17%). ECG and MRI results from one such patient is shown in Figs. .
Conclusions: The primary findings of this study are as follows: (i) ECG's have a high sensitivity for identifying anterior wall MI. (ii) The specificity for identifying involvement of basal, septal, and apical regions in anterior MI is poor. (iii) The absence of Q-waves does not rule out either prior myocardial infarction or presence of scar tissue.
Figure 1. ECG tracing from a patient with an anterior-septal infarct with no Q-waves in the precordial leads.
Figure 2. Delayed Enhancement images from the same patient reflecting irreversible injury in the sub-endocardial region of the anterior wall in the short axis (left) and the 2-chamber long axis view (right).
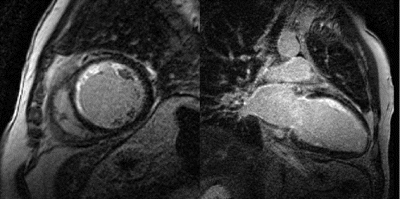
References
1. Myers GB, Klein HA, Stofer BE. Correlation of Electrocardiographic and Pathologic Findings in Anteroseptal Infarction. Am Heart J 36:535–575, 1948.
2. Myers GB, Klein HA, Hiratzka T. Correlation of Electrocardiographic and Pathologic Findings in Large Anterolateral Infarcts. Am Heart J 36: 838–881, 1948.
3. Fuchs RM, Achuff SC, Grunwald L, Yin FCP, Griffith LSC. Electrocardiographic Localization of Coronary Artery Narrowings: Studies During Myocardial Ischemia and Infarction in Patients with One-vessel Disease. Circ 66:1168–1175, 1982.
4. Engelen DJ, Gorgels AP, Cheriex EC, De Muinck ED, Oude Ophuis AJ, Dassen WR, Vainer J, van Ommen VG, Wellens HJ. Value of the Electrocardiogram in Localizing the Occlusion Site in the Left Anterior Descending Coronary Artery in Acute Anterior Myocardial Infarction.
5. Bogaty P, Boyer L, Rousseau L, Arsenault M. Is Anteroseptal Myocardial Infarction an Appropriate Term? Am J Med 113:37–41, 2002.
6. Shalev Y, Fogelman R, Oettinger M, Caspi A. Does the Electrocardiographic Pattern of “Anteroseptal” Myocardial Infarction Correlate with the Anatomic Location of Myocardial Injury? Am J Cardiol 75:763–766, 1995.
7. Chou T-C. Electrocardiography in clinical Practice, 4th ed. Philadelphia, WB Saunders, 1996.
8. Kim RJ, Chen EL, Lima JA, Judd RM. Myocardial Gd-DTPA kinetics determine MRI contrast enhancement and reflect the extent and severity of myocardial injury after acute reperfused infarction. Circ 94(12):3318–26, 1996.
9. Cerqueira MD, Weissman NJ, Dilsizian V, Jacobs AK, Kaul S, Laskey WK, Pennell DJ, Rumberger JA, Ryan T, Verani MS. Standardized Myocardial Segmentation and Nomenclature for Tomographic Imaging of the Heart. Circ 105:539–542, 2002.
227. Q Wave Myocardial Infarction and Transmural Delayed Contrast Hyperenhancement: How Good Is the Match?
Susan B. Yeon, MD, JD,1 Franz C. Aepfelbacher, MD,1 Mark E. Josephson, MD,1 Kraig V. Kissinger, BS, RT(R)(MR),1 Matthias Stuber, PhD,2 Kalon K. L. Ho, MD, MSc,1 Warren J. Manning, MD.1
Cardiovascular Division, Beth Israel Deaconess Medical Center, Boston, MA, USA,Beth Israel Deaconess Medical Center and Philips Medical Systems, Best, Netherlands.
Introduction: Anatomic data suggest that Q wave ECG evidence (QWMI) of myocardial infarction (MI) is a specific but insensitive test for histologically proven MI affecting ≥25–50% wall thickness (WT). While direct verification of the transmural extent of MI is rarely assessed clinically, MR delayed contrast hyperenhancement (HE) enables noninvasive mapping of the location and transmural extent of MI.
Purpose: Among subjects with coronary artery disease, we sought to determine (1) if more extensive HE occurs in regions with QWMI and (2) if ≥50% WT HE occurs in regions without QWMI.
Methods: Using a Philips 1.5 Intera CMR system, we performed inversion recovery T1w turbo field echo scans to assess left ventricular HE in 4- and 2-chamber, and contiguous short-axis views. We scored 6 segments in each short axis slice (4 for apical slices) for % WT HE extent as: 0=0%, 1=1–24%, 2=25–49%, 3=50–74%, 4=≥75%. We defined mean regional HE score as the sum of segmental HE scores in a region divided by the number of scored segments in the region. Presence and location of QWMI (defined by identification of significant Q wave or Q wave equivalent ECG evidence) was assessed by an independent blinded observer.
Results: Of 29 subjects, 8 had no QWMI, 13 had inferior QWMI, 11 had posterior QWMI and 8 had anterior QWMI, while 28 (97%) had ≥50% WT HE in one or more regions. Of 4 patients with LBBB, 3 had no QWMI in the presence of ≥50% WT HE. Among those with anterior QWMI, ≥50% WT HE was observed in a significantly greater percentage of anterior/anteroseptal segments than among those without anterior QWMI (Table ). However ≥50% WT HE was observed in 33±33% of anterior/anteroseptal segments among those without anterior QWMI. Analogous findings were observed among those with and without inferior QWMI (TABLE). In addition, mean HE score was significantly higher for regions corresponding to QWMI compared to those without QWMI (anterior/anteroseptal 3.2±0.8 vs. 1.7±1.4, p=0.005; inferior 2.7±1.3 vs. 1.5±1.3, p=0.01; posterior 3.2±0.9 vs. 1.3±1.3, p=0.0002).
Conclusions: While anatomically correlative ≥50% wall thickness HE is more extensive in regions with QWMI as compared with regions without QWMI, QWMI greatly underestimated the frequency and extent of ≥50% WT HE by MR.
228. Effects of Carvedilol on Left Ventricular Remodeling in Chronic Stable Heart Failure Demonstrated by Cardiovascular Magnetic Resonance
Nicholas G. Bellenger, MD, BSc,1 Kim Rajappan, MBBS,2 Avijit Lahiri, MBBS,3 Gordon Murray,4 Andrew Coats,2 Jon Cleland,5 Dudley Pennell, MD.2
CMR Unit, Royal Brompton Hospital, London, United Kingdom, Royal Brompton Hospital, London, United Kingdom, Northwick Park Hospital, London, United Kingdom, University of Edinburgh, Edinburgh, United Kingdom, University of Hull, Hull, United Kingdom.
Introduction: Therapeutic agents that interfere with neurohormonal pathways have demonstrated improvement in symptoms, left ventricular ejection fraction (EF) and survival in patients with heart failure. Data on left ventricular remodeling, however, is limited. Carvedilol is a third generation beta blocker that differs from compounds such as metoprolol and bisoprolol by blocking all 3 adrenergic receptors resulting in a more comprehensive antiadrenergic action in the failing heart. It's moderate initial vasodilatation by alpha blockade results in good patient tolerance, while additional antioxidant effects may contribute to its efficacy.
Purpose: To investigate whether treatment with carvedilol will result in a significant reduction in adverse left ventricular remodeling in patients with heart failure.
Methods: 34 patients with chronic stable heart failure were recruited from the CHRISTMAS trial of Carvedilol versus placebo. These patients underwent cardiovascular magnetic resonance assessment of left ventricular volumes, function and mass prior to and 6 months after randomization. This highly reproducible technique enables left ventricular remodeling to be studied in small sample sizes. There were no significant differences in baseline parameters between the two groups.
Results: In the carvedilol group, there was a significant 5% decrease in end diastolic volume index (Baseline EDVI of 139±46 ml/m2 p=0.05), a 9% decrease in end systolic volume index (Baseline ESVI of 100±48 ml/m2 p<0.001), and a 9% increase in EF (Baseline of 31±13%, p=0.003) over the study period. There were no significant changes in left ventricular mass in the carvedilol group, and no significant changes in any of the remodeling parameters within the placebo group. When analyzed for differences between the carvedilol and placebo groups, there was a significant difference in EDVI (p=0.05), ESVI (p<0.001), and EF (p=0.003) during the study.
Conclusions: Treatment of chronic stable heart failure with carvedilol resulted in significant reversal of adverse left ventricular remodeling, which might contribute to the beneficial effects on morbidity and mortality seen with carvedilol.
229. MRI Prediction of Contractile Recovery in Dysfunctional Myocardial Segments Following Revascularization: Can Regional Data Be Translated into Individual Patient Benefit?
Penelope R. Sensky,1 Graham R. Cherryman, FRCR,2 Richard P. Keal, FRCR,3 Norah M. Hudson, FRCR,3 Nilesh J. Samani, FRCP.1
Cardiology, Glenfield Hospital, Leicester, United Kingdom, Radiology, Leicester Royal Infirmary, Leicester, United Kingdom, Radiology, Glenfield Hospital, Leicester, United Kingdom.
Introduction: Functional and prognostic benefit may be attained from revascularization of patients with chronic ischemic left ventricular (LV) dysfunction. However, surgery carries increased peri-operative risk and no benefit may accrue if dysfunctional myocardium is predominantly scar.
Purpose: To evaluate potential MRI parameters of myocardial hibernation in chronic ischemic LV dysfunction in order to determine (i) predictive value for segmental myocardial recovery following revascularization and (ii) potential translation into prediction of individual patient clinical benefit.
Methods: Twenty-one patients with significant LV dysfunction, ejection fraction (EF) 37.6±10.3%, accepted for revascularization underwent clinical assessment, MRI (dual adenosine dobutamine stress protocol, Sensky et al, 2000) and rest/delayed thallium (Tl) scintigraphy. Dobutamine-induced contractile reserve (CR), end-diastolic wall thickness (EDWTH), delayed hyperenhancement (DHE), resting perfusion and Tl uptake were evaluated for prediction of recovery of dysfunctional segments as determined by post-operative MRI at six months. The proportion of dysfunctional segments suggesting viability according to each parameter was additionally correlated with functional and clinical recovery in individual patients.
Results: CR, EDWTH and DHE had the best predictive value for segmental LV recovery with sensitivities and specificities of 76.7, 70.1, 67.9% and 73.5, 68.1 and 56%, respectively. Values obtained for Tl were 44.5% and 48.1%. For prediction of improvement in ejection fraction ≥5%, the percentages of dysfunctional myocardial segments required to demonstrate CR, EDWTH, DHE and Tl uptake were >35%, >80%, >50% and 100%, respectively. Sensitivities and specificities obtained for these criteria were 100, 80,70, 80% and 72.8, 81.8, 72.7 and 80%, respectively.
Conclusions: The MRI parameters evaluated proved to have moderate to high sensitivity and specificity for the prediction of regional and global LV recovery post revascularization and most importantly, for prediction of individual patient clinical improvement. Development of parameter-specific criteria for the proportion of dysfunctional myocardial segments required to be identified as viable to produce post-operative benefit in an individual patient is paramount for optimal clinical management.
230. Reproducibility of Quantitative Measurements of Myocardial Perfusion in Volunteers
Penelope R. Sensky, MRCP,1 Nilesh J. Samani, FRCP,1 Mark A. Horsfield, CEng,2 Graham R. Cherryman, FRCR.3
Cardiology, Glenfield Hospital, Leicester, United Kingdom, Medical Physics, Leicester Royal Infirmary, Leicester, United Kingdom, Radiology, Leicester Royal Infirmary, Leicester, United Kingdom.
Introduction: Few data have been published evaluating the reproducibility of quantitative MRI measurements of myocardial perfusion. The unidirectional transfer coefficient of gadodiamide over the capillary membrane, Ki, has been proposed as a potential measure of myocardial blood flow (Larsson et al, 1996).
Purpose: To evaluate the reproducibility of Ki calculation in normal volunteers between images acquired on different days and within the same MRI examination.
Methods: Resting first pass contrast-enhanced MRI (1.5 Tesla Vision, Siemens, Erlangen, Germany) was performed in 5 subjects on 3 separate days, with single slice image acquisition at the mid-papillary level. An inversion recovery snapshot-FLASH sequence was used (TR=4.5 ms, TI=300 ms, TE=2 ms, FOV=3002 slice thickness=9 mm, 96×128 matrix, 25 measures, gadodiamide, 0.025 mmol/kg). This was repeated on each visit with a differing interscan time interval i.e. 5(A), 10(B) or 15(C) min. Ki values were calculated for 8 radial myocardial segments.
Results: Overall, regional Ki values (Table ) for baseline and second image acquisitions were similar, i.e. 37.6±11.3 and 35.5±10.4 ml/100 g/min (ns). A Bland Altman plot is shown in Fig. . Mean difference was 2.2±9.5 ml/100 g/min. Coefficient of repeatability was 52%.
Within each visit (Table ), Ki values for the second scan were unchanged from baseline. When baseline Ki values were compared, Ki was less at visit B than on visits A or C (p<0.001).
Conclusions: Ki calculation during a single visit appears to be repeatable regardless of the time interval between image acquisitions. Some inter-visit difference in Ki values was seen. This did not appear to be technique-related and may represent natural variation in myocardial flow. In the context of the degree of hyperaemia seen with adenosine stress, this variation is unlikely to be of clinical significance in application of the technique to stress imaging in patients with coronary artery disease.
Figure 1.
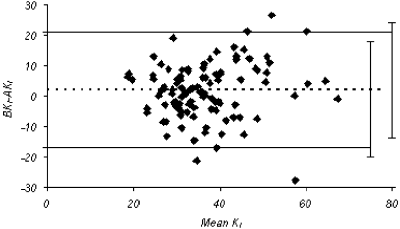
Table 1. Ki data
231. Contrast-Enhanced Magnetic Resonance Imaging in the Assessment of Microvascular Abnormalities in Hypertensive Patients with Left Ventricular Hypertrophy
Fadi Tannouri,1 Philippe Van De Borne, MD, PhD,2 Mohsen Rahnama, MD,2 Marc Renard, MD, PhD,2 Celso Matos, MD,1 Jafar Golzarian, MD.1
Radiology, Erasme Hospital, Brussels, Belgium, Cardiology, Erasme Hospital, Brussels, Belgium.
Introduction: Hypertension is frequently complicated by left ventricular hypertrophy (LVH) and ischemic heart disease. Silent ischemia is recognized as a distinct clinical entity related to microvascular abnormalities in left ventricular hypertrophy.
Purpose: The aim of this study is to evaluate the prevalence of LV microinfarctions determined by contrast-enhanced magnetic resonance imaging (MRI) in essential hypertensive patients with LVH but without clinical history of ischemic heart disease.
Methods: We prospectively studied 26 ambulatory essential hypertensive patients who were divided into three groups: 5 patients without LVH and without clinical history of ischemic heart disease (Group A), 16 patients with LVH and no clinical history of ischemic heart disease (Group B) and 5 patients with a clinical history of myocardial infarction (Group C).
All images were acquired on a 1.5T MRI unit (Intera, Phillips Medical System). ECG-gated cine MRI images were acquired at 6–8 short-axis locations during repeated breath-holds using B-FFE sequence. Gadolinium-enhanced MRI was performed ten minutes after intravenous administration of gadolinium (gadopentetate dimeglumine, GUERBET) at a dose of 0.2 mmole/kg of body weight. Contrast-enhanced images were acquired with the use of a segmented inversion recovery technique. The left ventricular mass was calculated after analyzing the Cine images (Easy Vision, Phillips Medical System). A blinded analysis of all images was performed by two observers. Only sections classified as presenting a late enhancement by both observers were considered positive. Data are represented as mean±SD. A value of p<0.05 was required to achieve statistical significance.
Results: None of the patients of group A presented a late enhancement. Left ventricular mass in this group was (106+/−8 g/m2) lower than in group B (139+/−14 g/m2) p<0.05. All the patients of group C presented a late enhancement at the known infarcted segment. Seven out of 16 patients of group B (44%) presented a small area of late enhancement. All these 7 patients presented ECG repolarization abnormalities. Left ventricular mass was higher in the 7 patients who presented a late enhancement than in the 9 patients from group B who did not (142±13 vs. 106±8 g/m2 p<0.05).
Conclusions: Our study reveals high prevalence of left ventricular MRI late enhancement in essential hypertensive patients with left ventricular hypertrophy who are free of clinical coronary heart disease.
232. Does Myocardial Infarction Always Involve the Endocardium?
James C. C. Moon, Andrew G. Elkington, Anna S. John, Mark Westwood, Dudley J. Pennell.
Royal Brompton Hospital, London, United Kingdom.
Introduction: It is a truth universally acknowledged that myocardial infarction always involves the endocardium.
Purpose: To assess the veracity of this statement.
Method: 82 patients with previous myocardial infarction underwent gadolinium-DTPA CMR. A standard inversion recovery FLASH or FISP short axis stack was acquired and analyzed. There were 28 acute infarcts (imaged within 10 days) and 54 patients with chronic infarction who were consecutive referrals for viability imaging or research studies and contained a large proportion of patients with infarction in multiple territories. Analysis was performed using a standard 17 segment model. Care was taken to exclude microvascular obstruction and preserved adjacent papillary muscles mimicking subendocardial sparing. The number of infarcts for each arterial territory was: LAD 51, LCx 25, RCA 27.
Result: 1394 segments were analyzed of which 644 (46%) contained infarction. The transmural extent of infarction per segment was: no infarction 54%, <25% infarction 15%, 25–50% infarction 12%, 50–75% infarction 6%, ≥75% infarction, 12%.
Subendocardial sparing was found in 17 segments (3% of all infarcted segments). In 13 cases, this was in the basal septal or anterior segments at the edge of a more distal anterior infarct, in 4 cases this was at the edge of inferior myocardial infarction. 1 patient with both an anterior and inferior infarct had extensive subendocardial sparing because the edges of the infarcts were close together. In 4 (100%) inferior and 9 (70%) anterior infarcts with edge subendocardial sparing, the sparing occurred on the septal rather than lateral/posterior side. Subendocardial sparing did not occur at the edges of circumflex territory infarcts.
Conclusion: Myocardial infarction always involves the endocardium but involves the mid-wall only at the infarct edge in a limited number of cases. The implication of this is that the demarcation between coronary vascular territories is not precisely the same in the epi-, mid- and endocardium leading to differential transmural sparing.
233. Endo- and Epimyocardial Perfusion in Healthy Volunteers: Assessment with MR First-Pass Perfusion Imaging
Olaf M. Muehling, MD,1 Prasad Panse, MD,2 Michael Jerosch-Herold, PhD,2 Betsy Wilson, RN,3 Robert Wilson,3 Leslie Miller, MD,3 Norbert Wilke, MD.2
Department of Medicine, Cardiac Imaging Section, University of Munich, Germany, Department of Radiology, Section of Cardiovascular MRI, University of Minnesota, MN, USA, Department of Medicine, Division of Cardiology, University of Minnesota, MN, USA.
Introduction: MR first pass perfusion (MRFP) imaging allows non-invasive assessment of transmural myocardial perfusion gradients.
Purpose: We evaluated separately endo- and epimyocardial perfusion in a group of healthy volunteers to establish normal values.
Methods: Fifteen healthy volunteers (age 34+/−9 yrs., 10 men) underwent MRFP imaging in a 1.5 T Siemens MR scanner. Resting perfusion imgages were acquired after i.v. injection of a low-dose Gd-DTPA (0.03 mmol/.l) bolus. After a delay of 15 minutes hyperemic perfusion images were acquired under adenosine i.v. (140 micg/kg BW/min). The ARGUS software (Siemens, Iselin/NJ) was used to generate signal intensity (SI)–time curves of the contrast bolus passing through the left ventricle and 4 (anterior, lateral, posterior, septal) equally sized myocardial segments of the myocardial short axis view. SI curves were generated separately for the endo- and epimyocardial layer. Absolute regional perfusion (ml/g/min) and perfusion reserve (PR=hyperemic/resting perfusion) were quantified using Fermi-model constrained deconvolution. Perfusion values were normalized to the rate-pressure product (RPP=mean RPP all/RPP individual).
Results: Overall endomyocardial PR was significantly lower than epimyocardial PR (3.6+/−1.5 vs. 4.9+/−1.8, p<0.01) due to a significantly higher resting perfusion in the endomyocardial layer (1.4+/−0.5 vs. 1.0+/−0.4, p<0.01). Only in the septum did the PR of endo- and epimyocardial layer not differ significantly (3.4+/-1.4 vs. 3.5+/−1.2, p=n.s.). This was due to a somewhat higher resting perfusion (1.1+/−0.4) and significantly lower hyperemic perfusion (3.6+/−1.2) in the epimyocardial septum.
Conclusions: MRFP imaging allows quantitative evaluation of transmural myocardial perfusion. Endomyocardial PR is lower than epimyocardial PR due to a higher baseline perfusion. This transmural PR gradient is not seen in the intraventricular septum, which has “two” (left and right ventricular) endomyocardial layers.
234. Myocardial Perfusion Imaging With Vistarem Enhanced Magnetic Resonance Compared To 99Mtc-sestamibi-spect
Jens Bremerich, MD,1 T Schindler, MD,2 P T. Buser, MD,2 M Friedrich, MD,3 B Wintersperger, MD,4 F Brunotte, MD,5 J Piek, MD,6 N Al-Saadi, MD,3 M Reiser, MD,4 K Bourdariat, MD,5 A Lalande, MD,5 D R Kool, MD,6 M Groenink, MD,6 J Struyven, MD,7 C Matos, MD,7 S Miller, MD,8 C Claussen, MD,8 G Adam, MD,9 C Weber, MD,9 M Sivananthan, MD,10 S Plein, MD,10 G Bongartz, MD.1
Radiology, University Hospital, Basel, Switzerland, Cardiology, University Hospital, Basel, Switzerland, Cardiology, University Hospital, Berlin, Germany, Radiology, University Hospital, Munich, Germany, Radiology, University Hospital, Dijon, France, Cardiology, University Hospital, Amsterdam, Netherlands, Radiology, University Hospital, Brussels, Belgium, Radiology, University Hospital, Tübingen, Germany, Radiology, University Hospital, Hamburg, Germany, General Infirmary, University Hospital, Leeds, United Kingdom.
Introduction: Intravascular contrast media would be desirable for myocardial perfusion imaging with magnetic resonance.
Purpose: This European Multicenter Phase II Trial seeks to compare myocardial perfusion imaging with 1) Vistarem enhanced MR and 2) 99mTc-Sestamibi-SPECT.
Methods: By September 2002, 103 patients with subacute myocardial infarction were included in 9 European centers. MR was conducted at 1.5 Tesla with phased array coils. Short axis MR images were acquired during the first pass of 0.0065 or 0.013 mmol/kg of the Gadolinium based rapid clearance contrast media Vistarem (Guerbet, France) at 2, 4, or 6 ml/s with a Saturation Recovery GRE Sequence. Moreover, equilibrium phase Inversion Recovery GRE MRI were acquired 5, 10, 20 and 30 min after contrast injection to assess late enhancement. Delta SI and SI-upslope were calculated. MR data was compared to standard 99mTc-Sestamibi SPECT.
Results: Vistarem was well tolerated. With 0.013 mmol/kg infarction was readily detected on dynamic first pass MR images as hypointense areas (Δ SI: 31±10 vs. 67±19) and as attenuated SI upslope (2.3±2.1 vs. 9.2±3.2). With 0.0065 mmol/kg infarction was not visible in all patients on first pass images, but upslope and delta SI were attenuated. Location and extent correlated well with 99mTc-Sestamibi-SPECT. Infarction was also visible on 86% of Inversion Recovery MR images.
Conclusion: MR enhanced with the rapid clearance, Gadolinium based, intravascular contrast media Vistarem may be useful for myocardial perfusion assessment.
235. 2D and 3D Delayed Enhancement MRI Following Acute Myocardial Infarction: Variability of Infarct Quantification
John P. Greenwood.
Cardiac MRI Unit, Leeds General Infirmary, Leeds, United Kingdom.
Introduction: Following acute myocardial infarction (AMI) the size of the infarct has prognostic significance. Cardiac MRI using the technique of delayed enhancement following the administration of a gadolinium based contrast agent can detect ‘scar’ tissue, and animal studies have confirmed the relationship between the area of ‘enhancement’ and the histological area of myocardial infarction. Compared to the standard 2D pulse sequence, a 3D acquisition sequence can be performed in a single breath-hold, which may confer a number of advantages, not least speed of acquisition.
Purpose: To assess the intra- and inter-observer variability of the 2D and 3D techniques for myocardial infarct quantification.
Methods: Nine patients were studied between day 2 and day 5 following their first acute myocardial infarction. All patients were haemodynamically stable, in sinus rhythm and provided informed written consent. Patients underwent imaging using a 1.5T Gyroscan Intera CV system (Philips Medical Systems, The Netherlands) equipped with Master gradients (30 mT/m peak gradients and 150 m/T/sec slew rate). All images were obtained during breath-holds and were gated to the ECG. Survey scans were taken to identify the true long and short axis. Gadolinium-DTPA (Magnevist, Schering AG, Germany) 0.2 mmol/kg was administered using a power injector (Spectris MR injection system, Medrad, USA) at a rate of 6 ml/sec into an antecubital fossa vein followed by a saline flush.
Fifteen minutes later contrast enhanced images were acquired in short axis with a segmented inversion–recovery gradient–echo pulse sequence. The correct inversion time was chosen in order that normal myocardium was ‘nulled’ typically between 240 and 300 ms. The entire left ventricle was covered using between 10 and 12 slices, 10 mm slice thickness with no slice gap. Both a 2D (∼10 sec breath-hold/slice; TE 1.9; TR 4.9) and 3D with sensitivity encoding in Y and Z directions (single ∼20 sec breath-hold; TE 1.2; TR 3.9) techniques were employed (FOV 350, flip angle 15 degrees, matrix 256×256). The 2D and 3D sequences were acquired in a random order, and between each acquisition 10 ms was added to the inversion time. Analysis was performed off-line by two experienced observers using commercial software (Mass 5.0, Medis, The Netherlands). Intra and inter-observer variability was expressed as the 95%CI of the mean of the individual differences.
Results: For measures of infarct size, intra-observer vs. inter-observer variability was 9% vs. 12% for the 2D technique, and 12% vs. 12% for the 3D technique.
Conclusions: The 2D technique appears to have lower intra-observer variability than the 3D technique, although the inter-observer variability's are the same. This may reflect the better image resolution with the 2D compared to the 3D technique.
236. Safety of MRI Perfusion Imaging Using Adenosine
Roquell Wyche, MD,1 Scott McGlynn, MD,2 Uzma Iqbal, MD,2 Srirama V. Swaminathan, Ph.D.,3 Anthon R. Fuisz, MD.2
Cardiac MRI, Washington Hospital Center, Washington, DC, USA, Cardiology, Washington Hospital Center, Washington, DC, USA, Clinical Science, Philips Medical Systems, N.A., Bothell, WA, USA.
Introduction: MRI perfusion imaging (MRPI) is a new method for detecting physiologically significant coronary stenosis that is usually performed with vasodilators.
Purpose: We reviewed the last 100 patients who underwent clinical adenosine MRPI for adverse events.
Methods: All patients were screened for contra-indications to MRI and adenosine (history of asthma and significant conduction delay) prior to entry into the MR suite. Patients were prepared with intravenous access in both arms, and counseled about the likely side effects of adenosine infusion. After functional imaging, the patients were withdrawn from the bore, and the adenosine infusion (140 mcg/kg/min) begun. Patients were observed during the initial infusion and placed into the bore either at 2 minutes or the occurrence of significant shortness of breath or flushing. Perfusion imaging was then performed using an intravenous bolus of 0.5 mmol/kg of gadolinium at a rate of 5cc/sec, followed by a bolus of 15 ml of saline at 5 ml/sec. The passage of contrast through the heart was watched in real time, and the adenosine infusion terminated after the contrast had fully enhanced the left ventricular muscle. Average duration of adenosine infusion was 3 minutes. Delayed hyper-enhancement imaging was performed 10 minutes after the end of the perfusion acquisition, as well as cine wall motion to detect prolonged ischemia if suspected. Duration of the studies averaged 45 minutes.
Results: One patient was unable to tolerate the adenosine infusion long enough to perform perfusion imaging. No patient suffered prolonged chest pain or myocardial infarction. Transient AV block following the gadolinium bolus was also not seen in any patient. 3 patients had failures of the IV line carrying the gadolinium bolus, and 6 had local infiltration of a portion of the infusate. No patient required treatment with aminophyline.
Conclusion: MRPI using adenosine can be safely performed in patients who meet selection criteria. It is easy to perform, usually well tolerated and more rapid than conventional radionuclide techniques.
237. Infarct Size Needed to Cause Adverse Left Ventricular Remodeling in Humans: An MRI Study
Glenn A. Hirsch, M.D.,1 W. Patricia Ingkanisorn, M.D.,2 Anthony H. Aletras, M.D.,2 Peter Kellman, Ph.D.,2 Andrew E. Arai, M.D.2
Cardiology/Laboratory of Cardiac Energetics, Johns Hopkins Hospital/NHLBI, Bethesda, MD, USA, Laboratory of Cardiac Energetics, NHLBI, Bethesda, MD, USA.
Introduction: Post-myocardial infarction (MI) left ventricular (LV) remodeling occurs in the setting of large myocardial infarctions. Current therapies such as emergent reperfusion, β-blockers and ACE-inhibitors have led to significant decreases in adverse remodeling. The accuracy of MRI in measuring LV volumes, geometry, and infarct size makes it a good technique for assessment of post-MI remodeling.
Purpose: Using MRI, we measured MI size in patients more than 2 months after the clinically recognized event to quantify the size of MI needed to result in adverse LV remodeling.
Methods: Contrast-enhanced MRI was performed on 53 patients at least 2 months after acute MI. LV volumes and sphericity (an indicator of LV geometry derived from the LV long axis/short axis ratio) were measured on cine MRI images (steady state free precession). Size and location of MI were determined using gadolinium-enhanced images with phase-sensitive reconstruction. Infarct size was summarized using the 16-segment model of the American Society of Echocardiography. Receiver operator curve for the number of infracted segments involved needed to cause remodeling was performed.
Results: Of the 53 patients, 24 had moderately to severely increased LV end-systolic volume consistent with LV remodeling. There was a moderate linear correlation between MI size (g) and LV end systolic volume index (r=0.71). By receiver operator curve analysis, the presence of ≥6 infarcted segments had a high specificity and moderate sensitivity, 0.92 and 0.45 respectively, for detecting remodeling. Comparing patients with ≥6 infarcted segments there were significant differences in end-systolic volumes (p<0.001), end-diastolic volumes (P<0.001), and end-diastolic sphericity indices (p<0.007) compared with those with <6 infarcted segments. The best balance between sensitivity and specificity to detect adverse remodeling by the number of infarcted segments was 3 segments (sensitivity, 0.72 and specificity, 0.67). Remodeling as described by multiple indices was related to infarct size but not to location.
Conclusions: The total amount of infarcted myocardium and the number of infarcted segments were able to stratify patients with chronic MI into groups with and without adverse remodeling. Larger infarct size and infarctions in multiple coronary distributions were more closely associated with adverse LV remodeling than infarct location (i.e. anteroapical vs inferior). Studies of post-MI LV remodeling should consider broader enrollment criteria than only patients with first, anterior MI.
238. Learning Non-viable Regions in Delayed Enhancement MR Images
Thomas P. O'Donnell, PhD,1 Ning Xu,2 Randolph Setser, PhD,3 Richard D. White, MD.4
Imaging and Visualization, Siemens Corporate Research, Princeton, NJ, USA, Beckman Institute, University Of Illinois, Urbana-Champaign, IL, USA, Radiology, Cleveland Clinic Foundation, Cleveland, OH, USA, Cleveland Clinic Foundation, Cleveland, OH, USA.
Introduction: Post-myocardial infarction, the identification and assessment of non-viable (necrotic) tissues is necessary for effective development of intervention strategies and treatment plans. Delayed Enhancement Magnetic Resonance (DEMR) imaging is a technique whereby non-viable cardiac tissues appear with increased signal intensity. Physicians acquire these images in conjunction with other functional modalities (e.g., MR Cine), and use domain knowledge and experience to isolate the non-viable tissues. In this paper, we present a technique for semi-automatically learning the classification of these tissues given the delineation of myocardial borders in the DEMR and in the End-systolic and End-diastolic MR Cine images. Briefly, we obtain a set of segmentations furnished by an expert and employ artificial intelligence techniques to learn the segmentations based on features culled from the images. Using those features we are then able to predict the segmentations the expert would provide.
Our Approach: We obtained both DEMR images and Cine MR (Flash or TrueFisp) images of 14 patients at three short axis slice positions. Using the Argus package from Siemens, an expert delineated the myocardial borders on all images. The myocardium was divided into 36 radial sectors and each sector further subdivided circumferentally resulting in a total of 72 sectors. Each sector was characterized as viable or non-viable by the expert.
Feature selection lies at the heart of machine learning. The myocardial thickness information from the ES phase of Cine MR images as well as the differential myocardial thickness from ED to ES was calculated for each sector. Features from the DEMR images included the average intensity value per sector, the degree of intensity homogeneity and extent to which high intensity regions were transmural. In addition, the sector position was included as a feature.
The artificial intelligence technique applied to learn the segmentations was support vector machines (SVM). SVMs find a decision surface in the space made up of the features. This surface divides the samples into two categories: viable and non-viable based on the features. We employed the ‘leave-one-out strategy’ and selected the parameters which yield best average accuracy rate.
Experiment Results: We obtained a total of 42 DEMR images slices with ground truth provided by the expert. Each experiment consisted of 42 sub-experiments where one slice acted as a ‘test’ and all other slices as training set. The average accuracy rate of all 42 test sets is used to determine the SVMs parameters. Based on the experiments, we set σ=0.1 and C=10 and achieved an average accuracy of 85%.
In Fig. we show an example of our classification results. The left image is the original DEMR image, where the contours of myocardium are drawn in blue. The center image shows the ground truth and the right image shows our prediction.
We have also included confidence in our predictions of the segmentations. Thus, the user may wish the output of the segmenation to be viable, non-viable and unknown. The distances from the both sides of the decision surface of the SVMs are thresholded to classify the data into the three categories using two thresholds. In selecting these two thresholds, we maximize the accuracy of our classification into the viable and non-viable regions, and minimize the uncertainty region. The two cost functions are tradeoffs. We can improve the accuracy by increasing the area of uncertainty and on the contrary, by decreasing the uncertainty area to zero, the accuracy rate will be decreased to 85%. The relationship between the two is shown in Fig. 2. We can see that with 15% uncertainly region we can get the accuracy rate at about 90%. Or, in other words, we are 85% confident that our segmentation will be 90% correct.
Conclusion: We presented a method employing machine learning based methods to segment non-viable tissues in the myocardium based on DEMR image and Cine MR images. Using our method, we are able to correctly predict the response of the experts on average 85% of the time.
Figure 1. (Abstract 238)
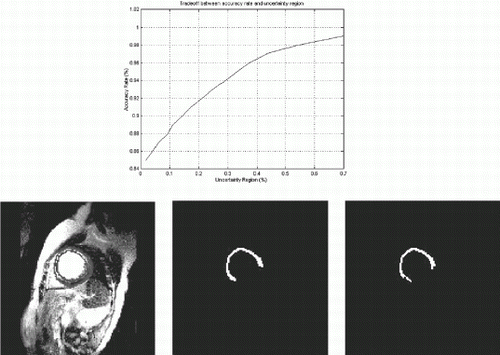
239. Magnetic Resonance Angiography Is Equivalent to Coronary Arteriography for the Evaluation of the Coronary Arteries in Kawasaki Syndrome
Sophie Mavrogeni,1 Giorgos Papadopoulos,2 Marouso Douskou,3 Savas Kaklis,2 John Seimenis,4 Panagiotis Baras,4 Polixeni Nikolaidou,2 Chryssa Bakoula,2 Evangelos Karanasios,2 Evangelos Spanos,3 Dennis V. Cokkinos.1
Onassis Cardiac Surgery Center, Athens, Greece, Aghia Sophia Children's Hospital, Athens, Greece, Bioiatriki MRI Unit, Athens, Greece, Philips Hellas Medical Systems, Athens, Greece.
Introduction: Coronary artery abnormalities in Kawasaki syndrome (KS) develop in about 15–25% of young patients, mostly in the form of aneurysms.
Purpose: The purpose of this study was to compare the results of magnetic resonance angiography (MRA) with conventional coronary angiography (CA) in a pediatric population.
Methods: Eight patients, aged 1–12 yrs., were studied. The maximal diameter and length of the aneurysm was recorded. Coronary MRA was performed using a 1.5 T Philips Intera CV MR scanner with two ECG-triggered pulse sequences. The first was a three-dimensional segmented k-space gradient-echo sequence (TE=2.1 ms, TR=7.5 ms, flip angle=30°, eff. slice thickness=1.5 mm) employing a T2-weighted preparation prepulse and a frequency selective fat-saturation prepulse. Data acquisition was performed in mid-diastole. All scans were carried out with the patient free breathing using a 2D real time navigator beam. All patients underwent CA within a week.
Results: In 5 patients aneurysms of the coronary arteries were identified while coronary ectasia alone was present in the remaining 3 patients. MRA and CA diagnosis of coronary artery aneurysm agreed completely. Maximal aneurysm diameter and length and ectasia diameter by MRA and CA were similar. No stenotic lesion was identified by either technique (Table ).
Conclusions: In conclusion, MRA is a reliable diagnostic tool, equavalent to CA for coronary artery aneurysm identification in patients with KS. MRA may prove of great value for the serial noninvasive evaluation of these patients.
Figure 1.
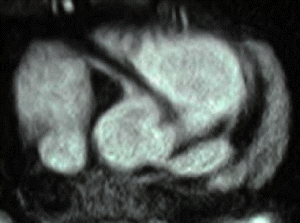
240. MRI Assessment of the Effects of a Nitinol® Mesh Wrap on Post-Infarction LV Geometry
Brandon M. Mikolich, M.D.,1 Linda Teekell-Taylor, M.D.,2 Sunil Mankad, M.D.,2 Mark Doyle, PhD,2 James Magovern, M.D.,2 Robert W. W. Biederman, M.D.2
Cardiology, MCP Hahnemann University Hospital, Philadelphia, PA, USA, Allegheny General Hospital, Pittsburgh, PA, USA.
Introduction: We have previously shown that a Nitinol® alloy mesh surgically implanted around the ventricle attenuates LV mass and limits post-MI dilation. The mechanism by which the mesh works to improve LV geometry may be detectable by relative wall thickness (RWT). However, the classical echocardiographic index of RWT depends on a crude, single measure of the LV wall thickness (posterior wall) with obligate inaccuracy.
Purpose: Given MRI's 3D nature, accuracy and reproducibility, we hypothesized that geometric changes, if present, would be better detected through an MRI derived calculataion of a 3D global myocardial relative wall thickness, ΣRWT.
Methods: MRI (GE-CV/i) was utilized to evaluate 13 sheep who underwent LAD occlusion with simultaneous surgical Nitinol® mesh implantation in 7 sheep. The MRI protocol was repeated at 6 weeks (follow-up). Axial LV images were analyzed circumferentially to generate 100 wall thickness points per slice 8–10 contiguous slices (avg: 875 segments/sheep) and used to derive one measurement that universally characterizes the LV wall thickness ΣRWT. Additionally, we calculated mass/volume ratios, end-systolic and end-diastolic circumferential stress according to the method of de Simone.
Results: Between groups there was no significant change in wall tension (systolic or diastolic), nor mass/volume index at any time point. Traditional RWT was not significantly different between the control and mesh group pre (0.27±0.08 vs 0.35±0.09, p=NS) or post (0.22±0.07 vs 0.30±0.07, p=NS), respectively. Likewise, with ΣRWT there was no difference between the control vs mesh group pre (0.358±0.042 vs 0.376±0.047, p=NS). However, ΣRWT was significantly improved in the Nitinol group (0.309±0.039 vs 0.282±0.024, p<0.01).
Conclusions: The Nitinol® alloy mesh may provide a buttress effect for the LV wall and constrain post-infarct remodeling. The manner in which it operates includes a favorable effect upon LV geometry as shown by ΣRWT. However, single point estimates of RWT masked the otherwise favorable amelioration of the remodeling process. The intrinsic 3D nature of MRI allows generation of accurate ΣRWT to identify benificial remodeling.
Figure 1.
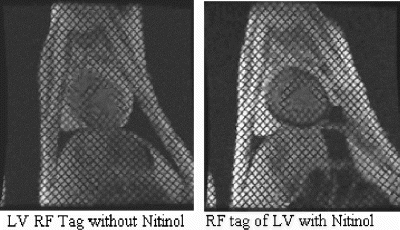
241. Myocardial T1 Mapping Reveals Information on the Severity of Myocardial Damage in Patients with Acute Myocardial Infarction
Daniel R. Messroghli, MD,1 Thoralf Niendorf, PhD,2 Jeanette Schulz-Menger, MD,1 Ralf Wassmuth, MD,1 Matthias G. Friedrich, MD, PhD.1
Cardiac MRI, Franz-Volhard-Klinik, Berlin, Germany, Cardiac MRI, GE Medical Systems, Milwaukee, WI, USA.
Introduction: It has been shown that myocardial T1 mapping is able to detect areas of acute myocardial infarction with and without the use of contrast media. The spatial extent of myocardial defects seen with T1 mapping after the application of contrast media matches that of areas of conventional delayed hyperenhancement, but the relative decrease of T1 in infarcted areas as compared to remote areas differs from patient to patient. We hypothesized that the amount of changes in T1 relaxation time is related to the severity of myocardial damage as assessed by the measurement of peak creatinin-kinase (CK).
Purpose: To examine whether the amount of changes in T1 relaxation time is related to the severity of myocardial damage as assessed by the measurement of peak creatinin-kinase (CK).
Methods: 10 patients (7 male) underwent post-contrast myocardial T1 mapping 2±1 days after acute myocardial infarction on a 1.5 T clinical MR scanner. Peak-CK (1340±997 U/l) was obtained from repeated measurements performed from admission to normalization of CK values. T1 values were measured in the area of infarction as assessed by conventional delayed hyperenhancement and in remote areas.
Results: In the area of infarction, the relative decrease in T1 after contrast media as compared to non-infarcted areas correlated well to peak-CK measured in these patients (p=0.0025, correlation Z test).
Conclusions: In patients with acute myocardial infarction, the extent of post-contrast changes in myocardial T1 correlates to the extent of necrosis as estimated by peak-CK levels. Therefore, not only the spatial extent but also the signal quality of post-contrast MRI contains information on the severity of myocardial damage. This information is not disclosed by conventional delayed enhancement imaging.
242. Relation Between Myocardial Edema and Microvascular Dysfunction in the Infarct Bed. MR Characterization in Patients with Acute Myocardial Infarction
Hassan Abdel-Aty, Nidal Al-Saadi, Andrew J. Taylor, Rainer Dietz, Matthias G. Friedrich
Cardiology, Franz-Volhard-Klinik, Charite, Campus Berlin-Buch, Humboldt University, Berlin, Germany.
Introduction: Acute myocardial infarction (AMI) can be detected and localized in T2-weighted magnetic resonance imaging by virtue of the infarct-associated myocardial edema. The spatial extent of myocardial edema however exceeds that of irreversible myocardial injury. Little is known about the pattern of myocardial injury underlying myocardial edema.
Purpose: We investigated the spatial relation between myocardial edema and microvascular dysfunction following AMI.
Methods: We studied 23 patients (18 males, mean age 53±12 y) 3±2 days after reperfused (TIMI 3) first AMI on a clinical 1.5T MR scanner using a breathhold STIR(short TI inversion recovery) sequence (TR 2R-R intervals, TE 60 ms, TI 140 ms, number of slices 3) and a first pass perfusion study in the short axis view (saturation recovery, gradient echo/echo planar-readout sequence. TR 113–134 ms, TE 1.3–1.7 ms; flip angle 25°, slice thickness 10 mm) in the same slice positions after an IV bolus injection (0.1 mmol/kgBW) of Gd-DTPA (Magnevist©, Schering AG, Germany).
The circumferential extent of first pass perfusion defects was correlated to that of high STIR signal.
Results: All reperfused infarcts showed evidence of myocardial edema and microvascular dysfunction. The circumferential extent of microvascular dysfunction and myocardial edema closely matched and was not siginificantly different (93±35° vs. 91±43°, p=ns) with good correlation (r=0.78, p<0.001, gradient of slope 1.04) (Fig. ).
Conclusion: The correlation between myocardial edema and microvascular dysfunction following reperfusion of AMI may indicate a causal role of myocardial edema or edema-related pathophysiology in the setting of microvascular obstruction and thus underscores the potential of MRI for the investigation of new therapeutic lines targeting microvascular dysfunction in this clinical setting.
Figure 1.
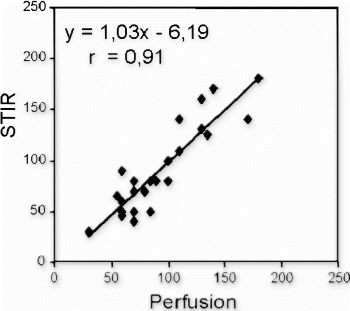
243. Magnetic Resonance First Pass Myocardial Perfusion: Influence of Spatial and Temporal Coverage on Qualitative Evaluation
Nidal Al-Saadi.
Cardiology, Franz-Volhard-Klinik, Charite, Campus Berlin-Buch, Humboldt University, Berlin, Germany.
Introduction: Quantitative and semiquantitative evaluation of myocardial first pass MR perfusion are feasible. However, automatization is still lacking and self contour detecting algorithms are not ready for clinical use yet. Qualitative analysis, although subjective, is an easy and sensitive tool that can be used for clinical evaluation and detection of coronary artery disease.
Purpose: We investigated the interstudy variability of qualitative evaluation and the influence of spatial and temporal coverage of the first pass perfusion on its diagnostic performance.
Methods: First pass MR perfusion studies, acquired on a 1.5T cardiovascular system (Signa CV/i GE Medical Systems) of 20 patients with coronary artery disease were analyzed. Images were acquired using a GRE-EPI hybrid sequence (4 slices each heart beat) at rest and after adenosine stress (140 mg/kg). Original images (1RR) were compared with the same series after deleting every second image (2RR). Slices were randomized before the blinded evaluation (=220 slices, 110 for each group). In each slice 6 segments were analyzed qualitatively (3 score system for regional perfusion: 1=definite, 2=possible, and 3=no hypoperfusion). In 18 additional patients with advanced coronary artery disease but without myocardial infarction, two rest studies were performed. The first with 4 slices every heart beat (4SL) and the second repeated after 60 minutes with 8 slices every other heart beat (8SL). To evaluate interstudy agreement perfusion studies of the same 10 patients (4 slices every heartbeat) were acquired twice. Comparison between groups (240 segments, 30 territories of coronary arteries) were performed using weighted kappa statistics.
Results: Qualitative analysis showed a very good interstudy agreement (agreement 99.2%, Kappa 0.99). Perfusion studies of 2RR showed a very good agreement with 1RR (agreement 96%, Kappa 0.94, n=960 segments). Score 2 (=possible hypoperfusion) was more often in the 2 RR group, wheras score 1 (=definte hypoperfusion) was more often in the 1RR group. None of the segments had a disagreement of more than one score point. Comparing 4Sl and 8SL there was a good agreement (agreement between slices 95%, Kappa 0.96, n=432 segments; agreement between coronary territories 96%, Kappa 0.97, n=54 coronary arteries). One coronary stenosis (diagonal branch) was detected by 4Sl but missed in 4 SL.
Conclusion: Qualitative perfusion assessment shows an excellent interstudy variability. It is more sensitive with a high spatial coverage (increasing slice number), however, with a higher temporal coverage (acquisition every heart beat) hypoperfusion was diagnosed with higher confidence.
244. Interstudy Reproducibility of Myocardial Perfusion Reserve Using a Novel Dual Acquisition Cardiovascular Magnetic Resonance Sequence
Andrew G. Elkington,1 Peter Gatehouse,2 Nick Ablitt,3 David Firmin,4 Guang Z. Yang,3 Dudley J. Pennell.2
CMR Unit, Royal Brompton Hospital, London, United Kingdom, CMR Unit, Royal Brompton Hospital, London, United Kingdom, Visual Imaging Processing Group, Department of Computing, Imperial College, London, United Kingdom, CMR Unit, Royal Brompton Hospital and Imperial College, London, United Kingdom.
Introduction: Quantitative perfusion CMR requires an accurate input function from the 1st pass of the gadolinium bolus. For clinical visualization of perfusion defects, a high dose (typically 0.1 mmol/kg) of gadolinium is used, but this causes the input function to be attenuated. Previous work has validated quantitative perfusion CMR using a ‘double bolus’ technique against microspheres. This uses a low 1st bolus for the input function (0.01 mmol/kg), and a high 2nd bolus for the myocardial response (0.1 mmol/kg).
Purpose: In this study we compared the reproducibility of myocardial perfusion reserve (MPR) calculated from this dual bolus technique with the standard clinical dose, and also a novel technique recently described by Gatehouse et al which uses the standard high dose bolus (0.1 mmol/kg) but derives the input function from a novel dual acquisition sequence with a fast low resolution–low sensitivity scan of the LV blood pool signal which is acquired on the R-wave for each cardiac cycle during the perfusion scan.
Methods: 25 perfusion CMR studies were performed on patients with significant coronary artery disease, and then repeated within one week to assess interstudy reproducibility of the MPR measurements for the 3 techniques. Quantitative perfusion analysis was performed on the subendocardium and subepicardium in two regions—myocardium subtended by a significant stenosis and a region of remote myocardium.
Results: The dual bolus technique yielded a mean MPR of 1.89, which compared with 3.1 for the high dose bolus (P<0.0001) and 1.90 for the novel dual acquisition technique (P=0.95). The coefficient of variability of the dual bolus study was 86% compared with 62% for the high bolus and 49% for the dual acquisition studies.
Conclusions: Quantification of MPR using a standard clinical visualization dose of 0.1 mmol/kg gadolinium leads to significant overestimation of MPR, but this can be corrected by using the novel dual acquisition sequence. The novel dual acquisition perfusion sequence has superior interstudy reproducibility to measure MPR compared with the dual bolus or high dose techniques.
245. How Reliable Is the ECG in Differenciating Transmural from Non-transmural Myocardial Infarction: A Comparison Between ECG and Contrast Magnetic Resonance Imaging
Burkhard Sievers, Binu John-Puthenveettil, Ulrich Franken, Bodo Brandts, Marc van Bracht, Hans-Joachim Trappe.
Cardiology and Angiology, University of Bochum, Herne, Germany.
Rapid technical advances in cardiovascular magnetic resonance (CMR) has lead to substantially better image quality. Contrast enhanced magnetic resonance (CE-MRI) allows exact localization and determination of the transmural extent of myocardial infarction (MI).
We therefore aimed to evaluate, whether the conventional 12-lead electrocardiograhy (ECG) is feasible to differentiate transmural from non-transmural MI and if the location of MI is predictable by ECG. We used CE-MRI as gold-standard.
Methods: 27 patients (23 men, 59.5±12.9 years) with MI in history (6.4±2.9 months) underwent CMR (Magnetom, Siemens, Erlangen, Germany). Images were acquired by TrueFISP. For image analysis the horizontal and vertical long axis and short axis views was used. CE-MRI was performed in the same views as for cine images 15 min after administration of Gadolinium-DTPA (0.15 mmol/kg). Contrast enhanced images were acquired with a segmented inversion.recovery gradient-echo pulse sequence (FLASH). In 11 patients (pts) the MI was defined transmural, in 16 pts non-transmural. All pts had ECG before CMR.
Results: In ECG T-wave alterations, descending ST-depression, pathologic Q-waves and absent R-waves were more frequent in non-transmural than in transmural MI, defined by CE-MRI. However, the difference was not significant (p≥0.505). R-wave reduction, q-waves and horizontal ST-depression were more frequent in transmural than in non.transmural MI. Again, the differences were not significant (p≥0.146). The sensitivity of the ECG for MI localisation was highest in inferior infarctions (85.71%), the specificity was highest in anterior infarctions (100%), the best positive predictive value (80%) was achieved in anterolateral infarctions and the best negative predictive value in lateral infarctions (95.83%). Overall, anterolateral MI were detected most accurate by ECG.
Conclusions: Transmural and non-transmural MI can not be differentiated by 12-lead-surface ECG. Pathologic Q-waves and absent R-waves are more frequent in non-transmural MI, but the difference is not significant. ECG is most accurate in detecting anterolateral MI. CMR is helpful for defining infarct location and transmural extent of MI.
246. Patterns of Signal Intensity Time Slopes Determined During Myocardial Perfusion Measurements Using Contrast Echocardiography with Power Doppler Harmonic Imaging and Cardiac-MR
Andreas Hagendorff, MD,1 Nidal Al-Saadi,2 Hassan Adel-Aty, MD,2 Rainer Dietz, MD,2 Matthias G. Friedrich, MD.2
Cardiology, University of Leipzig, Leipzig, Germany, Cardiology, Franz-Volhard-Klinik, Charite, Campus Berlin-Buch, Humboldt University, Berlin, Germany.
Introduction: Semiquantitative analysis of regional myocardial perfusion is accepted using cardiac magnetic resonance (MR) after intravenous bolus application of contrast agent.
Purpose: The aim of the present study was to establish an analogous application protocol using myocardial contrast echocardiography (MCE) with Power Doppler harmonic imaging (PDHI).
Methods: In 20 patients with stress-induced chest pain perfusion measurements were performed at rest and during vasodilator stress (adenosine: 140 μg/kg/min). With MR (Signa, CV/i, GE Medical Systems) a GRE-EPI hybrid sequence was used during the first pass of a Gadolinium-DTPA bolus (0,1 mmol/kg). With MCE (VividFive, GE Medical Systems) PDHI was used, triggered on every heartbeat. Perfusion cine loops were acquired in three long-axis views after injection of one Gadolinium bolus for the MR-investigation and after three repetitive Optison-bolus injections for MCE with PDHI. The kinetics of the contrast enhancement (CE using MR) or the Doppler intensity (DI using MCE) were evaluated using the MASSplus™ (MEDIS, Leiden, NL) or the EchoPac 6.2b.134 software.
Results: Regional hypoperfusion as well as normal perfusion was detected with both methods in correlation to the angiographic results. Differences of the CE- or DI-kinetics were observed, which can be explained by the different wash-in kinetics of the contrast agents (interstitial accumulation of Gadolinium, intravascular distribution of Optison). Furthermore, due to differences in the detection threshold, the wash in (as determined by the upslope) was the most sensitive parameter for the detection of myocardial ischemia using MR, whereas the wash out was more sensitive in DI curves obtained by MCE. Using MR the apex as well as the basal septum is difficult to evaluate due to artefacts created by the crossing of the planes as well as by the contrast agents in the right ventricular cavum. Using MCE with PDHI the complete basal regions of the heart as well as the lateral and posterior regions can be affected by tissue attenuation or shadowing.
Conclusions: Myocardial perfusion can be assessed by first pass MR perfusion or myocardial contrast echocardiography with PDHI. The signal intensity slopes, however, have different patterns due to the different behaviour of the contrast agents and the different detection threshold. Using long axis views both methods have limitations in certain myocardial regions.
Figure 1.
247. Predictions of Contractile Response to Carvedilol in Chronic Heart Failure
Shah J. Dipan,1 Vera H. Rigolin, MD,2 David Bello, MD,2 Silvia Diluzio, MD,2 Michelle Parker, MS,1 Robert O. Bonow, MD,2 Robert M. Judd, MD,1 Mihai Gheorghiade, MD,2 Raymond J. Kim, MD.1
Duke Cardiovascular MR Center, Duke University Medical Center, Durham, NC, USA, Cardiology, Northwestern University Medical School, Chicago, IL, USA.
Introduction: Beta-blocker therapy (BBT) is known to improve contractile function in heart failure (HF) pts, but the response is heterogeneous. Recent findings suggest that regions displaying contractile reserve (CR) manifest a greater likelihood of improvement with BBT. Whether the discriminatory value of CR in predicting regional improvement is influenced by the presence and/or transmural extent of infarction (TEI) is unknown.
Methods: We studied 28 male HF pts, age 64±13 years, ejection fraction 28±6%. Prior to initiation of BBT, pts underwent with low dose dobutamine echo (5 mcg/kg/min) to assess regional CR, and contrast enhanced (ce) MRI (0.15 mmol/kg gadolinium, 5–10 minutes post injection) to evaluate the TEI. Follow-up resting studies were obtained after 6 months of carvedilol (daily dose 42±16 mg). Studies were segmented using a 16 segment model.
Results: Overall, the likelihood of functional improvement with BBT was related to the presence or absence of CR (see left side of graph). In segments with 0% TEI, CR status improved the prediction of contractile improvement, whereas in segments with >50% TEI there was a low likelihood of improvement regardless of CR status (see right side of graph).
Conclusion: The discriminitory value of CR status on likelihood of functional improvement after BBT appears to be primarily in segments which are dysfunctional and without infarction.
Figure 1.
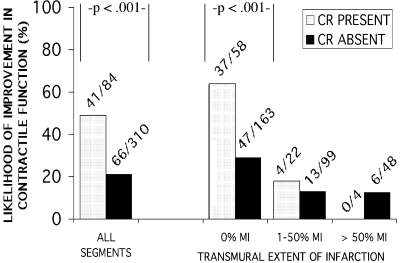
248. Reproducibility of Chronic Infarct Size Measurement by Contrast Enhanced MRI
Anja Wagner, MD,1 Heiko Mahrholdt,1 Thomas A. Holly, MD,2 Michael D. Elliott, MD,2 Robert O. Bonow, MD,2 Raymond J. Kim, MD,1 Robert M. Judd, MD.1
Duke Cardiovascular MR Center, Duke Medical Center, Durham, NC, USA, Northwestern Medical School, Chicago, IL, USA.
The reproducibility of contrast enhanced MR imaging in the setting of myocardial infarction (MI) has not been established. We compared MRI reproducibility for healed infarct size determination to that of 99mTc sestamibi SPECT.
Fifteen patients with chronic MI defined by enzymes (peak CK-MB 134±113) were scanned twice by MRI (MRI I and II) and twice by SPECT (SPECT I and II) on the same day (infarct age 3.2±1.9 years). For MRI, the patient was positioned and scanned by different operators to test variability positioning, scouting, and choice of imaging parameters such as inversion time. The MRI contrast (gadoteridol, 0.125 mmol/kg) was injected during MRI I but not MRI II to test the effect of imaging time post contrast. Resting Tc-MIBI SPECT images were acquired and infarct size was determined using commercial software. Average overall infarct size was 14±6 %LV by MRI (range 4–27 %LV) and 14±7 %LV by SPECT (range 4–26 %LV). MRI I and II were performed 10±2 and 27±3 min. post-contrast, respectively. For MRI, the difference in infarct size between scans I and II (bias) was +0.3 %LV mass and the coefficient of repeatability was ±2.6 %LV. For SPECT, the bias was −1.3 %LV and the coefficient of repeatability was ±4.0 %LV. Within individual patients, no systematic differences in infarct size were detected when comparing the two MRI scans, the two SPECT scans, or comparing MRI to SPECT. Infarct size measured by ceMRI in healed MI's does not change between 10 and 30 min post-contrast. The clinical reproducibility of ceMRI for infarct size determination compares favorably with that of routine SPECT imaging.
Figure 1.
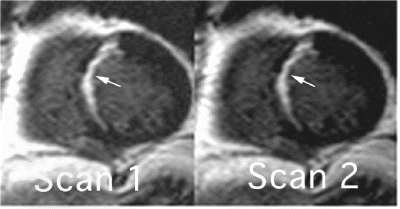
249. Ventricular Function Assessment in Patients Before and After Coronary Artery Bypass Surgery: Does Ventricular Function Improve After Revascularization?
Burkhard Sievers, Ulrich Franken, Marvin Addo, Asli Bakan, Simon Kirchberg, Hans-Joachim Trappe
Cardiology and Angiology, University of Bochum, Herne, Germany.
Cardiovascular magnetic resonance (CMR) allows accurate and reproducible evaluation of left and right ventricular function and determination of left and right ventricular volumes and ejection fraction.We evaluated, whether patients who underwent coronary artery bypass operation (CAB) improve global left and right ventricular function using a fast gradient-echo sequence with steady state free precession (TrueFISP).
Methods: 10 patients (6 men and 4 women, mean age 66.8±9 years, range 49–75 years) with angiographically proven multi-vessel coronary artery disease were investigated before and 8.8±1.2 months after CAB using a CMR imager (Magnetom, Siemens, Erlangen, Germany). Images were acquired by trueFISP using the standard short-axis method, the heart being imaged from the base (atrioventricular ring) to the apex at in sections of 10 mm thickness (8–11 sections). The endocardium and epicardium were delineated and the end-diastolic volumes (EDV), end-systolic volumes (ESV), stroke volumes (SV), and ejection fractions (EF) for the right and left ventricles were determined with commercially available software (Argus, Siemens).
Results: Gender and history of myocardial infarction did not have significant influence of volumes and EF (p≥0.3042). Left (pre: 67.7±15.3%, post: 71.8±13.2%; p=0.113) and right (pre: 61.9±11.3%, post: 70.1±7.4%; p=0.055) ventricular EF did improve even more after CAB in patients with preoperatively lower values (LVEF<80%→5.5% increase, LVEF>80%→1% increase; RVEF<60%→15% increase, RVEF>60%→3.5% increase).
Only right ventricular EDV and ESV were significantly higher after CAB [increase post CAB: RV-EDV 14 ml (2–50 ml), RV-ESV 5 ml (1–20 ml), p≤0.021], left ventricular volumes remained unchanged. SV increased postoperatively in both ventricles [left: 10.8 ml (1–30 ml, p=0.640, right: 11.4 ml (3–23 ml, p=0.114)]. SV decreased in only one patient for 3 ml.
Conclusions: Right and left ventricular function improve in patients with multi-vessel disease after coronary artery bypass surgery regardless of transmural extent and location of myocardial infarction. CMR is feasible for right and left ventricular volume assessment and follow up studies after coronary artery bypass surgery. Further studies are required to evaluate right ventricular function in patients with preoperative impaired left and right ventricular function.
250. The Diagnostic Value of Delayed Enhancement Sequence in Coronary Artery Disease Compared with Cathterized Coronary Angiography
Chen Suihui, MD,1 An Ningyu, MD,2 Gao Yuangui, MD,2 Cai Youquan, MD.2
Radiology, PLA General Hospital, Beijing, China, Radiology, PLA Genaral Hospital, Beijing, China.
Introduction: Delayed enhancement sequence is important modality to detect the myocardial viability after infarction.And also this sequence may show if myocardial infarction exist in patients clinically suspected as angina. Severe stenotic coroanry artery disease (CAD) with collateral flow establishment may demonstrate no abnormalities on cardiac perfusion MR, but may still show delayed enhancement.
Purpose: To investigate the diagnostic value of the delayed enhancement sequence in single- and multi-vessel patient groups of coronary artery disease (CAD).
Methods: 35 cases of clinically suspected CAD were examined by using a 1.5 T scanner (Twin Speed, GEMS) using zoom mode gradient. Only 7 of these patients (30 men and 5 women, aged 46∼74 year-old, mean 62) had acute or chronic infarction history, and the rest of them being diagnosed as angina by ECG and CK enzymatic analysis. A dedicated cardiac phased array coil was used for 2D delayed enhancement scan with LV coverage in short axis planes with thickness of 8∼10 mm, TR/TE/FA/TI=3.4/1.4/200/200 ms, Matrix 256×192, FOV 36×27 cm. Contrast agent (Magnevist, Schering Company) was administered intravenously by power injector at the rate of 2.0 ml/s in dosage of 0.1 mmol/kg 5 minutes before the start of delayed enhancement sequence. Two experienced cadiac radiologist performed blind evaluation of all images and reached consensus in subsequence conference.
Results: Catheterized angiogram confirmed stenotic changes in 54 (stenotic degree 50%∼100%) coronary arteries of the 35 patients, which had one-vessel disease in 18 cases with 18 vessel involvements (13 cases with stenotic degree>80%), 8 cases of two-vessel disease, and 9 cases with three-vessel disease, totally the latter two groups comprising 17 cases (11 cases with stenotic changes>80%) with 36 vessesl involvements and consisting of multi-vessel disease group. For Multi-vessel disease group, 25 (69.4%) stenostic vessels of the 36 vessels showed delayed enhancement within the relevant subendocardial regions on delayed enhancement sequence, the stenotic degree was more than 80% in 22 vessels and 50%∼70% in remaining 3 vessels. For the single-vessel disease group, only two coronary arteries (11.1%, 2/18) had high signal intensities within the relevant subendocardial regions on delayed enhancement sequence. The positive rate of delayed enhancement is significant higher in the multi-vessel disease group than that of single-vessel group (69.4% vs. 11.1%, Fisher's exact P=0.001). The catheterized angiography showed the 15 stenotic vessels (11 of them occluded, 3 of them stenotic degree>90%, 1 of them stenotic degree 70%) with collateral flows, while 39 (4 of them occluded, 16 of them stenotic degree 80%∼90%, 17 stenotic degree>90%, 2 stenotic degree 50%∼70%) stenotic ones without any collateral flow. 14 (93.3%) of 15 stenotic vessels with established collateral flows had high signal intensity within relevant subendocardial regions, while only 11 (28.2%) of 39 vessels lack of collateral flows had high signal intensity on delay enhancement sequences, thus there was significant difference between these two groups (93.3% vs. 28.2%, Fisher's exact P=0.001).
Conclusions: The coronary arteries in multi-vessel disease group is more likely to show abnormalities on delay enhancement sequence than the those in single-vessel disease group. Delayed enhancement sequence is also effective modality of revealing infarction due to severe stenotic or occluded coronary artery with well-established collateral flow. For some patients clinically diagnosed as angina, infarction really exist on delayed enhancement sequence of CMR.
251. Systolic vs. Diastolic Imaging for Delayed Hyperenhancement of Myocardial Infarction
Ralf Wassmuth, MD, Daniel Messroghli, MD, Rainer Dietz, MD, Matthias G. Friedrich, MD.
Franz-Volhard-Clinic, Humboldt University Berlin, Berlin, Germany.
Introduction: The extent of delayed hyperenhancement across the myocardial wall in subendomyocardial infarction has been related to the likelihood of functional recovery. For quantification of wall thickness, timing within the cardiac cycle is important. Systolic imaging might be impaired by motion but can be less time consuming depending on pulse sequence design.
Purpose: To compare transmural extent of delayed hyperenhancement in systolic and diastolic imaging of myocardial infarction.
Methods: 10 patients with myocardial infarction were scanned on a 1.5 T clinical scanner using an inversion recovery gradient echo sequence. 1 representative slice was chosen and imaged over 2 RR-intervals with an acquisition window of 128 ms. Time delay was 10 ms for systolic imaging and 95% of the RR interval for diastolic imaging respectively. Spatial resolution was 1,7 mm/pixel. The inversion time was individually chosen to null remote myocardium. We measured the maximal thickness of infarct scar and viable myocardium perpendicular to the wall. Values were compared within individual patients using a paired student t-test.
Results: Both systolic and diastolic images were not impaired by cardiac motion. In remote areas, wall thickness increased from 10±2 mm in diastole to 13±3 mm in systole (p<0,03). The areas of delayed hyperenhancement covered 49% (30–80%) of the wall diameter in diastole and 56% (33–86%) in systole (p<0.25).
Conclusion: Given the spatial resolution achieved in routine imaging of myocardial infarction, the extent of transmurality of delayed hyperenhancement does not significantly differ between systolic and diastolic images. Systolic imaging allows better delineation of viable myocardium without changing the transmural extent of hyperenhanced scar.
252. Myocardial Perfusion Imaging Using Omniscan: A Dose Finding Study for Visual Assessment of Stress-Induced Regional Perfusion Abnormalities
Eike Nagel, MD,1 Ingo Paetsch, MD,2 Daniela Föll, MD,3 Christoph Klein, MD,2 Simon Schalla, MD,2 Eckart Fleck, MD,2 Eckart Fleck, MD.2
Cardiology—CMR, German Heart Institute Berlin, Berlin, Germany, German Heart Institute Berlin, Berlin, Germany, Internal Medicine IIII—Cardiology/Angiology, Albert Ludwigs-University, Freiburg, Germany.
Introduction: Different doses of contrast agent are applied for magnetic resonance perfusion studies and mainly semiquantitative approaches have been reported for analysis.
Purpose: We aimed to determine the optimal dose for a visual detection of perfusion defects.
Methods: 49 patients scheduled for invasive angiography were examined at stress (0.14 mg adenosine/kg body weight/minute) and rest using a TFE-EPI hybrid sequence (Philips ACS NT; 1.5 T). Patients were assigned to three different dose groups of gadodiamide (0.05, 0.1 and 0.15 mmol/kg body weight) injected as a bolus via a peripheral vein. Visual assessment was used to detect a regional reduction of peak signal intensity or speed of contrast agent inflow at stress in comparison to rest. See Figure 1.
Results: Prevalence for coronary artery disease was 67%. The highest diagnostic accuracy was reached for a dose of 0.1 mmol gadodiamide/kg body weight yielding a sensitivity of 89% with a specificity of 80%. At this dose no major artifacts related to the contrast agent were found.
Conclusions: Visual assessment of myocardial perfusion using a high-flow rate contrast agent bolus injection and a TFE-EPI sequence can be best achieved with a dose of gadodiamide 0.1 mmol/kg bodyweight.
Figure 1. First pass perfusion images at rest (left) and adenosine stress (right). White arrow: stent artifact; black arrow: myocardial infarction; open white arrow: ischemia.
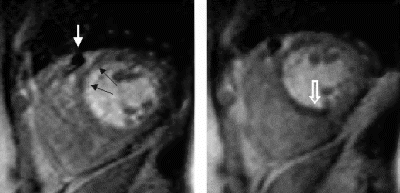
253. Papillary Muscle Fibrosis in Specific Cardiomyopathy
James C. C. Moon, Anna S. John, Alicia M. Maceira, Laura Dragonetti, Dudley J. Pennell, Raad H. Mohiaddin.
Royal Brompton Hospital, London, United Kingdom.
Introduction: The papillary muscles are vulnerable to ischemia because they are perfused by the terminal portion of the vascular bed. Fibrosis can lead to mitral regurgitation. Both ischemic and non-ischemic cardiomyopathy can cause papillary muscle fibrosis.
Purpose: To demonstrate the detection of papillary muscle fibrosis in different forms of non-ischemic cardiomyopathy.
Methods: As part of routine clinical assessment of cardiomyopathy, gadolinium-DTPA late enhancement CMR is performed using IR-FISP or IR-FLASH. We present 8 selected representative cases where there was hyperenhancement of the papillary muscles in non-ischemic cardiomyopathy.
Results: The 8 patients had the following conditions: Fulminant myocarditis, Sarcoid, amyloid, post ALCAPA (Anomalous Left Coronary Artery from the Pulmonary Artery) repair, Hypertrophic Cardiomyopathy (HCM), Systemic Sclerosis, Chagas cardiomyopathy and Loefflers endocarditis. Hyperenhancement was associated with mitral regurgitation in 4 patients (HCM, sarcoid, Chagas and Loefflers) and TR from right sided involvement in 1 (systemic sclerosis). The extent of involvement did not correlate with presence of regurgitation. Hyperenhancement could be limited to the papillary muscles (sarcoid, post ALCAPA repair), found as part of endomyocardial fibrosis (systemic sclerosis, Loefflers, amyloid) or with hyperenhancement elsewhere in the myocardium (Chagas, HCM, myocarditis). In all patients, hyperenhancement involved both papillary muscles. See Figure 1.
Conclusion: Papillary muscle fibrosis can be detected in vivo in a variety of myopathic processes. Hyperenhancement of the papillary muscles may serve as a sensitive marker of previous myocardial insult. The detection of papillary muscle fibrosis may help with the surgical assessment of the mitral valve.
Figure 1. (a) Sarcoid, (b) Myocarditis, (c) Hypertrophic cardiomyopathy, (d) Systemic sclerosis.
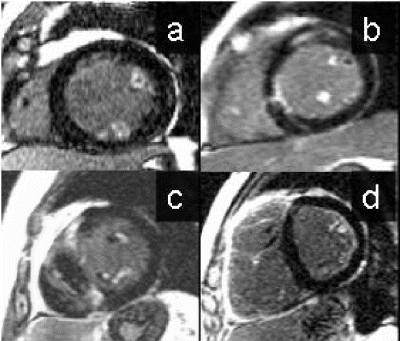
254. Determination of Left Ventricular Ejection Fraction by Cardiovascular Magnetic Resonance Imaging: Comparison Between Simpson's Rule and Area-Length Methods
Clerio F. Azevedo,1 João L. Petriz,1 Marcelo Hadlich,1 Luis A. Mendonça,1 Jorge Moll,1 Carlos E. Rochitte.2
Cardiac MRI, Rede D'Or & Labs, Rio de Janeiro, Brazil, Cardiac MRI, Heart Institute (Incor) University of São Paulo Medical School, São Paulo, Brazil.
Introduction: Measurements of left ventricular ejection fraction (LVEF) by Simpson's Rule using magnetic resonance imaging (MRI) is considered an accurate noninvasive method for the assessment of cardiac function. However, it remains a tedious and time-consuming task. A more practical and faster method to quantify LVEF by MRI is the area–length formula, which has been used widely in echocardiography. However, this method is based on geometric assumption that the volume of the LV constitute an ellipsoid, which may not be true in some subgroups of patients, such as those with previous acute myocardial infarction (AMI).
Purpose: We examined whether the area–length method for the assessment of LVEF is valid when compared to the gold standard Simpson's Rule in the population of patients referred to MRI, specially the subgroup with previous AMI. We also determined which is the best long-axis view, or combination of views, to use in the calculation of LVEF by the area–length method.
Methods: One hundred and twelve patients, sixty-three with previous AMI, underwent MRI on a 1.5T whole-body magnet (Intera NT, Philips) between oct/2001 and aug/2002. Cine images were acquired using a B-FFE pulse sequence (steady state acquisition gradient-echo). The imaging protocol included 8 to 10 short-axis views encompassing the entire LV and 4 long-axis views: the four-chamber (4CH) view, the left ventricular outflow tract (LVOT) view and two vertical long-axis (VLA) views, one perpendicular to the 4CH view and the other perpendicular to the LVOT view. The end-diastolic (ED) and end-systolic (ES) volumes were then calculated in two different ways: 1-Simpson's Rule: Manual drawing of the endocardial border in all short-axis slices in the ED and ES phases. The ventricular volumes were calculated as the sum of the endocardial areas multiplied by the distance between the centers of each slice. 2-Area–length method: The area (A) of the LV endocardial border was traced in all four long-axis views, as well as the length (L) from the apex to the mitral annulus. The volumes for systole and diastole were then calculated in four different ways: 4CH view alone (volume=0.85A2/L), LVOT view alone (volume=0.85A2/L), 4CH and perpendicular VLA view (0.85*A1*A2/smaller length), and LVOT and perpendicular VLA view (0.85*A1*A2/smaller length). The LVEF was then calculated as 100*(ED volume-ES volume)/ED volume.
Results: The paired t test revealed that the mean differences between Simpson's Rule and area–length methods were not significant. Moreover, Pearson's correlation coefficients for both methods were good, even when we considered only the subgroup of patients with previous AMI. The results are summarized in Table .
Conclusions: The area–length method to determine LVEF had good accuracy when compared to the Simpson's Rule, even in the subgroup of patients with previous AMI. Moreover, our results sugest that the best aproach to calculate LVEF by the area–length method is the use of the 4CH view and perpendicular VLA view combination. Therefore, the noninvasive assessment of LVEF by the area–length method can be used in routine cardiac MRI exams, adding objective data to the report and significantly reducing post-processing time.
Table 1. Simpson's rule vs. area-length method
255. Quantitation of Infero-posterior Myocardial Infarction Size by Cardiac Magnetic Resonance Imaging Using Delayed Enhancement and 15-Lead Electrocardiogram Using the Selvester Score
Maleah Grover-McKay, M.D.,1 Carey L. O'Bryan, IV, M.D.,2 Ed Gill,1 Ron Selvester, M.D.1
Long Beach Memorial Medical Center, Long Beach, CA, USA, Wilford Hall Medical Center, San Antonio, TX, USA.
Introduction: The size of myocardial infarction (MI) affects therapy, post MI left ventricular (LV) function, and prognosis. 12-Lead electrocardiogram (ECG) can estimate anterior MI but inferior or posterior MI may be better detected by 15-lead ECG using the Selvester score. Cardiac magnetic resonance imaging (cMRI) with delayed enhancement (DE) imaging accurately quantifies MI size.
Purpose: The purpose of this study is to compare infero-posterior MI size using cMRI and 15-lead ECG.
Methods: We studied 8 patients (pts) with enzyme and angiographic evidence of posterior and/or inferior MI. We calculated the percent of the left ventriclar mass that was infarcted (% LV MI) with cMRI (GE CVi and Siemens Sonata) using DE and with 15-lead ECG using the Selvester score, both obtained on the same day.
Results: Using cMRI, infero-posterior MI ranged from 0–23 grams and %LV MI from 0–18%. cMRI and 15-lead ECG values for %LV MI were within 6% in all 8 pts. In the only pt with an MI in another territory, a prior anterior MI, cMRI detected the small inferior MI (2.7%) but 15-lead ECG did not.
Conclusions: Values for posterior and/or inferior infarct size are comparable for cMRI and 15-lead ECG. cMRI data can be used to further refine 15-lead ECG methods to quantitate MI size.
256. Mitral Annular Displacement by Cardiac Magnetic Resonance Imaging in Patients with Left Ventricular Systolic Dysfunction
Franz C. Aepfelbacher, MD,1 Warren J. Manning, MD,1 Matthias Stuber, PhD,2 Rene M. Botnar, PhD,2 Susan B. Yeon, MD, JD.1
Cardiovascular Division, Beth Israel Deaconess Medical Center, Boston, MA, USA, Beth Israel Deaconess Medical Center and Philips Medical Systems, Best, Netherlands.
Introduction: M-mode echocardiographic assessment of mitral annular displacement (MAD) correlates with overall left ventricular systolic function, but the impact of focal versus global LV dysfunction and the relationship of MAD with LV volumes and ejection fraction (LVEF) using analogous cardiac magnetic resonance (CMR) data have not been examined.
Purpose: We assessed the hypothesis that CMR MAD correlates with LVEF and LV volumes, irrespective of whether focal or global LV dysfunction is present.
Methods: We determined CMR MAD (average of septal, lateral, anterior, and inferior MAD), LVEF and LV volumes in 5 normal subjects (Group I, EF 64±4%), 5 patients with focal LV dysfunction due to prior MI (Group II, EF 38±9%), and 5 patients with non-ischemic global dysfunction (Group III, EF 38±10%). MAD was measured for each frame of the corresponding 2- or 4-chamber cine MR image (relative to the first end-diastolic frame). The time interval was expressed as percent of systole.
Results: Maximal MAD in group I was 17.5±2.2 mm [ranging from 14.8±3.0 mm (septum) to 19.1±1.7 mm (inferior wall)], and was significantly higher than in group II (10.9±3.5 mm, p<0.001) and group III (10.3±1.5 mm, p<0.0001). All of the patients in Group I had maximal MAD >14 mm, while 90% of patients in group II and III had maximal MAD <12 mm. There were no significant differences between group II and group III in any of the regional or the average MAD. Overall, maximal MAD correlated well with LVEF (r=0.81, p<0.001). There was also a good correlation of maximal MAD with LV end-diastolic (r=−0.72, p<0.01) and LV end-systolic (r=−0.78, p<0.001) volume indexes. See Figure 1.
Conclusions: Average and regional maximal MAD by CMR correlate highly with CMR-derived LVEF and LV volumes. Focal and global LV dysfunction demonstrate similarly depressed MAD.
Figure 1. (Abstract 256)
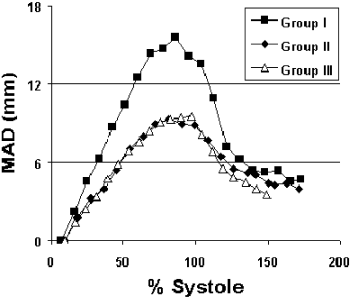
257. Dobutamine CMR Reveals Functional Improvement After Revascularization in Patients with Impaired Left Ventricular Function
Anna S. John, MD,1 John R. Pepper, MD,2 Dudley J. Pennell, MD.1
CMR Unit, Royal Brompton Hospital, London, United Kingdom, Cardiothoracic Surgery, Royal Brompton Hospital, London, United Kingdom.
Introduction: Coronary revascularization is thought to improve left ventricular (LV) function which is associated with prognostic benefits. The functional recovery of hibernating myocardium is believed to be responsible for this improvement; however, revascularisation may have additional beneficial effects on the contractile reserve.
Purpose: Our aim was to test this hypothesis.
Methods: 10 prospective patients with multivessel coronary artery disease awaiting coronary artery bypass grafting (CABG) were included in the study. All underwent rest and dobutamine stress cardiovascular magnetic resonance (CMR) pre and 6 months post-OP. CMR protocols consisted of short axis as well as long axis cines at rest and during low dose dobutamine stress (10mcg/kg/min). Scans were performed on a Siemens Sonata 1.5T scanner using standard TrueFISP cines (TE 1.6 ms, TR 3.2 ms) and active ECG gating. Betablockers were omitted for 2 days prior to CMR. Patients with less than two vessel disease, normal LV function and CMR contraindications were excluded.
Results: There were no significant changes in mean resting ejection fraction (EF) pre and 6 months post-OP (EF rest pre-OP 47.6±17.3%, post-OP 43.4±16.3%, p=ns). Enddiastolic and endsystolic volumes (EDV and ESV) pre and post CABG also remained unchanged (EDV pre-OP 197±64.2 ml, post-OP 183±14.2 ml, p=ns; ESV pre-OP 118±63.1 ml, post-OP 110±21.7 ml, p=ns). However, mean stress EF showed significant improvement from 42.1±13.1% pre-OP to 50.8±15.6% post-OP, p=0.01. There were no complications associated with CMR or low dose dobutamine stress.
Conclusions: Low dose dobutamine CMR can detect improvement in contractile reserve post revascularization when there is no change in resting LV EF.
258. Dobutamine MRI Distinguishes Viable Myocardium in Non-transmural Hyperenhanced Segments
Christina M. Bove, MD, Joseph M. DiMaria, Ketan N. Naran, Kimiknu Mentore, John M. Christopher, RT, Jennifer M. Hunter, RN, Christopher M. Kramer, MD.
Departments of Medicine and Radiology, University of Virginia Health System, Charlottesville, VA, USA.
Introduction: Identification of viable myocardium distinguishes hibernating myocardium from irreversibly injured myocardium, and predicts increased left ventricular ejection fraction (EF) and improved survival after revascularization.1 Contrast enhanced MRI (CEMR) has been shown to accurately identify reversible myocardial dysfunction in patients with chronic ischemic heart disease.2 While this method provides accurate prediction of recovery for segments with either no hypohoenhancement (HE), or almost transmural HE (>50% of myocardium), segments with intermediate HE (1–25% and 26–50%) have variable recovery.
Purpose: We hypothesized that low dose dobutamine MRI (DMR) would provide additional discrimination between viable and nonviable myocardium in segments with intermediate HE in chronically dysfunctional myocardium.
Methods: Imaging Eight patients (6 male, mean age±SD 71±7) with coronary artery disease and regional LV dysfunction were studied prior to coronary artery bypass grafting. Patients with recent MI (within 2 months), unstable angina, NYHA class IV congestive heart failure, or other contraindications to MRI were excluded. Patients were studied on a Siemens 1.5T magnet using a phased-array surface coil. Breath-hold True-Fisp or gradient echo cine imaging was performed in 7 mm short axis slices from apex to base. Twenty minutes following injection of 0.1 mmol/kg Gd-DTPA injection, a breath-hold segmented inversion recovery TurboFLASH sequence was performed in the same slice locations (TR variable, TE 3.4 ms, inversion time 200–300 ms adjusted for optimal myocardial nulling, delay time 300 ms, FOV 263×350, matrix 148×256). Following CEMR imaging, dobutamine was administered intravenously at 10 μg/kg/min with continuous ECG and blood pressure monitoring. True Fisp or gradient echo cine imaging was repeated in the same slice locations starting 5 min after initiation of dobutamine infusion. Total imaging time ranged from 35 to 55 minutes.
Data Analysis: End-diastolic and end-systolic volumes (EDV, ESV) and EF were measured from cine images using Argus (Siemens, Princeton, NJ) in both baseline (bsl) and post dobutamine (post-Db) image sets. A six sector model was applied to basal and mid-ventricular slices and a 4 sector model for apical slices. Mean end-diastolic wall thickness (EDT), absolute systolic wall thickening (SWT), and % wall thickening (%WT) were calculated at bsl and post-Db within each sector. The same sector model was applied to corresponding HE images. The extent of transmural HE (%HE) in each segment was determined by planimetering HE area and sector areas and calculated as: HE area/sector area×100%. Non transmural HE segments were grouped into 1–25% and 26–50% for analysis. Segments were defined as dysfunctional on bsl cine MRI if %WT was <27% (<2 SD below normal, 65±19 for our lab). Segments were defined as viable on DMR if they showed dobutamine-induced SWT >1 mm in a dysfunctional segment at baseline.3 Data were presented as mean±SD and analyzed using student's paired t-test pre and post Db.
Results: Fifty one segments were dysfunctional and demonstrated nontransmural (1–50%) HE (see Fig. ) and another 6 segments demonstrated 51–100% HE.
The results for EDT, SWT, %WT in the 51 dysfunctional segments with 1–50% HE are presented in Table .
Dobutamine increased wall thickening significantly in these dysfunctional segments. In the 6 dysfunctional segments with 51–100% HE, EDT was 8.2±2.9 mm and neither SWT or %WT increased significantly with dobutamine. Of 18 segments with 1–25% HE, 11 or 55% were viable by Db-induced SWT. Of 33 segments with 26–50% transmural HE, 18 or 61% were viable by Db MRI. Therefore, 57% (29 of 51) nontransmural HE segments were viable by dobutamine MRI. End diastolic volume 136±55 (bsl) and 134±48 ml (Db) (p=0.79), and end systolic volume 79±38 (bsl) and 67±33 ml (Db) (p<0.12), did not change significantly with dobutamine. However, EF increased from 44±9% to 51±10% (p<0.02) with dobutamine as did SV (57±18 ml to 65±18 ml, p=0.05). LV mass was 214±63 g.
Conclusions: In patients with chronic LV dysfunction and coronary artery disease prior to revascularization, dobutamine response identifies over half of segments with nontransmural hyperenhancement as viable. Dobutamine MRI adds to delayed contrast enhanced MRI for detecting viable myocardium in dysfunctional segments with nontransmural hyperenhancement.
Figure 1. (Left) Delayed hyperenhanced apical short axis image with a 26–50% nontransmural HE region in the septum. (Center) The baseline True Fisp end-systolic image at the same location demonstrating septal hypokinesis. (Right) During dobutamine, improved septal thickening is seen on this end-systolic image, consistent with viability. Note the artifact on all 3 images from the prior LAD stent.
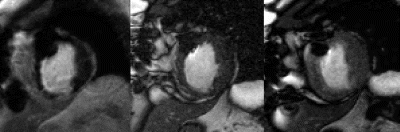
Table 1. Dobutamine response
References
1) Beller GA. Circulation 2000:343.
2) Kim RJ. N Engl J Med 2000; 343:1445–53.
3) Baer FM. Circulation 1995;91:1006–1015.
259. When a Poor Ejection Fraction Gets Better Following Revascularization: Is This Reflected by Improved Myocardial Perfusion?
Penelope R. Sensky,1 Graham R. Cherryman, FRCR,2 Nilesh J. Samani, FRCP.1
Cardiology, Glenfield Hospital, Leicester, United Kingdom, Radiology, Leicester Royal Infirmary, Leicester, United Kingdom.
Introduction: In patients with chronic ischemic cardiomyopathy, improvement of contractile function following revascularization should be a consequence of improved perfusion in dysfunctional territories.
Purpose: To compare perfusion changes following revascularization in pre-operative dysfunctional myocardial regions in patients with and without overall post-operative improvement in ejection fraction.
Methods: Twenty-one patients with significant ischemic LV dysfunction, ejection fraction (EF) 37.6±10.3%, accepted for revascularization underwent adenosine perfusion MRI Sensky et al, 2002) and short axis functional cine imaging immediately before and six months after revascularization. Pre- and post-operative ejection fraction was calculated. As a quantitative measure of myocardial perfusion (Larsson et al 1996), the unidirectional transport coefficient for gadodiamide over the capillary membrane, Ki, was calculated for dysfunctional ROI. Patients were divided into those in whom ejection fraction improved by ≥5% (group I) and those in whom it remained unchanged or had deteriorated (group II). Parameters of myocardial perfusion in dysfunctional ROI were compared between these two groups (Table ).
260. Preliminary Experience with Combined MR Perfusion and MR Coronary Angiography in the Detection of Coronary Artery Stenoses
Scott R. McGlynn, MD,1 Anthon R. Fuisz, MD,1 Srirama V. Swaminathan, Ph.D.2
Section of Cardiology, Washington Hospital Center, Washington, DC, USA, Clinical Science, Philips Medical Systems, N.A., Bothell, WA, USA.
Introduction: Magnetic resonance (MR) perfusion imaging and magnetic resonance coronary angiography (MRCA) both have the ability to detect coronary artery disease.
Purpose: We hypothesized that using a protocol that combined these techniques could accurately detect significant coronary artery stenoses.
Methods: Seven patients scheduled to undergo diagnostic catheterization at our institution were studied with MR perfusion imaging followed by directed MR coronary angiography. Patients were screened for contraindications to MRI and adenosine. After scouts were performed using a single phase BFFE technique, patients were given an infusion of adenosine (140 mcg/kg/min) followed by an injection of gadolinium (0.05 mmol/kg at 5cc/sec via power injector) and images were obtained in the short axis view with a temporal resolution of 3 slices per heartbeat using a TFEPI sequence with a 122×128 matrix. The images were interpreted immediately and then MR coronary angiography using a 3D navigator TFE technique was directed to those vessels that corresponded to a perfusion defect. If no perfusion defects were seen, proximal LAD, LCx, and RCA were imaged. Coronary territories with a matching perfusion defect and coronary stenosis were deemed significantly stenosed. These results were compared with the subsequent cardiac catheterization to assess whether this technique accurately predicted the stenosed vessel and the location of the stenosis.
Results: In all patients who completed the protocol, the location of a significant coronary artery stenosis was accurately detected. Two patients had poor quality coronary images and could not be studied further (though the perfusion sequence correctly classified the location of the stenosis) and one patient was unable to tolerate the procedure (noise of magnet).
Conclusions: Combining MR perfusion imaging with directed coronary angiography is a promising non-invasive method of detecting significant coronary artery disease.