339. High Resolution Imaging of Microspheres Used in Myocardial Flow Determinations, In Vitro and In Vivo
Ulrich K. M. Decking,1 Han Wen,2 Vinay M. Pai,2 Eric Bennett,2 Robert S. Balaban2.
Cardiovascular Physiology, Heinrich-Heine-University, Duesseldorf, Germany, Lab. Cardiac Energetics, National Institutes of Health, Bethesda, MD, USA
Introduction: Following application of microspheres (MS) into the left atrium, MS deposition is considered to be the gold standard for determination of organ and local tissue perfusion. When assessing myocardial deposition of MS in individual tissue pieces of e.g. 250 mg, a substantial variability of local deposition density is seen (CV 0.34), with about 10% of myocardial voxels displaying less than 50% and another 10% more than 150% of the average MS deposition, indicating major differences in local flow under physiological conditions. Due to averaging effects, this heterogeneity is only partially seen at lower spatial resolution. So far, little information is available on the local deposition pattern of MS at a high spatial scale.
In the past, it has been inherently difficult to correlate MR based measures of local perfusion with MS deposition, since conventional fluorescent MS require tissue sampling. Using microspheres that could be visualized by MR would overcome this obstacle.
Purpose: The purpose of the present study therefore was to obtain a 3-dimensional description of the deposition pattern of fluorescent MS in the ventricular myocardium, and to relate its pattern to that of MR visible iron-oxide-labeled MS.
Methods: In 16 anesthetized open-chest dogs, 15 μm microspheres were applied into the left atrium. In one series of experiments, differently colored, fluorescent MS (FMS) (0.25 106/kg) were applied sequentially (every 30 min) to determine the temporal stability of the local deposition pattern. In a second set of experiments, iron oxide labeled MS (IMS) (1 106/kg) were given and its deposition pattern imaged by in vivo MR.
At the end of the experiment, the hearts were excised and high resolution in vitro 3D data sets for IMS and FMS obtained by MR and fluorescence imaging (500 and 40 μm voxel size, respectively).
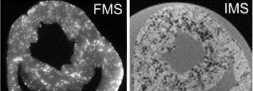
Results: T2-weighted MRI provided in vivo distributions of IMS and revealed high spatial heterogeneity (n=8). 3D images of IMS and FMS both confirmed the known transmural gradient of local MS deposition (n=6). Both MRI and fluorescence imaging revealed string-like patterns of high MS density and a non-random distribution (see ). Areas devoid of MS extended across more than 1 mm. Following sequential injections of differently colored FMS, different FMS were frequently observed within the same precapillary arteriole (n=6). This finding was corroborated by a quantitative analysis of the complete 3D data sets of differently colored FMS (n=4), revealing a high likelihood for different FMS to be in close proximity to one another, in marked contrast to a random distribution. Increasing the local perfusion by maximal vasodilation (adenosine) increased the local deposition density, but not the spatial pattern of deposition (n=3).
Conclusions: These data suggest that MRI of IMS will enable a direct comparison of MS deposition and MRI sensitive molecular markers (e.g. Gd). The large void volumes and high correlation of multicolor FMS suggest that microscopic MS deposition is not governed solely by flow.
Figure 1. High resolution images of deposition pattern of fluorescent MS (FMS) and iron oxide MS (IMS) from different myocardial slices.
340. Minimal-artifact Stents For Real-time Mri-guided Stenting And Acute And Chronic Evaluation Of Stent Patency
Min Su Hyon, MD, PhD,1 Fumiaki Ikeno, MD,1 Krishna Nayak, PhD,2 Craig H. Meyer, PhD,3 Alan Yeung, MD,1 Michael V. McConnell, MD, MSEE.1
Cardiovascular Medicine, Stanford University, Stanford, CA, USA,Electrical Engineering, Stanford University, Stanford, CA, USA,Electrical Engineering, University of Virgina, Charlottesville, VA, USA.
Background: Stent artifacts can impair the ability of MRI to provide image guidance of vascular stenting and to assess stent patency. Development of MRI-artifact-free stents would overcome these limitations.
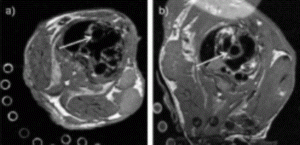
Methods: Acute and chronic MRI studies were performed in a total of 8 New Zealand White rabbits using copper stents (4.0×6–8 mm) placed in the infra-renal aorta, which is similar in size to human coronary arteries. A 1.5 T whole-body MRI system (GE Medical Systems, Milwaukee, WI) was used with high-speed gradients (40 mT/m, 150 T/m/s), a standard extremity coil, and a real-time interactive workstation. Real-time MRI guidance of stent deployment was performed using a high-resolution real-time spiral MRI sequence (20 cm FOV, 1.1×1.1 mm resolution, 12–30 frames/sec) in 3 rabbits. Stents were mounted on a coronary angioplasty balloon catheter (4.0×13 mm, Guidant Corp., Santa Clara, CA) and inflated ∼10 atm for 60–120 sec with gadolinium diluted in saline (Magnevist, 1:300, Berlex Laboratory, Wayne, NJ). Pre- and post-stent images were also acquired using a multi-slice interleaved spiral coronary MRA sequence (16 cm FOV, 20 interleaves, 0.58×0.58×3 mm, TR=1000 ms, TE=7 ms, flip angle 60°). In 5 rabbits, stents were deployed under fluoroscopy and serially evaluated with MRI for up to two months using the 0.6-mm resolution spiral coronary MRA sequence above, as well as a 0.32 black-blood FSE sequence (16-cm FOV, 512×512, 3 mm thick, TR-3000 ms, TE-34 ms, ETL-8, NEX-2).
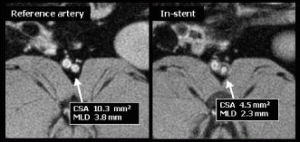
Results: In the group undergoing MR-guided stenting, real-time MRI demonstrated no appreciable stent artifact before, during, or after stenting (see Fig. ). Stents could be positioned in real-time using the location of the balloon side markers. Real-time MRI was able to image the full extent and duration of balloon dilatation. Acutely post stenting, a bulge in the aorta was seen, but no stent artifact. On autopsy, the stents were identified at the location matching MRI. Similarly, in the group of rabbits undergoing serial evaluation of in-stent restenosis, MRI was able to follow changes in the stented vessel wall (see Fig. ). At one-month follow-up, there was moderate restenosis. Mean minimal lumen diameter was 2.5±0.26 mm within the stent, compared to 3.7±0.1 mm outside the stent (p=0.001), resulting in a mean diameter stenosis of 32±8.5% and a mean area stenosis of 49±11.6%(10.6±0.77 mm2 vs. 5.3±0.97 mm,2 p=0.001). A small dark ring was seen on images with the spiral MRA sequence but not with the FSE sequence. There was no significant progression in restenosis at two-month follow-up.
Conclusion: Use of a coronary-size stent with minimal MR artifact allowed real-time MRI assessment of stent dilatation and acute patency, as well as chronic evaluation of in-stent restenosis.
Figure 1. MRI-guided stenting.
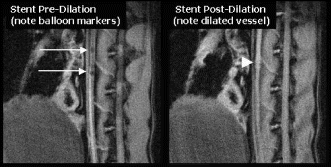
Figure 2. Insert restenosis after one month.
341. High Resolution MRI with Combined Cardiac and Respiratory Gating Allows for In Vivo Atherosclerotic Plaque Visualization in the Murine Aortic Arch
Frank Wiesmann,1 Michael Szimtenings,2 Alex Frydrychowicz,1 Andreas Hunecke,1 Eberhard Rommel,2 Stefan Neubauer,3 Axel Haase.2
Medizinische Klinik, Universitaet Wuerzburg, Germany, Physikalisches Institut, Universitaet Wuerzburg, Germany, Dept. of Cardiovascular Medicine, University of Oxford, Germany.
Introduction: Genetically engineered mouse models provide enormous potential for investigation of the underlying mechanisms of cardiovascular disease. Mice deficient in apolipoprotein-E (apoE -/-) develop atherosclerotic lesions similar to those observed in humans. Due to gross motion of aortic arch, previous MR studies were limited to visualization of the abdominal aorta. However, predominant sites of plaque development and early progression are the ascending aorta and the aortic arch. Hence, aim of this study was to test the feasibility of magnetic resonance imaging (MRI) to non-invasively visualize atherosclerotic plaques in the thoracic aorta in apoE-KO mice in vivo.
Methods: MR imaging was performed on a horizontal bore 7.05 T experimental scanner equipped with a microscopy gradient insert. Adult apoE -/- mice (mean body weight ×g) were studied after having been on a western type (high-cholesterol) diet for 3 months. Mice were anesthetized with inhalative isoflurane via a nose cone and kept normothermic by a warming pad. For freezing of cardiac and vessel motion, MR data acquisition was both ECG and respiratory gated applying high- and lowpass-filtering of the original ECG signal by a homebuilt dual trigger unit. T1-weighted spin echo MR images were acquired with TR/TE ∼1000/10 ms. Spatial image resolution was 49×98×300 μm3.
Results: Black-blood spin-echo MRI with combined cardiac and respiratory triggering revealed a clear view of the lumen and the vessel wall of the aortic root and aortic arch in all mice studied. Mice with ApoE -/- showed multiple arteriosclerotic plaques with preferential location in the aortic root, ascending aorta and inner curvature of the aortic arch (Fig. ; a) Normal Control; b) ApoE -/-; arrows indicating ascending aorta). Successful freezing of cardiac and respiratory motion allowed even for visualization of cardiac microstructures such as aortic valve cusps and arteriosclerotic lesions in the aortic sinuses. Comparison of MR images with corresponding cross-sectional histopathology showed high correlation of aortic vessel wall area (r=0.97;MRI wall area=1.14×Histo wall area+0.09; p<0.0001) and excellent agreement of MRI wall area measurements with histopathology (mean difference 0.19±0.02 mm2).
Conclusions: High resolution black blood MR imaging applying combined cardiac and respiratory gating allows for detailed and robust visualization of atherosclerotic plaques even in the murine ascending aorta and aortic arch. This allows for accurate, non-invasive MR quantification of atherosclerotic plaque burden in the murine thoracic aorta as the preferential site were progression of atherosclerotic disease is starting. By application of double-gated MRI in mouse models of arteriosclerosis we may now move forward to systematically study the mechanisms involved in progression and regression of atherosclerotic disease.
342. Demonstration of the Sensitivity of Hypertrophied Hearts to Ischemia Using Functional and Contrast Enhanced MRI
Simon Schalla, MD,1 Michael F. Wendland, PhD,1 Wolfgang Ebert, PhD,2 Charles B. Higgins, MD,1 Maythem Saeed, PhD.1
Radiology, University of California San Francisco, San Francisco, CA, USA,Schering AG, Berlin, Germany.
Introduction: Myocardial hypertrophy is an important risk factor for myocardial infarction, congestive heart failure and sudden death. Hypertrophied hearts are prone to greater susceptibility to ischemic injury than normal heart. Therefore, accurate estimation of left ventricular (LV) mass and early detection of ischemia are important in patients with hypertrophied hearts. MRI has been successfully used to measure myocardial mass and function. Administration of MR contrast media enhances the potential of MRI in estimating myocardial infarction and assessment of viable myocardium. The newly developed necrosis specific MR contrast agents provide accurate measurement of infarction size in normal hearts subjected to ischemia. However, this new class of contrast media has not been tested in hypertrophied hearts subjected to ischemia.
Purpose: 1) to compare the susceptibility of hypertrophied hearts to ischemia with that in normal hearts using functional MRI, 2) to measure and compare the size of infarcted myocardium in hypertrophied and normal hearts using the newly developed necrosis specific MR contrast agent Gadophrin III and 3) to validate the mass of hypertrophied hearts and infarction size measured on contrast enhanced MRI with that measured on postmortem using histochemical staining.
Methods: Aortic stenosis proximal to the renal arteries was produced in 10 rats (110–120 g) to induce LV hypertrophy. Rats with matched body weight (n=10) and environmental conditions were used as a control (no aortic stenosis). Eight weeks after surgery, the hearts were subjected to regional ischemia by occluding the left coronary artery for 25 min followed by 3hours reperfusion. At the beginning of reperfusion, the necrosis-specific agent Gadophrin III (Schering AG, Berlin, Germany) was intravenously injected (0.05 mmol/kg) to delineate infarcted myocardium in both hypertrophied and normal rats. Three hours after injection, multislice T1-weighted spin echo images were acquired to define the infarcted regions in the entire hearts. End-systolic and end-diastolic images were obtained to determine the effect of ischemia/reperfusion on LV function in hypertrophied and normal hearts. A 2.0T CSI-II-system (Bruker Instruments, Fremont, CA) was used for image acquisition with the following parameter: slices thickness=2 mm, field of view=5×5 cm, TR=30 ms, TE=12 ms, image matrix=256×128. After MR imaging, the left coronary artery was re-occluded and 0.7 ml of phthalocyanine blue dye was intravenously injected to define the area at risk. The LV was transversely sliced into 4–6 slices; each of 2 mm thickness corresponding to the MR images. Each slice was then incubated in 2% triphenyl-tetrazolium-chloride solution to define the necrotic myocardium. The sizes of contrast media enhanced regions, mass, LV volumes and wall thickness/wall thickening were determined in all animals.
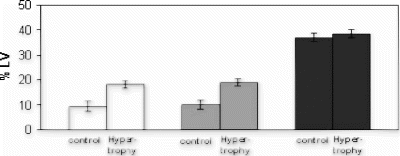
Results: LV Mass: On MRI, the LV mass in rats subjected to aortic stenosis was significantly greater (803±16 mg) than that in normal hearts (618±17 mg; p=0.001, unpaired t-test). Close correlation in LV mass was found between MRI and postmortem measurements (818±14 mg in hypertrophied and 616±18 mg in normal hearts). The number of short axis slices to cover the entire heart was greater in hypertrophied hearts (Fig. ).
Myocardial Infarction: There was no significant difference in signal intensity (SI) between infarcted and remote non-infarcted myocardium prior to administration of Gadophrin-III in both groups. The infarcted regions were recognized as bright zones in hypertrophied and normal hearts. The SI ratios between infarcted and remote myocardium were 1.79±0.62 in hypertrophied hearts and 1.74±0.55 in normal hearts (p=ns). However, the size of the infarcted region was significantly larger in hypertrophied hearts (19.0±1.4% of LV) than in normal hearts (9.8±1.7% of LV, p=0.001) (Fig. ). At postmortem, the infarction size was 19.0±1.5% LV in hypertrophied and 9.8±1.7% LV in normal hearts. There was no significant difference between Gadophrin-enhanced region and histochemical staining at postmortem. Bland-Altman test revealed excellent agreement between the size of infarction seen on Gadophrin-enhanced MRI and that on histochemical staining. The difference in the size of infarction measured on MRI and postmortem cannot be attributed to the differences in the size of areas at risk, because both groups have identical area at risks (38.5±1.5% LV in hypertrophied hearts and 37.0±1.5% in normal hearts). These findings support the notion that hypertrophied hearts are more susceptible for the same duration of ischemia than normal hearts.
LV Function: The deterioration in LV function was more pronounced in hypertrophied hearts than normal hearts subjected to the same duration of ischemia/reperfusion. The ejection fraction was significantly lower in hypertrophied (39±4%) than normal hearts 49±2% (p=0.01). LV dilatation after coronary occlusion/reperfusion was greater in hypertrophied than normal hearts, as reflected by the end-diastolic volume (EDV). The EDV was 2.09±0.17 ml in hypertrophied and 1.64±0.08 ml in normal hearts. The difference in ejection fraction and EDV are most likely attributed to the sensitivity of injury in hypertrophied hearts; i.e. the difference in the size of infarction. Close correlation was found between the increase in EDV and infarction size.
There were no significant differences in heart rate and percent wall thickening (%WT) between the groups. %WT in the infarcted and remote non-infarcted regions was 7±3% and 32±3% in hypertrophied hearts and 4±1% and 35±2% non-hypertrophied hearts, respectively. Mean systolic/diastolic aortic blood pressure was 100±10/74±10 mmHg in hypertrophied hearts and 114±3/70±7 mmHg in non-hypertrophied hearts.
Conclusions: Functional and contrast-enhanced MRI clearly demonstrate the high sensitivity of hypertrophied myocardium to ischemia compared to normal hearts. The new necrosis specific contrast agent Gadophrin III accurately estimates the size of infarction in hypertrophied hearts. The data revealed close correlation between the impairment in LV function and infarction size. Thus, MRI may be useful for assessment of infarction size, LV mass and function of hypertrophied hearts.
Figure 1. Short axis slices of a normal hearts subjected to 25 min ischemia and 3 h reperfusion (top image row) and hypertrophied heart subjected to the same duration of ischemia/reperfusion (bottom image row) after administration of Gadophrin III. The size of the hyperenhanced zone is bigger in hypertrophied heart.
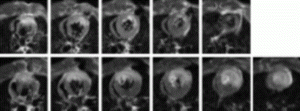
Figure 2. Area of necrosis determined with TTC (white boxes) and Gadophrin (grey) and area at risk determined with blue dye (dark) in normal and hypertrophied hearts.
343. An Active MR Injection Catheter for Treatment of Myocardium
Parag V. Karmarkar,1 Dara Kraitchman, Ph.D.,2 Lawrence Hofmann, M.D., Ph.D.,3 Robert Lederman, M.D.,4 Ergin Atalar, Ph.D.2
Radiology and Radiological Sciences, Johns Hopkins University, Baltimore, MD, USA, Radiology and Radiological Sciences, The Johns Hopkins University, School of Medicine, Baltimore, MD, USA, The Johns Hopkins University, School of Medicine, Baltimore, MD, MD, USA, National Heart, Lung, and Blood Institute, National Institutes of Health, Bethesda, MD, USA.
Introduction: Different therapeutic modalities to achieve myocardial tissue regeneration involve delivery of biological systems e.g. stem cells, cardiomyocytes, angiogenic growth factors, etc., into the myocardial tissue. The excellent tissue contrast of MRI enables differentiation and localization of tissue within the myocardium. This enables precise location of the site where the therapeutics are required. A steerable deflectable tip injection needle catheter with active tracking under MRI was developed for precision delivery of therapeutic agents into the myocardium. This delivery system can also be used for other applications, e.g. septal tissue ablation for treating HOCM.
Purpose: We designed an active MRI catheter that has a steerable and deflectable tip using loopless catheter antenna technology. We also investigated the utility of this design in a series of experiments in a canine and porcine models.
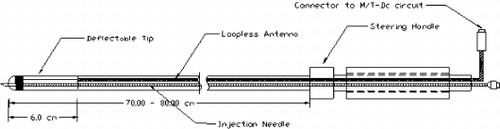
Methods: A 9 Fr intramyocardial injection catheter was built as shown in Fig. .
A loopless antenna was incorporated in the design to provide active tracking and distal tip visualization. A 25 gauge MR compatible Nitinol needle, which runs along the length of the catheter can be advanced from 0 to 1 cm into the tissue. The tip deflection mechanism enables the needle to be directed to the site of interest.
The injection catheter system was tested in a canine model. The catheter was advanced in the left ventricle via the carotid artery. To test the feasibility of the design, Gd-DTPA and bluedye mixture was injected into myocardium using this catheter. The procedures were completed solely under MRI-guidance on a GE 1.5T Signa scanner. The catheter was tracked in the left ventricle using an ungated FIESTA pulse sequence (4.4 ms TR, 1.3 ms TE, 45° FA, 125 KHz BW, slice thickness of 5–10 mm, 30 cm FOV, 128×128 image matrix) in combination with an interactive scan plane acquisition (I-drive, GE).
Results: The length and the distal tip of the catheter were tracked and intramyocardial injections of a Gd-DTPA (with a concentration of 30 mM) and tissue marker dye mixture was carried out by advancing the needle 0.8 cm into the tissue. Position and the area of the injections were matched in the histological slides of the stained myocardium and the contrast enhanced MRI images.
Conclusions: We have developed an active MR intramyocardial injection catheter that enables delivery of therapeutic agents to the desired locations in the myocardium.
Figure 1.
344. Cartesian, Spiral, and Radial Coronary MR Angiography—A Comparison
Oliver M. Weber, PhD, Alastair J. Martin, PhD, Charles B. Higgins, MD.
Department of Radiology, University of California, San Francisco, San Francisco, CA, USA.
Introduction: High-resolution bright blood coronary magnetic resonance angiography (MRA) has proven to be a reliable technique for visualization of coronary arteries and detection or exclusion of significant stenoses. A variety of read-out schemes have been proposed, with differences in signal-to-noise ratio (SNR), vessel edge sharpness, and visible vessel length. However, systematic comparison of several techniques has been scarce.
Purpose: To compare six free-breathing, bright-blood coronary MRA sequences with identical magnetization preparation.
Methods: Ten healthy volunteers were examined in a 1.5 T clinical scanner (Intera I/T; Philips Medical Systems, Best, the Netherlands). All sequences featured a T2-preparation pulse (TE=50 ms), fat-suppression by selective excitation, and a prospective navigator, placed on the right hemi-diaphragm, for respiratory gating. The following read-out sequences were applied in randomized order: 1) Cartesian turbo field echo (C-TFE); 2) Cartesian balanced TFE (C-bTFE); 3) spiral Fast Field Echo (S-FFE); 4) spiral TFE (S-TFE); 5) radial TFE (R-TFE); and 6) radial bTFE (R-bTFE). The right coronary artery (RCA) was covered in a single slab (field of view, 27 cm), consisting of 10 slices of 3 mm thickness each, reconstructed to 20 slices of 1.5 mm with an in-plane matrix of 5122. All techniques had a readout time per heart beat of less than 80 ms in late diastole and a spatial resolution of less than 1×1 mm2. Images were processed in a visualization and quantification tool (SoapBubble tool; Philips), where values of SNR, contrast-to-noise ratio (CNR), visible vessel length, vessel edge sharpness, and vessel diameter were assessed. Repeated measures analysis of variance with Tukey-Kramer post-test was performed (significance level, 0.05).
Results: Imaging was successful in all subjects . Overall, C-bTFE provided the best images, showing the vessels over the longest distance (mean length, 96.0±27.8 mm; p<0.05 vs. all sequences) with very good vessel sharpness and good SNR and CNR. S-FFE provided highest values for SNR and CNR, but reduced vessel sharpness and increased blurring in distal segments, resulting in shorter visible vessel length (71.6±16.5 mm). C-TFE showed similar SNR as and slightly lower CNR than C-bTFE, but its considerably reduced vessel edge sharpness resulted in shorter visible vessel length (80.8±22.7 mm). S-TFE, the fastest sequence, showed the expected loss in SNR and CNR of approximately 30% as compared to S-FFE, but otherwise very similar results (vessel length, 66.8±16.1 mm). The radial sequences showed very sharp vessel edges, but low SNR and CNR. This resulted in poor values for vessel length for R-TFE (69.9±22.4 mm), whereas excellent background suppression in R-bTFE facilitated reasonable vessel length values (78.1±19.8 mm).
Conclusion: The Cartesian balanced TFE sequence is the most promising sequence of the six sequences investigated. Further studies will be needed to explore its potential to detect or exclude coronary artery disease. C-TFE proved to be a reliable sequence with consistent image quality. However, sub-optimal background suppression limited its value in distal vessel segments. Despite highest SNR and CNR, the spiral sequences performed poorer with respect to vessel edge sharpness and visible vessel length. The radial sequences finally provided insufficient SNR and CNR.
Figure 1. Examples of coronary MRA obtained in a volunteer using the six sequences.
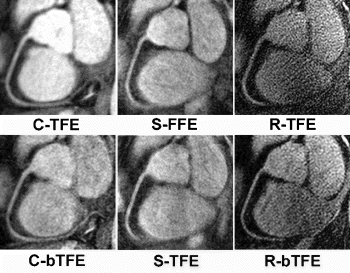
Table 1. Imaging parameters
345. MRA-Guided Vascular Interventions: In Vivo Evaluation of the Combined Use of Carbon Dioxide and a Blood-Pool Agent
Frank K. Wacker, MD,1 Robbert Maes, MD,2 Sherif G. Nour, MD.1 Jeffrey L. Duerk, Ph.D.,1 Jonathan S. Lewin, MD.1
Dept. of Radiology—MRI, Case Western Reserve University/University Hospitals, Cleveland, OH, USA, Gemini Ziekenhuis, Den Helder, Netherlands.
Introduction: Direct intraarterial injections of diluted paramagnetic compounds such as Gd-DTPA have been used to confirm the catheter position and assess the blood flow distal to the catheter in MR imaging guided vascular interventions. Major limitations of such agents are: 1) that they rapidly diffuse into the extracellular space resulting in marked background enhancement over the course of the procedure, 2) that they impose a negative effect on kidney function in larger quantities, and 3) that they are not helpful in combination with modern intravascular contrast agents which can be used to improve and prolong the vessel conspicuity during other phases of MRI guided vascular procedures. In this situation a dark blood contrast agent is needed.
Purpose: The purpose of this study was to test the combined use of carbon dioxide (CO2) and a gadolinium-based blood pool agent for MRI-guided vascular procedures in an animal model.
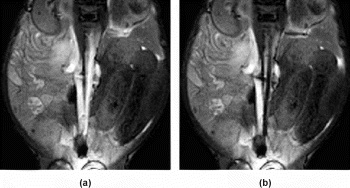
Methods: After an initial IV injection of Gadomer-17 (synthetic polymeric paramagnetic complex, Schering AG, Germany) repeated intraarterial CO2 injections were performed with an angiography catheter in the aorta and after selective catheterization of the renal arteries of two fully anesthetized swine. Real-time images were acquired using near real time gradient echo sequences (trueFISP: TR/TE: 3.0/1.5 ms, 5–7 mm slice thickness, flip angle 40–70°, 3 images/s; FLASH: 2.7/1.2 ms, 5–7 mm slice thickness, flip angle 30°, 3 images/s) throughout the CO2 injections. Signal intensity measurements and subjective assessment of the vessel conspicuity before, during and after CO2 injections were obtained.
Results: During the CO2 injections, the gas formed a moving column resulting in an immediate statistically significant decrease in signal intensity in the aortic lumen with an immediate signal increase as the gas left the vessel segment. Hence, one bolus injection allowed assessment of the flow not only during the actual injection of the contrast agent but also when the bright Gadomer-17 enhanced blood returned. Confirmation of the intravascular catheter-tip position and assessment of the patency of the arteries distal to the catheter tip was achieved repeatedly and reliably throughout the trials. See Figure .
Conclusions: The double contrast technique using a polymeric Gadolinium based contrast agent in combination with CO2, a well accepted and inexpensive contrast agent with a favorable safety profile, allows confirmation of the catheter-tip location and provides immediate information about the blood flow distal to the catheter during an interventional procedure. It is a safe and straightforward method to facilitate MR imaging guidance for vascular procedures.
Figure 1. (a) Two selected images from a coronal oblique trueFISP-image series (frame rate 3 images/s) of the Gadomer-17 enhanced abdominal vessels. The images are continuously acquired before (a) and during (b) CO2 injection through a catheter located in the suprarenal aorta.
346. High Resolution MR Imaging of Arterial Wall in Watanabe Heritable Hyperlipidemic Rabbits Using Generalized Autocalibrating Partially Parallel Acquisitions (GRAPPA): A Feasibility Study
Shao-xiong Zhang, M.D./PhD, Claudia Hillenbrand, PhD, Frank K. Wacker, M.D., Jeffrey L. Duerk, PhD, Jonathan S. Lewin, M.D.
Radiology-MRI, University Hospitals of Cleveland, Case Western Reserve University, Cleveland, OH, USA.
Introduction: Atherosclerosis, the pathologic process underlying myocardial infarction, stroke and other occlusive vascular disease, is the major cause of death in the western world. MRI has been used non-invasively to characterize atherosclerosis and plaque burden both in humans and animal models of disease as a result of MRI's excellent soft tissue contrast and flow sensitivity. TSE based black blood techniques have been shown to be the methods of choice for these applications since they provide strong contrast between the low signal lumen and the high amplitude vessel wall. Specificallly, double inversion (DIR) magnetization preparation is commonly used to null the signal from flowing blood. DIR appears to be superior to presaturation of flowing spins primarily because it provides excellent blood suppression without plaque-mimicking slow flow artifacts. However, the problem with DIR techniques is that they are essentially single slice methods with relatively long imaging time. Because of this, these methods are susceptible to patient motion and patient discomfort from the long scan times.
We previously reported the feasibility of reducing the acquisition time in black blood carotid vessel wall imaging by using GRAPPA, a more generalized extension of autocalibrating partially parallel acquisition (PPA) methods. The purpose of this study was to further investigate the efficacy of GRAPPA in vessel wall imaging by statistically comparing the signal-to-noise ratio (SNR) and contrast-to-noise ratio of DIR sequences acquired with partially parallel acquisitions in comparison to standard TSE DIR dark blood imaging techniques in an animal model of atherosclerotic vessel wall disease.
Methods: To assess the efficacy of GRAPPA in vessel wall imaging, high-resolution cross-sectional images of abdominal aorta, iliac artery and carotid artery of three Watanabe Heritable Hyperlipidemic (WHHL) rabbits were acquired on a clinical 1.5 T MR scanner (Magnetom Sonata, Siemens Medical Solutions, Erlangen, Germany) using a custom-made, bilateral two-element RF coil array suitable for spatial encoding. The imaging protocol included: fat suppressed DIR, and both T2-weighted and proton density weighted TSE acquisitions. The TSE sequences were acquired once as rectangular FOV techniques with 2 NSA and twice as parallel acquisitions with an acceleration factor of 2 with 2NSA, 3NSA and 4NSA respectively. In the GRAPPA acquisitions, FOVPhase and the number of phase-encoding steps were reduced by 50%. Additional lines in the center of k-space were acquired to determine the autocalibration parameters used for the final reconstruction. Imaging parameters were: TE 7.1/51 ms, ETL 31/21(PDW/T2 W), TR 3000 ms, TI 550 ms, TINTER 7.1 ms, BW 275 Hz/pixel, slice thickness 3 mm, number of slices 5, FOV 100×75 mm,2 and matrix 252×192, with in-plane resolution as 0.39×0.39 mm2. SNR and CNR were defined as follows:
SNRmuscle=Smuscle/SD of the background signal intensity;
SNRvessel wall=Svessel wall/SD of the background signal intensity;
CNR=(Svessel wall−Slumen)/SD of the background signal intensity.
The signal intensity of vessel wall, lumen, psoas major muscle, and air were measured in each image of each acquisition. The data was imported to SPSS (version 11.0) and ANOVA with a Tukey HSD test was used to assess the statistical difference between GRAPPA and standard dark blood imaging.
Results: GRAPPA performed very well in high-resolution dark blood carotid imaging. A comparison of standard (non PPA) and GRAPPA images revealed that GRAPPA provided better vessel wall SNR and CNR when compared to the standard acquisition in T2 and PD weighted experiments as shown in .
It is important to point out that all GRAPPA images, except those acquired with 4NSA were acquired in less time than the conventional TSE scans. Hence, in many cases statistically significant differences of improvement in SNR and CNR were obtained with GRAPPA with reduced acquisition times, especially in T2W images, except GRAPPA images with 2NSA. SNRmuscle, SNRvessel wall and CNR are higher and statistically different on all GRAPPA images with 4NSA than on standard TSE images with either PD or T2 weighting (P<0.005) except for CNR in PDW images .
Conclusion: Both image quality and acquisition time are clinically important for diagnosis and characterization of patients with atherosclerotic disease. Our results demonstrated that GRAPPA images provide opportunities for improved SNR and CNR, when compared to conventional TSE acquisitions, at reduced acquisition time, especially in T2 W images. In summary, GRAPPA, a partially parallel acquisition technique, is a promising method in atherosclerosis imaging, and should be used in T2 W and PDW, especially T2 W, acquisition of atherosclerotic arteries in patients undergoing plaque characterization or plaque burden evaluation.
Figure 1. Benefit from shorter acquisition time, GRAPPA PDW images with 3NSA (a.) and T2 W images with 3NSA has comparable or better image quality than standard TSE PDW (b) and T2 W image (d). Arrows indicate the abdominal aorta of the WHHL rabbit.
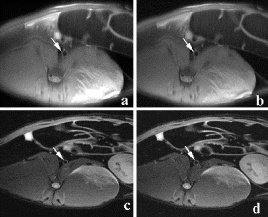
Table 1. Comparison of GRAPPA and standard TSE in PDW images
Table 2. Comparison of GRAPPA and standard TSE in T2 W images
347. 3D Quantitative Flow Mapping in the Aortic Arch of Mice by In Vivo Phase Contrast MRI
Frank Wiesmann,1 Michael Szimtenings,2 Jochen Kuhstrebe,2 Ralf Illinger,1 Alex Frydrychowicz,1 Stefan Neubauer,3 Eberhard Rommel,2 Axel Haase.2
Medizinische Klinik, Universitaet Wuerzburg, Germany,Physikalisches Institut, Universitaet Wuerzburg, Germany,Dept. of Cardiovascular Medicine, University of Oxford, United Kingdom.
Motivation: Recent progress in molecular biology allowed for generation of numerous transgenic mouse models with a distinct vascular phenotype. Since, so far, only ex vivo studies of isolated vessel preparations have been performed for murine vascular function assessment, a technique for in vivo investigation of vascular function is clearly needed. Blood velocity measurements with doppler echocardiography are feasible in mice, but are limited due to potential measurement errors resulting from restricted acoustic windows and consequently from angulation problems.
Hence, aim of this study was the development and validation of a non-invasive MR-method for 3D visualization of aortic flow profiles and quantification of aortic volume flow in the mouse.
Methods: MR studies were performed in healthy mice under inhalative Isoflurane anesthesia (1.5 Vol% at 1 L/min oxygen flow) on a 7 T experimental MR scanner (Bruker BIOSPEC, Germany). Phase-contrast cine MRI with flow encoding in slice direction (bipolar flow-encoding gradient at the end of slice selection) was applied in an imaging plane perpendicular to the ascending aorta. MR imaging parameters were TR 7 ms, TE 2.7 ms, slice thickness 1 mm, FOV (3 cm)2, matrix 1282, spatial resolution in-plane (230 μm)2, application of 8 encoding gradients, NEX 4, acquisition time 10 min / slice. Calculation of phase-contrast MR maps was done by complex subtraction of flow-encoded and flow-compensated data sets.
Results: Adaptation of hardware and the phase-contrast MR cine sequence to the requirements of the mouse allowed for a successful methodological transfer of phase-contrast flow mapping to the mouse in vivo. A validation study with a flow phantom revealed high agreement between MR-derived and true volume flow. Phase contrast imaging allowed for detailed visualization of 3D blood flow profiles in the murine ascending aorta . There was high correlation and agreeement of aortic volume flow and cine-MR derived left ventricular stroke volume (r=0.90, p<0.01, mean difference 2.8 μl). A significant reduction of measurement time was obtained by reducing the number of encoding steps without impairment of measurement accuracy.
Conclusions: This study demonstrates for the first time the feasibility of non-invasive measurements of 3D aortic flow profiles in the mouse. This technique allows for non-invasive assessment and quantification of valvular incompetence, and, due to the potential of 3D visualization of flow profiles, may provide important information on vessel wall characteristics and function of the murine aorta. By the combination of flow compensated CINE-MRI and phase-contrast flow mapping, we now have the methodological prerequisites for a comprehensive cardiac and vascular phenotype characterization in mice.
Figure 1.
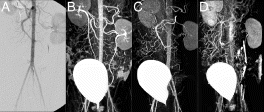
348. Optimization of Intra-arterial Contrast Agent Delivery for MR Angiography
Alastair J. Martin, PhD, Maythem Saeed, PhD, Oliver M. Weber, PhD, Mark W. Wilson, MD, Charley B. Higgins, MD, David A. Saloner, PhD.
Radiology, University of California, San Francisco, CA, USA.
Introduction: MR guidance of endovascular procedures has some significant benefits, including the ability to directly interrogate soft tissue surrounding the vascular space. The presence of an intra-arterial catheter offers new opportunities for improving MR angiograms and minimizing the volume and dose of contrast required for optimal results. This ability may improve the feasibility for MR to guide all stages of endovascular therapy.
Purpose: The effects of dose and volume of extracellular MR contrast media were assessed to optimize MR angiography via intra-arterial delivery of MR contrast media in an animal model.
Methods: All experiments were performed on a 1.5 T magnet with 30 mT/150 mT/m/ms gradients (Philips “Intera’, Best, The Netherlands). Three anesthetized and mechanically ventilated dogs (∼20 kg) were studied with arterial access was achieved via a percutaneous puncture of either the carotid or femoral artery. All animal experiments received previous approval from the institutional committee on animal research.
Contrast Injection Parameters: Dilutions of 0.5 M stock Gd-DTPA-BMA contrast agent (Nycomed “Omniscan”, Oslo, Norway) were prepared and injected at constant rates through a syringe infusion device (Medrad “Spectris”, Indianola, PA). Pure contrast, along with dilutions of 50% and 20% contrast in saline, were investigated and infusion rates were set by the dilution factor, flow conditions and the target arterial concentration of the contrast agent (1, 2, or 4%). The intra-arterial injection catheter was positioned in the thoracic aorta under x-ray fluoroscopy. Velocity encoded cine MRI was used to measure aortic flow. MR fluoroscopy was used to determine an appropriate delay time between the start of infusion and the start of volumetric MR acquisitions. Injection duration was fixed to 75% of the MR scan duration.
MR Acquisitions: Volumetric flow within the aorta was determined just distal to the catheter tip by phase sensitive flow analysis (Qflow). A fluoroscopic (5 fps) projection angiogram was used to determine the delay time between the start of contrast injection and enhancement of distal vessels within our field of view. High-resolution 3D MR angiograms (FOV=250, rFOV=80%, matrix=400×400, 38 1.2 mm slices, TR/TE=5.1/1.8 ms, flip angle=30, H20/Fat shift=.72 pixels, SENSE factor=2, acquisition time=30 s) with centric ordered phase encoding were started at the determined delay time following the start of injection. These angiograms were repeated for all target blood concentrations and contrast dilution factors.
Results: Volumetric flow within the thoracic aorta averaged 15 ml/s. The delay time for enhancement of distal vessels following the start of contrast infusion was determined to be 2.5 s. Injections of equivalent amounts of contrast, but at different dilutions were found to produce substantially different results . For example, when injecting higher concentrations of Gd, it was evident that more distal vessel segments enhanced more than proximal segments. These differences are most likely explained by better mixing of the injectate as it travels further downstream. By injecting more dilute contrast at higher rates, however, it was possible to achieve better enhancement, particularly closer to the injection site. Overall, best results were achieved with a dilution of 20% contrast in saline and a 2% target concentration of the contrast agent in the blood pool. In our study, this arterial concentration required the delivery of less than 8 ml of contrast and produced excellent results.
Conclusions: Intra-arterial injection of extracellular MR contrast media provides high-resolution MR angiograms with minimal contrast. Injection of highly concentrated Gd-based solutions near the region of interest, however, produces mixing problems with highly concentrated Gd-based solutions and results in inferior image quality. In the other hand, injection of more dilute contrast, at higher injection rates, largely overcomes this limitation.
Figure 1. Abdominal angiograms obtained via intra-arterial transcatheter delivery of contrast agents. The x-ray angiogram (A) provides a useful anatomical reference for the MR acquisitions (B-D). All MR acquisitions were designed to achieve a blood concentration of 2% contrast. Injection of more dilute contrast at higher rates (B-20% contrast at 1.7 mls/s) produced markedly better results than more concentrated variants (C-50% contrast at 0.7 mls/s, D-100% contrast at 0.4 mls/s). Note-the bladder is clearly evident on all the projection MR angiograms as a result of contrast accumulation during the study.
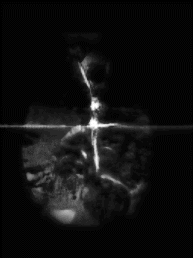
349. Innovative Coil Design for Minimally Invasive Device Tracking Applications
Eddy Y. Wong, MSE,1 Daniel R. Elgort, MSE,1 Claudia M. Hillenbrand, Ph.D.,2 Jonathan S. Lewin, M.D.,2 Jeffrey L. Duerk, Ph.D.2
Department of Biomedical Engineering, Case Western Reserve University, Cleveland, OH, USA, Department of Radiology, University Hospitals of Cleveland, Cleveland, OH, USA.
Introduction: With recent improvements in both hardware (gradients, receiver hardware, etc.) and software (fast imaging sequences), magnetic resonance imaging (MRI) has evolved from a purely diagnostic role to one that includes therapy. Minimally invasive image guided therapy requires a quick and robust method for localization and tracking of interventional devices inserted into the body. To this end, active tracking applications have been proposed as a means to facilitate this guidance. The purpose of this work was to design a tracking coil that incorporates an internal signal source while retaining minimal dimensions. Aspects of design, construction and successful utilization in automated tracking experiments are described.
Methods: Tracking coil devices with both single and double active loop elements were constructed and mounted on 5-French catheters. Active loop elements were wound from 30 AWG copper magnet wire. Dimensions of the loop elements are approximately 4 mm along the long axis and 2.5 mm along the short axis. For the double loop device, loops were wound with a center-to-center distance of 23 mm. Tuning and matching of the resonant circuit was accomplished using surface mount capacitors. Capacitive coupling to the MR receiver system was made utilizing a micro-coaxial cable. A plastic tube was then affixed over the active antenna elements and secured into place with epoxy. The tube was then filled with an internal signal source and sealed. The final device measures 11 F in diameter. A picture of the single active loop device is shown in Figure .
Tracking experiments were conducted in a Siemens 1.5T Sonata clinical scanner. Custom software was written, which allows the scanner to automatically track the catheter in real-time using a limited number of projections. The system also allows an imaging slice location and orientation to follow the catheter by alternating between localization and imaging modes. For use with the single element catheter, the software collects three orthogonal projections and updates the scan plane position. For use with the double element catheter, the tracking software implements a bi-plane radial localization algorithm (JMRI 14:617-627 (2001)) and updates the scan plane position and orientation. The tracking software uses either FLASH or True-FISP sequences to collect image data between localizations.
Results: Experiments were successful in isolating and following the active antenna elements of the tracking system. Catheter advancement and retraction were successfully tracked in all imaging experiments. The contrast to noise ratio (CNR) of the internal signal source was approximately 10 during the tracking phase of the experiments. As previously reported, the system accuracy was better than 3 mm in displacement error and 2 degrees orientation error.
Discussion: The use of a loop coil design provides for sensitivity in most orientations during typical device use. An internal signal source provides several advantages in active tracking experiments. The signal source allows for tracking to be performed with very low flip angles (approx. 1–2 degrees). Tip angle amplification results in the signal source seeing an effective tip angle greater than the rest of the surrounding tissue, making identification from the surrounding tissue easier. The use of a low tip angle also eliminates the need for dephaser gradients to eliminate tissue signal during tracking, allowing for increased temporal resolution in tracking experiments.
The tracking system is able to update the imaging scan plane based on the position and orientation of the interventional device in 50 ms. The localization algorithms have demonstrated that the scan plane will be positioned with less than 3 mm displacement error and 2 degrees orientation error which is sufficient for all planned clinical applications and intravascular interventions outside of the coronary arteries.
Conclusions: A catheter-based, active system with an internal signal source for device tracking has been constructed and been shown to provide quick, accurate and robust in-vivo localization and tracking.
Figure 1. Picture of single-loop tracking coil with internal signal source.
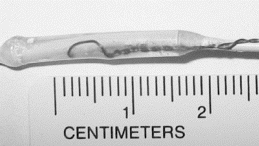
Figure 2. Image acquired with the tracking coil data superimposed on image data. The catheter was advanced in a porcine vessel and images were acquired in real-time.
350. Torsion Patterns Are Preserved in Both Young and Old Hearts After Small Myocardial Infarction During the Remodeling Process
Wei Liu, Junjie Chen, J. Stacy Allen, Mark McLean, Samuel A. Wickline, Xin Yu.
Cardiovascular MR Laboratories, Washington University in St. Louis, St. Louis, MO, USA.
Introduction: In the aging heart, left ventricular function may remain well preserved despite significant alterations in myocardial morphology. Whether myocardial remodeling after infarction might differ between young and old subjects in terms of indexes such as twist and torsion remains unknown. If these fundamental mechanisms of ventricular contraction were adversely affected in old versus young hearts, the excess cardiac mortality in the elderly might be explained.
Purpose: We used MR tagging to compute fiber torsion indexes to register subtle changes in the mechanical functions as a consequence of infarction in young and old rats.
Methods: Fisher 344 rats 4 months of age (young, n=4) and 20 months of age (old, n=9) underwent coronary occlusion. Four young and nine old rats subjected to sham-operated procedure served as controls. MRI tagging was performed 4 weeks after surgery on a Varian 4.7T scanner with a surface RF coil. The rats were sedated with 1% isofluorine by a nose cone. Three short-axis slices were imaged: the midventricular slice, chosen at 50% of the distance between the atrioventricular valve plane and apex; the basal and apical slices, chosen 3 mm above and below the midventricular slice repspectively. The tagging sequence used a SPAMM1331 sequence applied twice immediately after the ECG trigger, yielding a two-dimensional tag grid in the imaging plane. The tagging sequence was followed by gradient-echo cine sequence with the following imaging parameters: TR/TE,14.7 ms/3 ms; field-of-view, 6.5cm×6.5 cm; matrix size, 256×256; tagging resolution, 0.9 mm; slice thickness 1.5 mm. A total of 15 frames were acquired during one cardiac cycle. Following MRI studies, hearts were excised for histological analysis.
Images were analyzed with custom-designed software package developed in our laboratory. Epicardial and endocardial borders and intersecting tag points were traced interactively for all 15 frames. Subsequently, ventricular twist was computed relative to the center of ventricular cavity using 2D homogenous finite element analysis. Torsion was defined as the difference between twist angles at basal and apical levels normalized by the slice distance.
Results: As shown in , both the body weight and the heart weight of young and old rats were significantly different before and after infarction. However, there was no significant difference in the ratio of heart weight over body weight. The infarct ratios in young and old rats were similar (12.8±3.4% vs 14.8±5.0%, p=NS). In sham group, ejection fraction was 72.4±4.2% and 69.0±6.3% (young vs old, p=NS). Ejection fraction was also equivalent for young and old infarct rats (59.4±5.1% vs 57.1±6.5%, p=NS).
The overall torsion angles of young and old rats were equivalent in control group: 21.8±5.37° for young group and 22.4±3.67° for old group . The statistical equivalence of overall torsion angles was preserved after myocardial infarction: 17.3±5.38° for young and 16.4±3.66° for old. The decrease of overall torsion in infarct group was statistically significant for old rats (p<0.002). For segmental torsion after infarction, the greatest reduction occurred in the lateral region: 18.7±12.4° vs 26.4±5.82° for young, and 20.9±7.73° vs 36.6±4.22° (p<0.001) for old. Although not statistically significant, septum torsion increased slightly in infarct rats: 19.4±7.87° vs 16.9±5.81° for young and 13.0±4.22° vs 10.6±4.94° for old.
The time courses of segmental torsion were also similar in young and old rats. There was no significant difference between young and old rats in the peak time and the slope of the time curves.
Conclusion: Although regional heterogeneity exists in ventricular twist for both young and old animals (see , the overall magnitude of torsion was approximately equivalent before infarction. In the aging rats after small myocardial infarction, the overall torsion adaptations to myocardial infarction were similar to those of the young rats by 4 weeks after infarction. This result is consistent with Raya's findings that the long-term functional and structural adaptations to myocardial infarction were similar in young and old rats[1]. Our data might indicate that the old rats can overcome the cellular alterations associated with aging process and maintain the same contractile performance as the young ones even under small stress conditions.
Figure 1. Maximum torsion angle (*p<0.05 infarct vs control within age group).
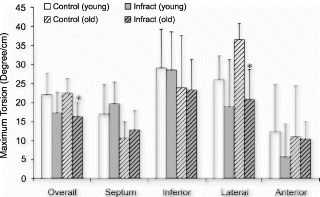
Figure 2. Time course of torsion angles during one cardiac cycle (Top: Control, Bottom: Infarct, Left: Young, Right: Old).
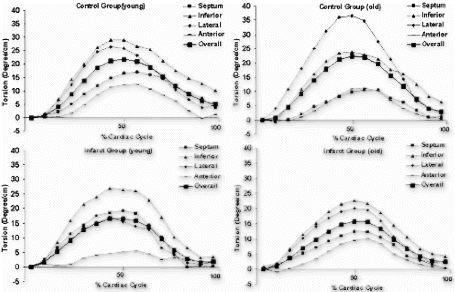
Table 1. Animal Characteristics
Reference
1. Raya T.E. et al, Am. J. Phyisol. 273: H2652–H2658 1997.
351. In Vivo Magnetic Resonance Microscopic Imaging Reveals Neonatal Cardiomyopathy in a Mouse Model with Hey2 Gene Knockout
Frank Wiesmann,1 Judith Rautenberg,1 Eberhard Rommel,2 Axel Haase,2 Stefan Neubauer,3 Manfred Gessler.4
Medizinische Klinik, Universitaet Wuerzburg, Germany, Physikalisches Institut, Universitaet Wuerzburg, Germany, Dept. of Cardiovascular Medicine, University of Oxford, United Kingdom, Institut fuer Physiologische Chemie, Universitaet Wuerzburg, Germany.
Introduction: The Hey2 gene is most strongly expressed during the development of cardiac ventricles and great arteries. It was hypothesized that Hey2 may be an important part of the “somitogenesis clock”. Mice with homozygous deletion of the Hey2 gene (Hey2 -/-) reveal a severe growth retardation in the neonatal period and frequently die within the first 10 days after birth.
Aim of this study was to use the potential of non-invasive MR microscopic imaging for early cardiac phenotype characterization in neonatal mice with Hey2 gene knockout.
Methods: We studied Hey2 -/- mice (n=9) at a mean age of 9±1days and a mean body weight of 6.2±1.0 g by in vivo MR microscopic imaging in comparison with age and weight matched heterozygous littermates (control, n=9). Experiments were performed on a 300 MHz Bruker system equipped with a microscopy gradient system allowing for max. field strength of 870 mT/m. Mice were anesthetized with inhalative Isoflurane (1.5 Vol% with 1L oxygen flow) via a nose cone and kept normothermic. For signal detection and transmission, a homebuilt 10 rung birdcage coil with inner diameter 16 mm was used. ECG-gated FLASH Cine MRI was performed with following parameters: TE 1.5 ms, TR 4.3 ms, FOV 20×20 mm2, in-plane resolution 78×78 μm2, slice thickness 500 μm.
Results: MRI in newborn Hey2 -/- mice revealed marked dilatation of the LV with a significant increase in both end-diastolic volume (EDV) and end-systolic volume (ESV; p<0.05 each; see Table ). Ejection fraction was significantly reduced in Hey2 -/- (39.6±5.2% vs. control 59.6±4.0%, p<0.01), indicating left ventricular dysfunction. Comparison of heart rate, stroke volume and cardiac output showed no significant differences between Hey2 -/- and control . There was a trend towards an increased LV mass in Hey2 -/- (52.9±7.4 mg vs. control 33.5±13.4 mg) but without reaching statistical significance.
Conclusion: This study demonstrates the feasibility of in vivo MR microscopic imaging to non-invasively detect morphologic changes and ventricular dysfunction in a mouse model of neonatal cardiomyopathy. Hence, in murine models with early phenotype or even premature death, MR microimaging allows insights into both the underlying deleterious structural and particularily functional consequences of the genetic defect.
Table 1. Phenotype characterization results
352. High Resolution Contrast-enhanced Dense Mri With Strain Analysis In Post-infarct Mice
Wesley D. Gilson, MS,1 Zequan Yang, MD, PhD,1 Brent A. French, PhD,2 Frederick H. Epstein, PhD.2
Department of Biomedical Engineering, University of Virginia, Charlottesville, VA, USA, Departments of Biomedical Engineering and Radiology, University of Virginia, Charlottesville, VA, USA.
Introduction: Transgenic and knockout mouse models can be used to study the roles of specific genes in the myocardial dysfunction that accompanies ischemic heart disease. MRI can play an important part in such studies because it is well suited for measuring in vivo myocardial function and detecting myocardial infarction (MI) in mice. We recently developed a novel MRI technique for post-infarct mouse heart imaging based on Displacement-Encoded imaging with Stimulated Echoes (DENSE) [1] after contrast agent infusion. This technique uses phase-contrast image reconstruction to measure myocardial motion and magnitude reconstruction of the same raw data to depict perfectly co-registered contrast-enhancement following MI [2].
Purpose: The purpose of this study was to evaluate regional myocardial function in a mouse model of acute MI using our contrast-enhanced DENSE sequence with strain analysis.
Methods: Mice: Five C57BL/6 mice were imaged at baseline and one day after a reperfused, 1 hour occlusion of the left anterior descending coronary artery. During imaging, mice were anesthetized using isoflurane (1% vol.), and circulating water was used to maintain body temperature at 37°. For day 1 imaging, Gadolinium (Gd) DTPA (0.3 mmol/kg) was administered by intraperitoneal injection prior to positioning the mouse in the magnet.
Imaging protocol: ECG-gated MRI was performed on a 4.7T scanner using a quadrature birdcage RF coil. The imaging protocol included: (a) localizer scanning to select a mid-ventricular short-axis slice of the left ventricle, (b) cine FLASH imaging, and (c) DENSE imaging of the selected slice. For day 1 imaging, additional heavily T1-weighted FLASH images (flip angle=60°) were acquired. Imaging parameters for DENSE were: FOV=30 mm, matrix=128×128, slice thickness=1 mm, flip angle=90°, TE=4.2 ms, TR=450 ms, number of averages=6, and displacement encoding strength=0.7 p/pixel. The DENSE images were acquired at end systole, and the time to end-systole was determined from the cine images.
T1-independent artifact suppression: In DENSE imaging, in addition to the displacement-encoded signal, another signal due to T1 relaxation occurs and causes artifacts if it is not suppressed [2]. Our DENSE pulse sequence used a complementary acquisition scheme, like CSPAMM tagging [3], to achieve T1-independent artifact suppression [4]. This approach differs from the heavily T1-dependent inversion recovery method for artifact suppression that was previously used for DENSE imaging [2]. T1-independent artifact suppression is required for contrast-enhanced imaging after MI, where a distribution of T1 values occurs in the heart.
Overall sequence structure for DENSE: The DENSE sequence was composed of (a) a 1-1 SPAMM displacement-encoding module applied immediately following the ECG trigger and (b) a gradient echo readout module that included a DENSE unencoding gradient which was played out at end systole. A complete DENSE data set consisted of 6 images—two complementary end-systolic DENSE images and a background phase-reference image for each orthogonal displacement-encoding direction. Encoding in orthogonal directions was achieved by swapping the phase-encode and frequency-encode directions, as all encoding was done along the frequency-encoding direction.
Displacement and Strain Computation: Image reconstruction was performed offline using MATLAB (The Mathworks, Inc., Natick, MA). For each displacement-encoding direction, complementary raw data sets were subtracted to achieve artifact suppression, and a 2D-IFT was performed to create complex subtraction images. The complex subtraction images were phase corrected using the appropriate phase reference image, and images representing displacement in each 1D direction were computed. Maps of 2D displacement were computed by vector addition of the two orthogonal 1D maps. From the 2D displacement data, the 2D strain tensor, E, was computed by isoparametric formulation using a quadrilateral element. Radial (Err) and circumferential (Ecc) strain were computed from the strain tensor. Additionally, magnitude-reconstructed images were created from the complex subtraction images which depicted the contrast-enhanced regions of myocardial infarction. Regions of interest (ROIs) were planimetered from the magnitude-reconstructed images to segment the enhanced and unenhanced myocardium. These regions were taken to be the infarcted and noninfarcted myocardium, respectively. Since the 2D strain maps were perfectly co-registered with the magnitude images, the ROIs were used to sort the strain data into infarcted and noninfarcted groups. One-way ANOVA was used to compare strain at baseline and in day 1 infarcted and noninfarcted myocardium. Strain values are reported as mean ± SD.
Results: Example DENSE magnitude images and displacement maps of one mouse at baseline and day 1 are shown in . The infarct region is depicted as a region of contrast enhancement in the day 1 magnitude image , which matched well with the contrast-enhanced T1-weighted FLASH image (not shown). Normal function is seen at baseline, and the large region of reduced function at day 1 corresponds with the area of contrast enhancement. provides summary Ecc and Err values at baseline and day 1 (infarcted and noninfarcted ROIs) for all 5 mice. The day 1 Ecc values demonstrate contractile dysfunction in noninfarcted myocardium, in agreement with previously published data in mice measured using myocardial tagging [5].
Conclusions: Contrast-enhanced DENSE provides high-resolution, perfectly co-registered images of contrast-enhancement and intramyocardial displacement and strain in post-MI mice. Contrast-enhanced DENSE in mice may prove useful for determining the roles of individual genes in the pathophysiology of cardiac dysfunction after MI.
Figure 1. Example end-systolic magnitude images for one mouse at (A) baseline and (C) day 1. Also shown are their corresponding displacement maps (B, D). The areas of contrast enhancement in (C) correspond well with regions of reduced displacement in (D).
Table 1. Average Ecc and Err values for baseline and day 1 mice
References
1. Aletras AH, et al. J Magn Reson. 1999;137:247-252.
2. Aletras AH, et al. Magn Reson Med. 2001; 46: 523-534.
3. Kuijer JPA, et al. Magn Reson Med. 2001; 46:993-999.
4. Gilson WD, et al. Proc ISMRM. 2002;1685.
5. Epstein FH, et al. Magn Reson Med. 2002; 48:399-403.
353. Exclusive Thrombus Visualization After Plaque Rupture Using a Novel Fibrin-Binding Gadolinium Based MR Contrast Agent
René M. Botnar, PhD,1 Alexandra S. Perez, BS,2 Sonia Witte, PhD,3 William Quist, MD,2 John Barett, PhD,3 Phil Graham, PhD,3 Robert M. Weisskoff, PhD,3 Michael T. Johnstone, MD.2 Warren J. Manning, MD2
Beth Israel Deaconess Medical Center, Philips Medical Systems, Boston, MA, USA,Beth Israel Deaconess Medical Center, Boston, MA, USA,EPIX Medical Inc, Cambridge, MA, USA.
Introduction: Plaque rupture with subsequent thrombosis has been recognized as being the underlying cause of acute coronary syndromes, myocardial infarction, stroke, and peripheral emboli. Thus, direct thrombus visualization in patients with acute coronary syndromes, myocardial infarction, atrial fibrillation or stroke would be beneficial for both diagnosis and guidance of therapy.
Purpose: We sought to evaluate a novel fibrin-binding MR contrast agent for in-vivo detection of thrombus in an atherosclerotic animal model.
Methods: Fifteen White New Zealand rabbits were made atherosclerotic and plaque rupture was induced using the modified Constantinides animal model with Russell's viper venom (RVV) and histamine. Following an 8 week high cholesterol diet, imaging of the sub renal aorta was performed using a fat suppressed 3D T1-weighted gradient echo sequence (TR=43 ms, TE=4.3 ms, flip angle=30°, FOV=60 mm, matrix=196×196, slice thickness=3 mm, spatial resolution=0.3×0.3×3 mm, slices=20, NSA=2). Superior and inferior saturation bands were applied for blood signal suppression. Immediately following the pharmacological trigger, imaging was performed pre and post injection (30 min–20 hours) of a prototype small-molecule clot enhancing MR contrast agent (EP-1873, 2 μmol/kg) composed of a fibrin-binding peptide derivative (EPIX Medical Inc, Cambridge, MA). Subsequently the animals were euthanized and histological analysis was performed.
Results: No thrombi were detected on the pre-triggering scans. Thrombus formation (25 thrombi) following plaque rupture was observed in 9 (60%) out of 15 animals and was readily depicted as a “hotspot” on the post contrast images with high contrast between thrombus, vessel wall, and blood . On the post (1 h) contrast images, contrast-to-noise between clot and blood and clot and muscle was (13+/−5; 9+/−5) and increased to (23+/−6; 17+/−8) as late as 20 h post injection.
Histological correlation confirmed all 25 thrombi (100%) with no thrombi seen in the other regions of the aorta. Average thrombus length was (14+/−11 mm; range=3–51 mm). Due to the high affinity of the contrast agent to fibrin, maximum intensity projections (MIPs) could be created without additional post processing steps and allowed clear depiction of focal thrombi in the sub renal aorta. On the pre contrast MIPs detection of thrombus was somehow difficult because of the low contrast between thrombus, wall, and lumen. Clots were visible immediately (∼30 min) after injection with excellent thrombus definition as late as 20 hours post injection of EP-1873.
Conclusions: We demonstrate the feasibility of molecular imaging for the detection of thrombus using a novel fibrin-binding MR contrast agent in-vivo. Potential applications include thrombus detection in patients with unstable angina, stroke and atrial fibrillation.
Figure 1. Coronal view (A) of the abdominal aorta post contrast reveiled three focal thrombi (arrows). Cross-sectional views of the caudal thrombus are shown pre (B) and post (C) injection of EP-1873 with corresponding histology (D).
354. Changes of Water Diffusivity in Rat Myocardial Infarction Quantified with Diffusion Tensor MRI (DTMRI) Allow Accurate Scar Imaging
Junjie Chen,1 Wei Liu,1 Sheng-Kwei Song,2 Jie Tan,1 Liz Lacy,1 Stacy Allen,1 Samuel A. Wickline,1 Xin Yu.1
Cardivascular MR Laboratories, Washington University, Saint Louis, MO, USA, Chemistry and Radiology, Washington University, Saint Louis, MO, USA.
Introduction: After myocardial infarction (MI), the left ventricule undergoes structural changes including myocyte necrosis, infarct expansion, and collagen deposition in scar tissue regions. Non-invasive serial visualization of infarct location and size could be useful for assessing the process of ventricular remodeling after MI, and to define the effects of drugs used to mitigate subsequent heart failure. Recent studies suggest that DTMRI offers a fast and nondestructive technique for assessing myofiber architecture by characterizing water diffusion in the myocardium[1,2].
Purpose: The purpose of this study is to explore the potential of DTMRI for detecting the location and extent of MI in remodeling rat hearts.
Methods: Subjects: Transmural infarction in anteroapical region was created in 12–24 month old Fischer 344 rats (280–360 g) by permanent occlusion of the left coronary artery descending (LAD) branch (n=7). Additional sham-infarct procedures (thoracotomy and pericardial incision) were performed in age-matched rats as the controls (n=7). Hearts were excised and perfusion fixed with 10% formalin four weeks after the surgery.
Diffusion Tensor Imaging: DTMRI of fixed hearts was performed on a Varian 4.7T scanner using a solenoid RF coil. A multi-slice spin-echo sequence with diffusion sensitizing bipolar gradient was used to acquire short-axis diffusion-weighted images. Imaging parameters were: TE, 45 msec; TR, 3.0 sec; δ_upper;, 20 msec; δ, 10 mesc; FOV, 2.0×2.0 cm2; slice thickness, 1.0 mm; number of averages, 4; diffusion gradient, G1=2 G/cm and G2=8 G/cm. Images were acquired with 128×128 data matrix and zero-filled to 256×256. These parameters yielded an in-plane resolution of 78×78 μm2 after zero filling. A total of 11 short-axis images covering the whole left ventricle were acquired.
Data Processing: The diffusion tensor matrix and the corresponding three eigenvalues were calculated from the 12 diffusion-weighted images. The trace map, i.e., sum of the three eigenvalues, was subsequently generated. The trace map was normalized to that of the surrounding solution to minimize the effect of diffusivity variations due to temperature fluctuation. The infarct location and size were defined as the zones with highest trace values, or >2 SD above the mean of the non-infarct remote region, according to the trace maps of the entire ventricle.
Histology: Following DTMRI study, hearts were sliced at 2 mm thickness from base to apex along the LV long axis to enable direct correlation of slice locations between MRI and histological analysis. Each slice was embedded in paraffin and sectioned at 4 μm. The tissue sections were stained with Masson's trichrome for the identification of infarct myocardium. Regions that failed to demonstrate red staining of cardiac myocytes were considered to represent infarcted myocardium. The infarct size and ratio determined from histology were correlated with corresponding results from DTMRI.
Statistical Analysis: All results were expressed as mean±SD. An unpaired student's t-test was used for intergroup comparison of the parametric variables. Correlations between DTMRI data and histological analysis were performed using the linear regression method. A 2-tailed value of p<0.05 was considered significant.
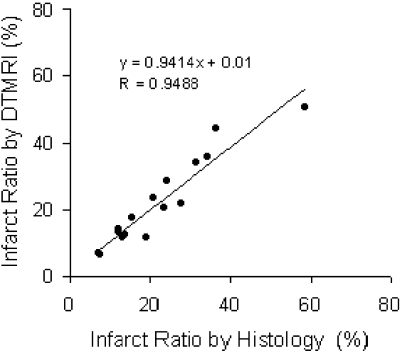
Results: All three eigenvalues increased in the scar tissue infarct zones, indicating increased magnitude of water diffusion. As the result, the infarct zone appeared brighter on the trace map . The location, size and shape of these high trace value regions were indentical to those of scar tissue as defined by Masson's trichrome stainning . No significant change in water diffusivity was observed in remote non-infarcted myocardium. High power images revealed increased extracellular space in the infarct zone due to cell death and subsequent scar formation .
The linear regression of infarct ratio by DTMRI and by histology was shown in Fig. . Normalized mean trace value was 1.43±0.06 in normal myocardium, 1.49±0.08 in remote zones of infarcted heart, and 2.02±0.21 in infarct zone (p<0.001 compared to normal). The primary, secondary, and tertiary eigenvalues, normalized by the mean eigenvalue of the surrounding water were 0.63±0.02, 0.45±0.03, and 0.35±0.05 respectively in normal myocardium; 0.66±0.03, 0.48±0.04, and 0.37±0.04 in remote zone of infarcted heart; 0.82±0.08, 0.68 ±0.09, and 0.56±0.08 in infarct zone (p<0.001 compared to normal).
Conclusion: The magnitude of water diffusion increased in infarcted zone of rat heart 4 weeks after infarction. Estimation of infarct size based on changes in water diffusion showed strong agreement with the infarct region determined from Masson's trichrome stainning. Histological examination also revealed increased extracellular space in infarct zone. This extracellular space could manifest less restriction on water diffusion, resulting in increased water diffusivity. This study demonstrates that DTMRI might provide an accurate estimate of scar tissue distribution and mass without the need for any exogenous contrast agent to localize specifically to the infarct site.
Reference
[1] Hsu EW, et. al., Am J Physiol 274: H1627–34, 1998
[2] Chen J, et. al, Proc. ISMRM, No. 507, 2002
Figure 1. a. Infarct zone revealed by Masson's trichrome stained slices (upper) and by short-axis trace maps (lower); b. High power view (200X) of Masson's trichrome stained non-infarct myocardium (left) and infarct zone (right)
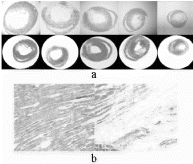
Figure 2. Correlation of myocardial infarct ratio defined by high trace value zones on trace map with that determined from corresponding Masson's trichrome stained slices (n=15).
355. Does Binding of Gd-DTPA to Myocardial Tissue Contribute to Late Enhancement in Acute Myocardial Infarction?
Ulrich K. M. Decking,1 Vinay M. Pai, PhD,2 Han Wen,2 Robert S. Balaban.2
Cardiovascular Physiology, Heinrich-Heine-University, Duesseldorf, Germany, Lab.Cardiac Energetics, National Institutes of Health, Bethesda, MD, USA.
Introduction: To localize and quantify the extent of myocardial infarction following reperfusion, hyperenhancement after infusion of Gd-DTPA has been successfully employed. In normal myocardium, following a Gd-bolus, enhancement in T1-weighted images is seen during the first-pass of the contrast agent and followed by a continuing fall in intensity thereafter. In previously ischemic myocardium, some areas show a rapid first-pass enhancement without any appreciable signal decrease within the following 15 min (delayed enhancement), others demonstrate hardly any first-pass enhancement but a slow build-up of signal, i.e. delayed enhancement, thereafter, and in a small fraction, both the initial and the delayed enhancement are missing. While the kinetics of Gd uptake and release is clearly dependent on local perfusion and distribution volumes, a detailed understanding of the kinetics of Gd uptake and retention is still lacking.
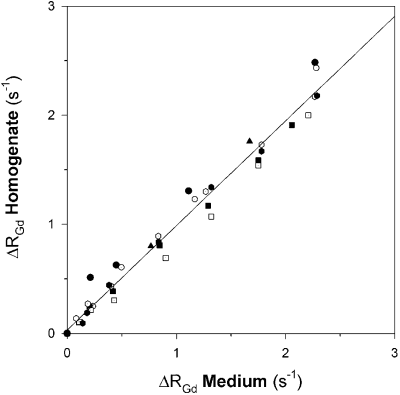
Purpose: To test the hypothesis that binding of Gd to intracellular constituents may be an additional factor contributing to the enhanced and longstanding contrast seen in vivo, equilibrium binding studies were conducted on porcine heart homogenates using relaxation as a measure of Gd-DTPA content.
Methods: An equilibrium dialysis system to detect binding was developed. Porcine left ventricular myocardium was homogenized to ensure exposure of the intracellular constituents to the extracellular milieu. Samples of 450 μL each were filled into dialysis tubing and placed into saline. Following equilibration, the samples (homogenate) were placed in tubes filled with 9 ml Gd-DTPA solutions ranging in concentration from 0.025 to 0.5 mM. In a Siemens Sonata 1.5T clinical scanner, the sample tubes were placed in the center of a head coil, and T1 data were obtained by the inversion-recovery technique. To follow the diffusion of Gd into the homogenate, we employed a turbo spin-echo sequence. Following equilibration of Gd, a standard spin-echo sequence (FOV 80×80 mm, TR 5 s, TE 10 ms, TI 40–4400 ms) gave T1 and the relaxivities of both the central homogenate and the surrounding medium. Thereafter, the homogenate was placed again in saline medium (9 ml each), and the diffusion of Gd out of the homogenates was followed, again using the turbo spin-echo sequence.
Results: When homogenate within dialysis tubing was placed in Gd-concentrations ranging from 0.025 to 0.5 mM, both signal intensity and 1/T1 (relaxation rate) increased near-exponentially with time. Signal intensity increased up to 6-fold reaching equilibrium within 4 hours, while relaxation rate increased from basal values of 0.59 s−1 to peak values of 2.6 s−1.
As expected, increasing concentrations of Gd induced a proportional increase in the relaxation rate of the surrounding medium (r2=0.995, slope 0.45 s−1/mM). Significant binding of Gd to the homogenate would have increased its relaxation rate to a greater extent than that of the surrounding medium. However, when comparing the rise in relaxation rate for medium and homogenate at different Gd-concentrations, it became apparent that the two relaxation rates correlated closely (r=0.979). The slope of the linear regression (0.96) was significantly less than that of the line of identity (p<0.001), ruling out the possibility that Gd may induce a greater change in homogenate than in medium relaxation rates .
When Gd-loaded homogenates within dialysis tubing were subsequently placed in saline tubes, Gd outflow resulted in a near exponential decrease of the Gd concentration within the homogenate. The time constant of the outflow (129±20 min) was slightly but significantly greater than that for the inflow (106±16 min). Even after 6 hours of Gd outflow, the relaxivity in the homogenate was still increased by 30% compared to basal conditions. Since binding of Gd would enable a greater amount of Gd being released from Gd-loaded homogenate into saline, we measured the increase in relaxation rate in the surrounding medium. This increase could be fully accounted for by the concentration of Gd in the homogenate contributing to the enhanced relaxation rate , (i.e. homogenate volume×[Gd]). Thus no substantial amount of Gd was bound. We cannot rule out, however, that a small fraction of Gd (<10%) is compartmentalized and does not contribute to relaxation. This fraction could be slowly released when the intracellular Gd concentration falls after a Gd-bolus injection.
Conclusions: These data clearly indicate that in myocardial homogenate the Gd-induced relaxation rate is proportional to the Gd-concentration and equals the Gd-induced relaxation rate in the surrounding medium. There is no Gd bound to myocardial cellular structures that contributes to signal enhancement in this acute myocardial infarction model.
Figure 1. Gd-induced changes in equilibrium relaxation rates (RGd) of myocardial homogenate and the surrounding medium. In a total of 61 samples, including controls, Gd-concentrations ranged from 0.025 to 0.5 mM. Symbols indicate the individual hearts.
356. Reduction of no Reflow Zone in Myocardial Infarction Using Intra-aortic Balloon Counterpulsation in a Randomized MRI Experimental Study
Luciano Amado, MD,1 Dara L. Kraitchman, VMD, PHD,1 Bernhard Gerber, MD,1 Ernesto Castillo, MD,1 Raymond C. Boston, PHD,2 Joseph Grayzel, MD,1 Joao A. C. Lima, MD, FACC.1
Johns Hopkins University, Baltimore, MD, USA,University of Pennsylvania, Philadelphia, PA, USA.
Introduction: Following reperfusion, microvascular obstruction as evidenced by “no reflow” (NR), impairs left ventricular (LV) remodeling regardless of the extent of myocardial infarction (MI). Among patients receiving thrombolytics for reperfusion therapy, those receiving simultaneous intra-aortic balloon counterpulsation (IABC) may have improved coronary artery patency, reduced rate of infarct-related artery reocclusion, and improved clinical outcomes, while the mechanism remains undefined.
Purpose:We hypothesized that IABC ameliorates microvascular obstruction, hence reduces the degree of NR, thereby decreasing the final MI size.
Methods: Seventeen dogs underwent 90 minutes of acute coronary artery occlusion followed by immediate reperfusion, at which point animals were randomized to receive 24 hours of IABC (n=9) or no therapy (controls, n=8). NR and infarct size were assessed both by first-pass and contrast-enhanced MRI, respectively, measured 1 h, 6 h, and 24 hour following the onset of reperfusion; these results were compared to measurement of NR with microspheres, and post-mortem myocardial TTC staining.
Results: Expressed as percentage of LV mass (mean±s.e.), NR was less in animals receiving IABC than in controls at 6 hours (2.6±0.8 v 3.5±0.5) and at 24 hour (3.6±1.5v 4.8±1.1), p<0.01. Measurement of NR by MRI and microspheres was highly correlated (r2=0.81; p=0.001). Although MI size increased over time in both experimental groups, the degree of infarct enlargement was less in animals receiving IABC than in controls (p<0.05).
Conclusions: The addition of IABC to reperfusion therapy reduces the extent of NR related to microvascular obstruction and reduces the growth of MI size.
357. Value of Nicorandil Therapy in Preventing Myocardial Hypertrophy and Preserving Viability: Quantitative MRI Study
Simon Schalla,1 Charles B. Higgins,1 Mitsuaki Chujo,2 Maythem Saeed.1
Radiology, University of California San Francisco, San Francisco, CA, USA, Chugai Pharmaceutical Co., Ltd, Tokyo, Japan.
Introduction: Cardiac hypertrophy is an increase in size and mass of the heart that ultimately leads to congestive heart failure, myocardial infarction, sudden death and other cardiovascular morbidity and mortality. The coronary reserve is reduced in hypertrophied hearts due to a decrease in the density of coronary arteriols leading to increased vascular resistance and decreased vasodilator response to exogenous and endogenous stimuli. This has been shown to result in a greater shift towards anaerobic metabolism during brief periods of ischemia.
Regression of LV hypertrophy has been demonstrated in hypertensive patients treated with therapies, such as beta-blockers, calcium antagonists, ACE inhibitors or diuretics. Nicorandil, an ATP-sensitive potassium channel opener and vasodilator, has been shown to reduce ischemic injury and prevent LV remodelling in non-hypertrophied hearts. However, the effect of nicorandil on preventing the progression of LV hypertrophy has not been demonstrated yet.
The newly developed necrosis specific MR contrast media represented by Gadophrin II and III have been successfully used for quantitative assessment of acutely infracted myocardium and for predicting LV remodelling. Necrosis specific contrast media have a high specificity to necrotic tissue and provide persistent enhancement.
Purpose: The aims of the study were to 1) determine the effect of oral nicorandil therapy on preventing LV hypertrophy in rats subjected to aortic stenosis, 2) determine the size of infarction in untreated and nicorandil treated rats subjected to aortic banding in comparison with control animals not subjected to aortic stenosis, 3) determine the effect of nicorandil treatment on LV function.
Methods: Experimental Protocol: A total of 30 rats were studied. Twenty rats were subjected to aortic banding to induce left ventricular hypertrophy (110–120 g). These animals were ascribed to 2 groups: untreated hypertrophy group (n=10) and nicorandil treated group (n=10). A third group of matched body weight rats (n=10) without aortic banding was used as a control. Over a period of 8 weeks the untreated hypertrophy and control group received tap water whereas the treated group received nicorandil in drinking water (3 mg/kg/day). After 8 weeks, all animals were subjected to 25 min of myocardial ischemia by occluding the large branch of the main left coronary artery followed by 3 hours reperfusion. At the beginning of reperfusion, the necrosis-specific agent Gadophrin III (Schering AG, Berlin, Germany) was intravenously injected (0.05 mmol/kg) to delineate infarcted myocardium.
MRI: Three hours after the injection of Gadophrin III, multislice T1-weighted spin echo images were acquired to define the infarcted regions in the entire hearts. A 2.0T CSI-II-system (Bruker Instruments, Fremont, CA) was used for image acquisition (slice thickness=2 mm, FOV=5×5 cm, TR=30 ms, TE=12 ms, matrix=256×128). End-systolic and -diastolic images were obtained to determine the effect of ischemia/reperfusion and therapy on LV volumes and regional wall thickness in all groups. Structural changes were assessed using necrosis specific MR contrast medium Gadophrin-III to measure infarction size.
Hemodynamic and postmortem measurements: A catheter was introduced via the right carotid artery into LV chamber. The catheter was used to measure heart rate, aortic and LV pressures,±dP/dt and phasic arterial pressures. All hemodynamic parameters were recorded on a 6 channels speed chart paper using pressure transducer and dP/dt differentiator.
After MR imaging, the left coronary artery was re-occluded and 0.7 ml of phthalocyanine blue dye was intravenously injected to define the area at risk. The LV was transversely sliced into 4–6 slices; each of 2 mm thickness corresponding to the MR images. All slices were then incubated in 2% triphenyl-tetrazolium-chloride solution to define necrotic myocardium. At postmortem, LV mass was determined in all animals.
Results: LV Mass: Oral nicorandil therapy for 8 weeks prevented the development of heart hypertrophy despite aortic banding. LV mass/body weight ratio of nicorandil treated animals (2.40±0.07 mg/g on MRI and 2.40±0.07 mg/g postmortem) was comparable to control animals (2.55±0.08 mg/g on MRI and 2.54±0.08 mg/g postmortem). Untreated hypertrophied hearts (3.28±0.03 mg/g on MRI and 3.35±0.06 mg/g postmortem) showed greater LV mass than the control (p=0.001) and treated groups (p=0.001).
Myocardial Infarction Size: The size of infarction was similar in nicorandil treated (9±1% LV area) and control animals (10±2% LV area, p=0.74), but was significantly larger in untreated hypertrophied hearts (19±1% LV area, p=0.001) . These findings suggest that hypertrophied hearts have less tolerance to ischemia compared with non-hypertrophied hearts. Nicorandil reduced the size of infarction by 2 possible mechanisms: Preventing the formation of hypertrophy and preconditioning the myocardium to ischemia. Results of Gadophrin III enhanced areas were similar to histochemical staining (9±1% of LV area in nicorandil treated, 9±2% in control and 18.±2% in untreated hypertrophied hearts). The size of area at risk for infarction did not differ between the 3 groups: 37±1% of LV in nicorandil treated, 37±2% in control (p=0.82) and 39±2% of LV in untreated hypertrophied hearts (p=0.30).
LV Function: LV ejection fraction of nicorandil-treated group (47±3%) was also comparable to control group (49±2%). On the other hand the ejection fraction of untreated hypertrophied hearts was substantially lower (39±4%). The end-diastolic volumes were 1.64±0,12 ml for nicorandil treated animals, 1.64±0,08 ml for control group (p=0.99) and 2.09±0.17 ml for untreated hypertrophy group (p=0.04). The data suggest that LV dilatation was the greatest in untreated animals with hypertrophy after ischemia/reperfusion. Regional wall thickening was similar for the 3 groups (infarcted region: 4±1% in nicorandil-treated, 4±1% in control and 7±3% in untreated hypertrophy group; remote region: 33±1% in nicorandil-treated, 35±2% in control and 32±3% in untreated hypertrophy group).
Hemodynamic Measurements: Aortic systolic/ diastolic blood pressures were 137±14/73±11mmHg and left ventricular systolic, early- and end-diastolic pressures were 131±22/1±1/6±2mmHg for nicorandil treated animals. The values for untreated hypertrophy group were 100±10/74±10 and 102±9/0±1/9±3mmHg, and for control animals 114±3/70±7 and 118±2/0±1/5±1mmHg. The lower pressures in untreated hypertrophy group may be attributed to the larger infarction size. Positive and negative LV dP/dt was higher in nicorandil treated animals (+12500±3663/−10000±3189mmHg) than in untreated hypertrophied (+8000±1013/−8000±1013mmHg) and control animals (+10167±4604/−5833±2315mmHg).
Conclusions: The study results suggest that 1) long-term oral treatment with nicorandil prevents the progression of LV hypertrophy, 2) nicorandil improves myocardial function in rats with aortic banding possibly by interfering with potassium channels and subcellular remodelling associated with pressure overload, 3) the new necrosis specific agent Gadophrin III allows accurate measurements of infarction size in hypertrophied and non-hypertrophied hearts. MRI demonstrates the value of a new class of therapy in preventing myocardial hypertrophy.
Figure 1. Gadophrin III enhanced multislice short axis views after 25 min coronary occlusion and 3 h reperfusion: The control group (top row) shows similar infarction size as nicorandil treated animals with aortic banding (middle row). The size of infarction was larger in untreated animals subjected to aortic banding (bottom row).
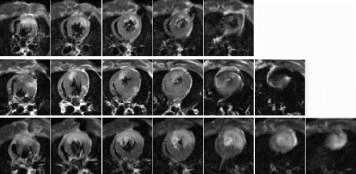
358. Real-Time Magnetic Resonance Imaging-Guided Coronary Catheterization in Swine
Reed A. Omary, MD, MS, Jordin D. Green, MS, Brian Schirf, MD, Richard Tang, MD, Yongzhong Li, MD, James Carr, MD, J. Paul Finn, MD, Debiao Li, PhD.
Radiology, Northwestern University, Chicago, IL, USA.
Introduction: The limited spatial and temporal resolution for magnetic resonance imaging (MRI)-guided device tracking has hindered coronary applications. Previous efforts at MRI-guided coronary artery catheterization in animals have used a surgical carotid artery approach, which is clinically impractical for use in humans. If methods for reproducible MRI-guided coronary catheterization from a percutaneous femoral artery approach can be developed, then this guidance technique would be more relevant for future clinical coronary procedures.
Purpose: We tested the hypothesis that MRI can guide real-time coronary artery catheterization in swine using a percutaneous femoral artery approach.
Methods: In 11 healthy swine (22–35 kg), we percutaneously accessed the common femoral arteries under ultrasound guidance. Animals were then transferred to a 1.5 T MRI scanner (Siemens Sonata, Erlangen, Germany). We used 6- or 7-French Judkins left coronary catheters (Cook, Bloomington, IN) and coaxially inserted active guidewires (Intercept, Surgi-Vision, Gaithersburg, MD) as endovascular devices. The catheter was filled with 4% gadolinium (Gd)-based contrast agent (Prohance, Bracco). Prior to device insertion, we defined three different anatomic locations for device tracking: a) thoracic aorta; b) aortic arch; and c) left coronary ostium. In each of these anatomic locations, we tracked the catheter using a two-dimensional (2D) inversion recovery (IR)-prepared Fast Low Angle Shot (FLASH) gradient echo sequence. For direct guidewire visualization, we used 2D fast imaging with steady-state precession (TrueFISP). Vascular roadmaps and coronary MRA were obtained with catheter-based intraarterial injections of dilute Gd contrast agent.
Results: We successfully catheterized the left main coronary artery using real-time MRI guidance in 11/11 pigs (100%). IR-FLASH depicted the Gd-filled catheter as bright signal. TrueFISP directly depicted the active guidewire as negative susceptibility artifact, surrounded by bright signal from the adjacent tissues. The catheter and guidewire could be independently tracked in real-time at temporal resolutions of 7 (catheter) to 10 frames/s (guidewire). Successful coronary catheterization was verified using direct catheter-based injections of dilute Gd.
Conclusions: MRI-guided catheterization of coronary arteries in swine is feasible in real-time. Selective coronary MRA can then be performed with catheter-based injections of dilute contrast agent.
359. In Vivo Visualization Of Passive And Active Intravascular Devices Using Real-time Truefisp Mri
Walter J. Rogers, PhD,1 Joshua J. Fischer, MD,2 Joon C. Choi, MD, PhD,2 Frederick H. Epstein, PhD,3 Szilard Voros, MD,2 John Christopher,4 Daniel K. Bennett,4 Ian J. Sarembock, MB, ChB, MD.2
Radiology and Internal Medicine, University of Virginia, Charlottesville, VA, USA,Internal Medicine, University of Virginia, Charlottesville, VA, USA,Radiology and Biomedical Engineering, University of Virginia, Charlottesville, VA, USA,University of Virginia, Charlottesville, VA, USA.
Introduction: Interventional magnetic resonance imaging (iMRI) for the purpose of performing coronary artery therapy has the potential to provide additional information on myocardial perfusion, function, viability and vessel wall imaging compared to x-ray angiography. Such procedures require the development of MR compatible devices including guide wires, guiding catheters, angioplasty balloons and imaging catheters that can be seen clearly during real-time image acquisition.
Purpose: The purpose of this study was to quantify the contrast-to-noise ratio (CNR) of active and passive devices in domestic swine and a vascular phantom to determine the effect of material selection on device visibility.
Methods: Tested passive devices included composite guide wires (0.035 in), 8F composite guiding catheters and a 3 mm×20 mm angioplasty balloon. All were equipped with multiple dysprosium (Dy2O3) marker bands at the distal tip. The active device was a 5F opposed solenoid mounted to a composite catheter body and interfaced to a separate receiver channel. The raw data was scaled, prior to combining with the external surface array coil, to provide optimal signal intensity. Imaging was performed on a Siemens Sonata 1.5T clinical images using a phased array surface receiver coil and real-time TrueFisp sequence with TR=2.6 ms, TE=1.3 ms, 79×128 matrix, 300×300 mm FOV and 5 mm a slice thickness. Thus images were acquired at a rate of about 5 frames per second. In vivo images were acquired after MR-guided positioning of the device in the aortic root immediately adjacent to the right coronary ostium. .
In vitro images were acquired in a coronal orientation in phantom filled with Gd-DTPA diluted to 20% of stock solution with saline.
Analysis: CNR comparing surrounding aortic blood signal to signal within the device was calculated as (Abs(Signalblood−Signaldevice))/σSignalblood. For phantom images, signal from surrounding Gd-DTPA-saline solution was used for CNR calculation. Images were analyzed offline using Siemens Argus analysis software.
Results: compares CNR values for in vivo and in vitro images.
The active coil provided the highest CNR even in the presence of a bright blood sequence. Dy2O3 markers provided substantially better CNR compared with that produced by the composite body alone. Inflating the balloon with a Gd-DTPA saline solution produced a significant CNR. However, solutions above 20% resulted in excessive “blooming” of the artifact volume due to susceptibility effects.
Conclusions: High contrast, bright blood real-time sequences such as TrueFisp provide a good background signal for the use of passive devices containing Dy2O3 markers. Use of limited amounts of this paramagnetic agent, positioned at the distal portion of the device, enhance visualization. Active coils provide strong CNR with the advantage that the intensity of the signal enhancement may be altered to fit the application. Thus, active and passive devices free from ferrous material can be well visualized during iMRI.
Figure 1. real-time TrueFisp of 8F passive guiding catheter in aortic root. Arrows indicate location of catheter.
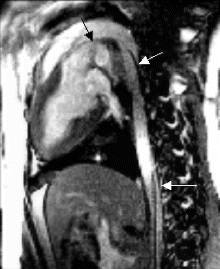
Figure 2. real-time TrueFisp of 5F active imaging catheter (arrow points to coil).
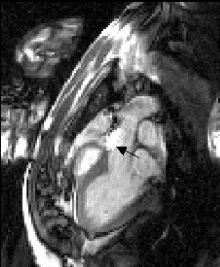
Table 1. CNR for each device
360. Stereotactic Intracardiac Catheter Guidance with Three-Dimensional MRI in Real-Time
Timm Dickfeld, Stephen Solomon, Muz Zviman, Ritsushi Kato, Glenn Meininger, Lars Lickfett, Ron Berger, Henry Halperin, Hugh Calkins
Johns Hopkins University, Baltimore, MD, USA.
Introduction: Radiofrequency ablation (RFA) is becoming the standard of care in the treatment of many cardiac arrhythmias. Ablation targets for ablation of atrial fibrillation, atrial flutter, and non-idiopathic ventricular tachycardia are increasingly being selected based on anatomic considerations. Because fluoroscopy provides only limited information about the relationship between catheter positions and cardiac structures, and is associated with radiation risk, other approaches to mapping may be beneficial.
Purpose: Our purpose was to apply the concept of stereotactic catheter guidance to the field of electrophysiology and to perform intracardiac real-time catheter navigation guided by the anatomic detail of MRI.
Methods: Three-dimensional cardiac-gated MRI of the chest was acquired in six swine and was superimposed with the electromagnetic space of a catheter tip position sensing system (Magellan, Biosense) using fiducial markers. Position and orientation of a 6 French catheter with electromagnetic sensor was displayed in real-time on corresponding 3D-MR images. Catheter navigation within the heart and the great vessels was attempted guided by detailed knowledge about catheter location in relation to cardiac anatomy.
Results: Anatomic structures including the intraatrial septum, pulmonary veins, and valvular apparatus were easily identified and used to direct catheter navigation. During the right heart examination, the catheter was navigated through the superior and inferior caval vein to prespecified anatomic locations in right atrium, right ventricle and pulmonary artery. The ablation catheter was also navigated successfully from the aorta through the aortic valve in the left ventricle. Catheter placement in carotid artery and brachiocephalic trunk was easily detectable. No complication was encountered during the experiments. The accuracy and precision of this novel approach to mapping was 2.74±1.36 mm and 1.97±1.12 mm, respectively.
Conclusions: Real-time display of catheter position and orientation on 3D-MRI scans allows accurate and precise catheter navigation in the heart. The detailed anatomic information may improve anatomically based procedures like pulmonary vein ablation and has the potential to decrease radiation times.
361. MRI Myocardial Tagging and Strain Mapping with High Temporal Resolution: Regional Differences in Time to Onset of Relaxation
Jaco J. M. Zwanenburg,1 J T. Marcus,1 Joost P. A. Kuijer,1 Marco J. W. Götte,2 Albert C. Van Rossum,2 Robert M. Heethaar.1
Physics and Medical Technology, VU University Medical Center, Amsterdam, Netherlands, Cardiology, VU University Medical Center, Amsterdam, Netherlands.
Introduction: The time to onset of regional relaxation (Trel) has been introduced as a new indicator for myocardial function. It has been shown that relative changes in Trel identify ischemic regions during dobutamine stress echocardiography [1]. In case of intraventricular conduction delays, Trel may be useful as well, since the onset of relaxation is probably related to the onset of contraction, but easier to assess. Until now, Trel in healthy volunteers is measured only by ultrasound strain rate imaging, and not verified using a different modality.
Purpose: This work intended to assess the time to onset of regional relaxation in healthy volunteers, using MRI myocardial tagging and strain mapping with a high temporal resolution.
Methods: MR imaging was performed on a 1.5 T Siemens Sonata whole body scanner, with a 4-element phased-array receiver coil. Short axis images at a mid-ventricular level were acquired in 6 volunteers. Steady state free precession (SSFP) imaging was used in combination with myocardial tagging [2] to obtain tagged images with a high temporal resolution of 14 ms. The imaging parameters were as follows: flip angle=20 deg, TE/TR=2.34/4.68 ms, matrix 80×256 (phase encoding×readout), 3 ky/beat, slice thickness 6 mm, and FOV 300×300 mm. The acquisition was performed using short multiple expiration breath holds to avoid motion artifacts. The short expiration breath holds lasted 4 heart beats, and were separated by a 6 s break to inhale and exhale. Complementary tagged (CSPAMM) images were used for optimal strain results [3].
Strain maps were calculated from the CSPAMM images using the harmonic phase (HARP) method [4]. The maximum shortening map was used to assess Trel, since the maximum shortening is parallel to the fiber direction in the midwall and provides thus a measure of fiber shortening [5]. Trel was measured as the time delay at which the peak systolic strain was reached after the ECG-R wave.
Results: Figure shows the strain curves of a volunteer for 6 different regions of the myocardium. There is a striking delay in onset of relaxation for the postero-lateral region, although there is no evident difference in onset of contraction between the regions. The average Trel for each region is presented in Figure . A detailed comparison between opposite regions is given in Table , and shows that the difference of about 100 ms between the postero-lateral region and the antero-septal region is significant (p<0.001).
Conclusion: MRI tagging and strain mapping with high temporal resolution shows regional differences in the time to onset of relaxation, which amount up to 100 ms in the healthy heart. Documentation of these differences in healthy subjects is required before Trel can be used to identify conduction delays.
Figure 1. Curves of the maximum shortening at the midwall for a healthy volunteer, for 6 circumferential regions: IS (infero-septal), AS (antero-septal), ANT (anterior), AL (antero-lateral), PL (postero-lateral), and INF (inferior).
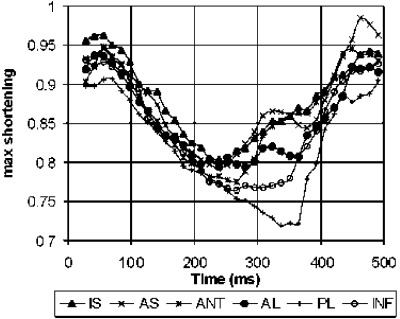
Figure 2. Average time to onset of relaxation Trel (in ms) for 6 regions of the myocardium. The arrow indicates the maximum difference in Trel between opposite regions. The regions are defined in Figure 1.
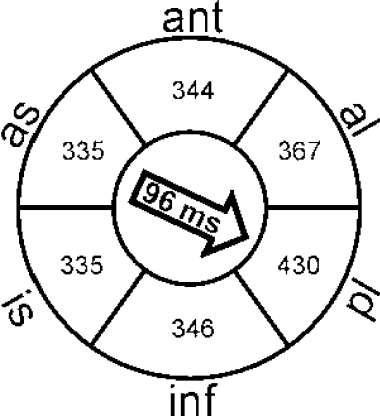
Table 1. Difference in Trel (in ms) between opposite regions. The regions are as in Figure 1. (Vol=volunteer.)
Acknowledgment
This work was supported by the Netherlands Heart Foundation grant 2000B220.
References
1. Abraham TP, Belohlavek M, et al. J Am Coll Cardiol 2002;39:1531–1537.
2. Zwanenburg JJM, Marcus JT, et al. Proc 10th Annual Meeting ISMRM: 2002. p. 2353.
3. Kuijer JPA, Jansen E, et al. Magn Reson Med 2001;46:993–999.
4. Osman NF, Prince JL. Proc SPIE Med Imag Conf. San Diego: 1998. p. 142–152.
5. Wyman BT, Hunter WC, et al. Am J Physiol 1999;276:H881–H891
362. Navigator 3D Coronary MRA with a Blood Pool Agent : Improved Image Quality with Data Acquisition During First-Pass
Martijn S. Dirksen, MD,1 Theodorus A. M. Kaandorp, MD,1 Hildo J. Lamb, PhD,1 Claire Corot, PhD,2 Albert de Roos, MD.1
Radiology, Leiden University Medical Center, Leiden, Netherlands,Guerbet Research, Aulnay Sous Bois, France.
Introduction: Blood pool agents (BPA) are able to improve the image quality of coronary MRA. From experiments with conventional contrast media, it is well known that the first-pass effects of the contrast bolus improves the image quality of breath-hold acquisitions especially when central k-lines are obtained in the early phase of data acquisition The value added by using first-pass effects has barely been subject of research for acquisitions that require several minutes of acquisition time, such as navigator coronary MRA.
Purpose: To evaluate the first-pass effects of a blood pool agent on the image quality of 3D navigator coronary MRA.
Methods: A pig model was used to perform: (1) a T1 simulation during the first-pass of the BPA and (2) 3D navigator coronary MRA using different time delays between BPA injection and onset of data-acquisition. The first acquisition started 1 minute after bolus administration (steady-state acquisition). The second acquisition started during the first-pass passage of the BPA (first-pass acquisition). A monogadolinated, macromolecular blood pool agent was used (Vistarem®, Guerbet, Aulnay Sous Bois, France). Gradient echo acquisitions with centric k-space sampling were applied. Comparison of both acquisitions was based on contrast-to-noise, signal-to-noise and vessel length.
Results: T1 simulation shows T1 reduction during first-pass below 50 msec, increasing to 190 msec during steady-state . Images obtained during first-pass showed improved contrast-to-noise ratio (8.6±1.7 vs. 4.5±1.8), signal-to-noise ratio (11.9±1.6 vs. 7.4±2.0), and vessel length (99.2±10.9 mm vs. 60.5±21.8 mm) as compared to steady-state (all: P<0.05) (see Figure ).
Conclusions: The image quality of 3D navigator coronary MRA combined with a gadolinium blood pool agent is optimized when images are obtained with inclusion of the first-pass of the blood pool agent.
Figure 1. Simulated T1 characteristics of arterial blood after P792 injection. The dotted line shows the actual P792 blood levels (see X-markings) as determined by blood sampling and atomic emission spectrophotometry. The solid line shows the corresponding T1 lapse. During the first-pass, the T1 time reduces to a level below 50 msec and recovers to a steady-state of approximately 190 msec.
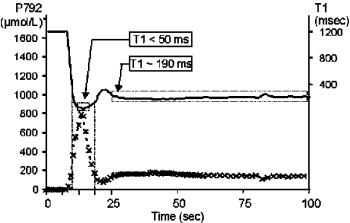
Figure 2. Acquired images for the applied acquisition protocols to illustrate the study results. Upper row: steady-state acquisition protocol; 5 out of a stack of 20 slices. The acquisition was started 1 minute following bolus injection. Lower row; first-pass acquisition protocol; 5 out of 20 slices. The acquisition was started 8.5 seconds following bolus administration. Note the improved contrast of the coronary artery and the perivascular tissues of the images acquired during first-pass.
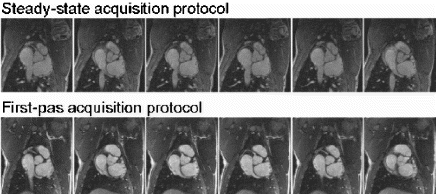
363. Regional Heterogeneity of Torsion of the Left Ventricle in the Human Heart
Han Wen
NHLBI, National Institutes of Health, Bethesda, MD, USA.
Introduction: This study characterizes regional heterogeneities of left ventricular (LV) torsion in the human heart. In normal subjects, the three-dimensional (3D) displacement field of the LV wall is measured with phase-contrast displacement encoding with stimulated-echo acquisition(3D-DENSE) (1). The parameters of torsion and twist are obtained at sufficient resolution to allow observation of changes in the longitudinal, circumferential and transmural directions.
Method: In eight normal volunteers (4 M, 4F, age 24–45), the systolic displacement field of the LV wall was mapped at 2×3×8 mm3 resolution in five slices. These slices covered 80% of the length of the LV at endsystole. For each slice, bulk translational motion is corrected to account for the shift of the LV center during systole. Care was taken to exclude endocardial trabeculae layers. Each slice is segmented into septal, inferior, lateral and anterior segments circumferentially. Following Arts et al(2) and Beyar et al(3), LV twist is defined as β=Δα/Δh, where α is the rotation angle about the long axis and h is the longitudinal distance from the apex; LV torsion is defined as γ=r(Δα/Δh)cosθ where r is the in-plane radius and θ is the taper angle of the wall relative to the long axis. Torsion is mechanically more relevant since it is directly related to sarcomere length changes. These values are obtained at four transverse levels from the apex to the base. Sub-endocardial and sub-epicardial values are measured to observe transmural changes, in addition to longitudinal and circumferential changes. Six data sets were obtained for each volunteer to ensure intra-subject consistency.
Results: Longitudinal variations: longitudinal position is represented as the distance from the apex in fractions of the LV length. Epicardial twist increases by 153% from the 80% basal level to the 20% apical level, while endocardial twist is only significantly higher at the 20% apical level . Both epicardial and endocardial torsion remain relatively constant from the 20% apical position to the 60% mid-base. From 60% level to 80% basal position, endocardial torsion increased significantly by 28%, while epicardial torsion decreased significantly by 49% .
Circumferential variations: statistically significant circumferential variations were only seen in sub-endocardial torsion and twist at the mid ventricular level. These values are lower in the lateral segment than the rest .
Transmural variations: Twist is generally higher on the endocardial surface then on the epicardial surface , and the difference is the greater near the base and the apex. Torsion is relatively uniform over 60% of the LV length from the apex to the mid-base. At the 80% basal level, a more than two fold difference exists between endo and epicardial torsion, accompanied by large longitudinal changes .
Conclusions: While twist varies regionally, the more relevant torsion parameter is relatively uniform from the apex to the mid-basal level. From mid-base to the base of the LV, torsion in the endocardial and epicardial layers significantly diverge. This data suggest that the connection between endo and epicardial fibers at the base of the LV may have a significant role in the transmission of torsion from the epicardial layers to the endocardial layers.
Figure 1. Twist
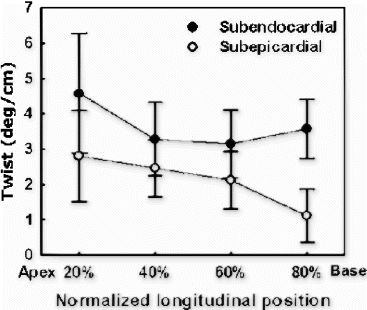
Figure 2. Torsion
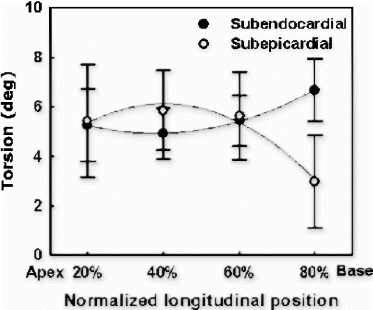
Figure 3. Twist at 40% level
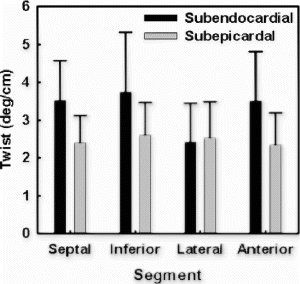
Figure 4. Torsion at 40% level
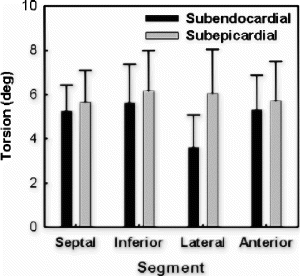
References
1. H. Wen, E. Bennett, V.M. Pai, J. Card. Magn. Reson. 4(1): 7–8, 2002.
2. R. Bayer, F.C.P. Yin, M. Hausknecht, M.L. Weisfeldt, D.A. Kass, Am. J. Physiol. 257: H1119–H1126, 1989.
3. T. Arts, S. Meerbaum, R.S. Reneman, and E. Corday, Card. Res. 18: 183–193, 1984.
364. Role of ATP-Sensitive Potassium Channel in the Preconditioning of Hypertrophied Myocardium to Ischemia: Quantitative MRI Study Using Necrosis Specific Contrast Agent
Simon Schalla, MD,1 Charles B. Higgins, MD,1 Mitsuaki Chujo, MD,2 Maythem Saeed, DVM, PhD.1
Radiology, University of California San Francisco, San Francisco, CA, USA, Chugai Pharmaceutical Co., Ltd, Tokyo, Japan.
Introduction: Brief episodes of ischemia followed by reperfusion (“ischemic preconditioning”) or mitochondrial potassium channel activation (pharmacologic preconditioning) renders hearts resistant to irreversible damage, stunning and arrhythmia during subsequent prolonged ischemic insult. Ischemic myocardial preconditioning is a phenomenon with multiple pathways that appear to be responsible for cardioprotection. The mechanistic paradigm for preconditioning against infarction invokes roles for several freely diffusible molecules such as adenosine, nitric oxide, reactive oxygen species and bradykinin. More recent studies in non-hypertrophied hearts have indicated that activation of ATP-sensitive potassium channels (K-ATP) serves as a protective pharmacologic mechanism. However, these freely diffusible molecules, their receptors and potassium channels are altered in hypertrophied hearts. Thus, it is conceivable that the preconditioning process is attenuated or even absent in hypertrophied hearts.
Purpose: Aim of this study was to assess the effects of intravenously injected ATP-sensitive potassium channel opener and vasodilator nicorandil on hypertrophied hearts subjected to ischemia/reperfusion using MRI and postmortem histochemical staining. The effects of nicorandil on LV volumes, wall thickness and infarction size were studied.
Methods: ECG-triggered T1-weighted spin echo short axis images covering the whole heart were acquired at end-diastole and end-systole. A CSI-II-2.0T scanner (Bruker Instruments, Fremont, CA) was used in the current study. The imaging parameters were: slice thickness 2 mm, field of view 5×5 cm, TR 30 ms, TE 12 ms, and image matrix 256×128. Rats (n=14) were subjected to abdominal aortic banding for 8 weeks to induce LV hypertrophy. Before MR imaging, the left coronary artery was occluded for 25 min followed by 3 hours of reperfusion in all animals. After 15 min of the occlusion, intravenous infusion of nicorandil was started (bolus of 0.1 mg/kg followed by 1.5 mg/kg/min for 3 hours) in 7 rats with hypertrophied hearts while the remaining 7 rats received no treatment. Immediately after reperfusion 0.05 mmol/kg Gadophrin III (Schering AG, Berlin, Germany) was intravenously injected in all animals. The size of the infarction, LV volumes and wall-thickness were determined with MRI 3 hours after Gadophrin III injection. At the conclusion of the imaging protocol, the left coronary artery was again occluded and phthalocyanine blue dye was intravenously injected to define the area at risk. The LV was then transversely sliced into 2 mm thick sections corresponding to the MR images and incubated in 2% triphenyl-tetrazolium-chloride solution to define necrotic myocardium.
Results: LV Function: Measurements of regional wall thickening revealed no significant difference between untreated (32±4% in remote and 6±4% in infarcted region) and treated animals (remote 35±2% and 4±2% infarcted region). Untreated hypertrophied hearts, however, showed lower ejection fraction (36±4%) compared to treated hypertrophied hearts (51±5%, p=0.01). Nicorandil improved the ejection fraction of hypertrophied hearts. Furthermore, nicorandil reduced the dilatation of LV associated with infarction. This reduction was observed in the reduction of end diastolic volume (1.81±0.14 ml) in treated hypertrophied hearts versus untreated hypertrophied hearts (2.11±0.22 ml, p=0.01).
Myocardial Infarction Size: The size of infarction was significantly larger in hypertrophied untreated hearts (19±2% LV) than nicorandil treated hearts (8±3% LV, p=0.01) . There was no significant difference in the size of infarction seen on MRI and that on histochemical staining. The differences in the size of infarction measured between the two groups can not be attributed to differences in the size of areas at risk of infarction, because there was no significant difference in areas at risk (non-treated hypertrophied hearts: 40±2%; nicorandil treated hypertrophied hearts: 37±4% LV).
Conclusions: Treatment with nicorandil pharmacologically preconditioned hypertrophied hearts to ischemia resulting in a reduction of infarction size. MRI has the potential to quantitatively assess the effect of ATP-sensitive potassium channel opener on the structure and function of hypertrophied hearts. It shows the value of a new class of drug therapy in preserving viability in hypertrophied hearts. The demonstration of a “window of opportunity” in providing preconditioning by ATP-sensitive potassium channel opener provides new directions in investigating mechanisms underlying cardiac hypertrophy.
Figure 1. Gadophrin III-enhanced multislice short axis views of hypertrophied hearts subjected to 25 min ischemia and 3 h reperfusion. Top row: Hypertrophied hearts without treatment. Bottom row: Hypertrophied heart with infusion of Nicorandil after 15 min of occlusion for 3 hours. Note the difference in infarction size after nicorandil treatment of hypertrophied hearts.
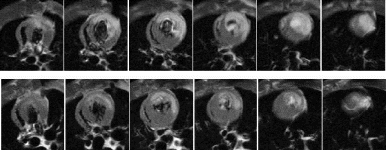
365. Assessment of Myocardial Viability with Intracellular Sodium MRI
Cees J. A. Van Echteld, Ph.D., Maurits A. Jansen, Ph.D.
Heart Lung Center Utrecht/Cardio-MR Laboratory, University Medical Center Utrecht, Utrecht, Netherlands.
Introduction: Intracellular sodium (Nai+) is a sensitive marker of myocardial ischemia and Na+/K+-ATPase function. Following acute ischemia and reperfusion, increased total sodium MR image intensity was shown to be associated with non-viable tissue (1). However, depending on the severity and duration of the ischemic insult, information on both intra- and extracellular sodium may be crucial. Recently, we have shown that intracellular sodium imaging is superior to total sodium imaging in identifying the affected zone under zero flow circumstances (2). The aim of this study is to test the value of intracellular sodium imaging for the assessment of myocardial viability in an isolated rat heart model of low flow (LF) ischemia and reperfusion.
Methods: Hearts of rats were perfused at 37°C and 76 mmHg while stimulated at 5 Hz. Data were acquired using a Bruker AVANCE 400 spectrometer. 1H-Gradient echo images were acquired to serve as anatomical references. To separate the intra- and extracellular sodium resonance, the shift reagent TmDOTP5− was included in the perfusate. Acquisition-weighted 23Na chemical shift imaging (CSI) (16×16, FOV 20×20 cm, slice thickness 5 mm, nominal voxel size 7.8 μl, time/ scan: 4 min) and 23Na spectroscopy (MRS) (time/scan: 1 min) were performed alternately. Control perfusion was followed by 60 min LF (1, 2, or 3% of control coronary flow, n=4 hearts per group) and 40 min of reperfusion.
Results: By using acquisition weighting and a quadrature driven birdcage coil, we were able to reduce total imaging time of the 2D CSI dataset considerably to ∼4 min. Short axis 23Na-CSI images of three hearts subjected to different degrees of ischemia are shown in . Nai+ was already visible during control perfusion (C). It can be clearly seen that image intensity increased with increasing severity of ischemia. During reperfusion, image intensity in the 1% heart remained high. 23Na-MRS showed that increase of Nai+ was larger with lower flow rates . During reperfusion, Nai+ remained elevated in all hearts, but recovery of Nai+ was worst in the 1% heart. Nai+ at the end of LF correlated with end diastolic pressure (R=0.85, p<0.01) during reperfusion and correlated inversely with recovery of rate pressure product (R=0.85, p<0.01).
Conclusion: These data demonstrate that intracellular 23Na CSI imaging can be used to assess viability in the isolated perfused rat heart.
Figure 1.
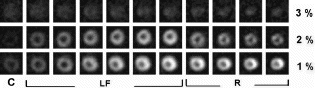
Figure 2.
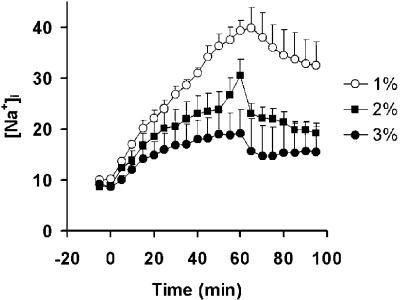
References
1. Kim RJ et al [1997] Circulation 95: 1877–1885
2. Van Emous JG, Nederhoff MGJ and Van Echteld CJA [2001] Proc. ISMRM 9:1832
366. Magnetic Resonance Imaging of Acute Radiofrequency Ablation Lesions
Timm Dickfeld, Ritsushi Kato, Muz Zviman, Glenn Meininger, Lars Lickfett, Krystl Frank, Ron Berger, Hugh Calkins, Henry Halperin.
Cardiology, Johns Hopkins University, Baltimore, MD, USA.
Introduction: Magnetic resonance imaging (MRI) has the potential to complement or eventually substitute fluoroscopy in radiofrequency ablation (RFA) procedures, which has become the preferred treatment strategy for a wide variety of arrhythmias. However, MRI imaging patterns after RFA are controversial and have not been well investigated.
Purpose: We sought to define the characteristic appearance and the effect of time and energy on MR imaging of ablated tissue.
Methods: Using a power-controlled, cooled tip 7-French catheter system RFA lesions (5, 10, 20, 30, 40 and 50 W for 30 s each) were created on the epicardial surface of the right ventricle in 8 mongrel dogs. T1-(spoiled gradient recall acquisition, SPGR) and T2-weighted (fast gradient echo, FSE) images were obtained 30 minutes to 15 hours after RFA using a cardiac phased array and an intrathoracic high-resolution coil. Lesion size, appearance and signal intensities were analyzed and compared to gross anatomy and histopathology.
Results: Lesions were successfully visualized with T2-weighted images 30 min to 15 hours after RF application. Lesions had a characteristic appearance of an elliptical, high density core (Contrast to noise-ratio[CNR]=17) with a surrounding 0.5 mm hypodense rim, which corresponded on histopathology to the central tissue necrosis and the transition zone, respectively. Lesion size and heterogeneous appearance increased with RF energy. Lesion size and appearance were well defined after 30 min and did not change significantly during the 15 hours follow-up (ANOVA). Contrast-to-noise ratio remained unchanged and allowed accurate assessment of the RF lesion at all time points (r=0.91, overestimation of lesion size by 0.12 mm). Transmural lesions could be reliably predicted in >90%. RF lesions were visible as high density lesions in T1- SPGR sequence during entire follow-up, but were less clearly delineated (CNR=9) and underestimated the lesion size by 1.2 mm.
Conclusion: RFA lesions created by a wide range of energies can be reliably imaged with MRI. Lesions characteristics are present after 30 minutes and remain stable for at least 15 hours. These findings confirm a possible role for MRI in guiding and evaluating RF application during electrophysiological ablation procedures.
367. Creation and Sizing of an Atrial Septal Communication Using Real Time and High Resolution MRI Guidance
Carsten Rickers,1 Michael Jerosch-Herold, PhD,2 Schoen Wang, MD,2 Ravi Teja Seethamraju, PhD,2 Norbert Wilke, MD.2
Pediatric Cardiology, University Hospital Eppendorf, Hamburg, Germany, Radiology, cardiac MRI, University of Minnesota, Minneapolis, MN, USA.
In certain congenital heart disease such as transposition of the great arteries the creation of an atrial septal communication is necessary as a palliative intervention. We sought to investigate the feasibility of MRI guided active catheter tracking and balloon dilatation of the fossa ovalis. Furthermore we compared x-ray guided balloon sizing and post mortem examination of the defect with high resolution MRI.
Methods: In five healthy farm pigs (25–35 kg) real time MRI guided catheter tracking and Balloon dilatation of the foramen ovale was performed using a 12–14 mm balloon. For improved catheter tracking and high resolution intravascular imaging, dedicated MRI guidewires (Surgi-Vision) were used. Under real-time MRI guidance (MR fluoroscopy with steady state free precession true FISP MR pulse sequence; 2–5 frames/sec) the introducer sheath was tracked towards the left atrium. Balloondilatation was monitored by high resolution real-time imaging (flip angle 60 degrees; 128 read-out points×100 phase encodings; 300 mm field of view). Following the procedure gradient echo cine and spin-echo high resolution anatomical imaging with the miniture antenna guidewire crossing the defect was performed. Results: Real-time MRI can be used to follow the position of an antenna guiding catheter and the balloon within the inferior vena cava and the heart. Active catheter tracking as well as the balloon dilatation could be controlled under real time MRI. Comparison of x-ray and MRI guided defect sizing with post mortem sizing showed: x-ray guided-post mortem: y=0.94 x+0.79, r=0.95; MRI guided without guidewire-post mortem: y=0.91 x+2.87, r=0.52; MR guided with guidewire-post mortem: y=1.02 x−0.32, r=0.97.
Conclusions: 1. MR guided transcatheter balloon dilatation of the fossa ovalis is feasible. 2. High resolution MRI defect sizing using miniature antenna wires is superior to x-ray guided sizing or MRI sizing with conventional phase array coils.
368. Detection of High Output State by MRI in SLP-76 Deficient Mice Leads to Identification of Unique Angiogenic Defect
Rong Zhou, PhD,1 Mark L. Kahn, M.D.,2 Victor A. Ferrari, M.D.2
Radiology, University of Pennsylvania, Phila., PA, USA, Cardiovascular Medicine, University of Pennsylvania, Phila., PA, USA.
Introduction: SLP-76 is a protein involved in hematopoietic signal pathways. Mice deficient in SLP-76 (SLP-76 −/−) exhibit embryonic hemorrhage, perinatal death and loss of immune receptor signaling. SLP-76 −/− mice which survived to adulthood exhibit significant cardiac enlargement (40% increase in heart: body weight ratio) compared to wild-type littermates.
Purpose: To determine whether cardiomegaly resulted from left ventricular (LV) systolic dysfunction, wild-type mice and mice lacking one or both slp-76 alleles (5 mice in each group) were studied by magnetic resonance imaging (MRI).
Methods: Mice were anesthetized with a 1% isoflurane/air mixture and core temperature maintained at 37°C. All images were generated on a 4.7T horizontal bore spectrometer using an elliptical surface coil. ECG-gated cine images along the LV short axis were acquired using a fast gradient echo sequence permitting multiple (cardiac) phases and segmented k-space acquisition. Stroke volume, ejection fraction, cardiac output and LV mass were determined from these images.
Results: SLP-76 −/− mice exhibited a greater cardiac output (CO, 25.1±2.5 ml/min) and a greater ejection fraction (75±7%) and LV mass (94±27 mg) compared to their wild-type littermates (CO=15.6±3.1 ml/min, EF=60±6%, LV mass=69±12 mg). Heterozygous mice demonstrated similar cardiac functional parameters to the wild-type mice.
Conclusions: Detection of a high output state in SLP-76 −/− mice led to the identification of arterio-venous shunts in the small intestines, and a generalized failure to separate emerging lymphatic vessels from blood vessels. MRI, by elucidating the mechanism of cardiomegaly in the SLP-76 −/− phenotype, led to the discovery of a novel angiogenic defect.
369. Efficacy and Dosing Studies of a Novel Albumin Binding Contrast Agent in Pigs: Optimized Perfusion and Delayed Contrast Enhancement in Jeopardized Myocardium
Neeta Panse, MD,1 Prasad Panse, MD,1 Xiaoen Wang, MD,1 Ravi Seethamraju, PhD,1 Fabio Maggioni,2 Xudong Hu, MD,1 Bayar Batmunh,1 Imran Al-Amin,1 Carsten Rickers, MD,1 Michael Jerosch-Herold, PhD,1 Freidrich Cavagna,2 Norbert Wilke, MD.1
Radiology, University of Minnesota, Minneapolis, MN, USA,Bracco Imaging S.p.A, Milan, Italy.
Introduction: We hypothesize that the higher relaxivity and the strong protein binding properties of a novel intravascular contrast agent (B22956/1) may show advantages for the assessment of myocardial perfusion, when compared to ‘conventional’ extracellular contrast agents such as ProHance.
Purpose: To investigate the optimal dose of the contrast agent B-22956/1(Bracco Imaging SpA, Milan Italy) for MR First Pass Perfusion (MRFPP) Imaging as well as Delayed Contrast Enhancement (DCE). To quantitatively assess the various enhancement patterns of B-22956/1in normal, acute subendocardial infarction and chronic ischemia when compared to ProHance.
Methods: Chronic ischemia was induced by placing an ameroid constrictor (n=5) at one branch of the left circumflex artery (LCX) which gradually occluded over a period of 2–3 weeks. Acute subendocardial infarction was produced by ligating the distal LCx (n=9). MRFPP imaging was performed at different dosages of B22956/1 (n=5) and compared to a standard dose of ProHance (0.03 mmol/kg). MRFPP (T1-TurboFLASH: TR: 2 ms, TE: 1 ms, Bandwith: 770 Hx/pixel, alpha: 18, 1.5 T SONATA, SIEMENS, Erlangen, Germany) was initiated post 2–3 weeks of chronic ischemia and within the first week of acute infarction at Rest and during Stress (Adenosine: 200 micro-gm/mg/min). Delayed contrast enhancement (DCE, “TrueFISP”) was carried out 20–30 minutes after injection of 0.06 mmol/kg of B22956/2 (n=4). The signal enhancement (peak SI−baseline SI)/baseline SI×100) was calculated to evaluate the capability of DCE as well as MRFPP to discern jeopardized from normal myocardium.
Results: The optimal dose range for the contrast bolus injection needed for MRFPP with a power injector ranged from 0.006−0.01 mmol/kg with the optimal myocardial signal enhancement achieved with the latter dose. There was concordance of DCE with B-22956/1 when compared to TTC staining in acute infarctions. It was noted that the infarction size was smaller but closely correlated to TTC staining when compared to ProHance (see Table ).
ProHance vs. B22956/1 in acute infarction demonstrated a significant lower averaged SI (p<0.01) in the infarcted (target) segments with B22956/1. There was no significant relative enhancement difference noted in the remote segments between these two contrast agents. B22956/1 demonstrated an improved remote/target ratio when compared to ProHance (see Table ).
Conclusions: The optimal dose for MRFPP ranged from 0.006–0.01 mmol/kg. In this dose range the B22956/1 offered the best qualitative as well as quantitative MRFPP assessment. At a dose higher than 0.02 mmol/kg the quantitative assessment of MRFPP signal intensity time curves were not adequate due to saturation effects. At this dose a relative signal drop is noted in the remote myocardium reducing the qualitative accuracy. The optimal dose of 0.01 mmol/kg of B22956/1 showed better differentiation of infarcted vs. remote myocardium when compared to the higher but equivalent standard dose of ProHance (0.03 mmol/kg). B22956/1 offered the advantages of a high relaxivity agent which afforded a much smaller dose to achieve better results for MRFPP. However for DCE the optimal dose for B22956/1 was 0.06 mmol/kg which provided comparable results to the use of ProHance with an equivalent dose of 0.3 mmol/kg to delineate infarcted myocardium. The exact pathophysiological mechanisms of DCE with B22956/1 is currently under investigation. This study indicated for the first time that B22956/1 used for MRFPP can qualitatively better differentiate jeopardized from normal myocardium than conventional extracellular contrast agents such as ProHance. These results currently await confirmation in clinical trials. Cardiac MRI with the administration of this improved new intravascular contrast agent will allow optimized assessment of myocardial perfusion, viabilty, and coronary anatomy.
370. Cardiac MRI Demonstrates the Relationship Between the Diastatic Ventricular to Atrial Chamber Volume Ratio and Atrial Ejection Fraction
Andrew W. Bowman,1 Shelton D. Caruthers, PhD,2 Sandor J. Kovacs, PhD, MD.1
Washington University School of Medicine, Saint Louis, MO, USA, Philips Medical Systems, Best, Netherlands.
Introduction: In an effort to better understand the physiology of normal heart function for application to heart dysfunction, one of the goals of our laboratory has been to elucidate and characterize fundamental properties of normal heart physiology in a dynamic and physical sense. Since we view the function of the heart in a physical sense, we specify these properties as mathematical equations that give rise to predictions of causal relations of heart function (1).
One of these basic physical rules involves the total volume of the four-chambered heart, which states that the total volume of the contents in the pericardial sack remain constant throughout the cardiac cycle (2). The constancy of pericardial volume throughout the cardiac cycle has predictable consequences; one of which involves the concept of the left ventricular equilibrium volume (Veq). We have defined Veq as the volume of the ventricle at diastasis (3), the period of the cardiac cycle after the end of early-rapid filling but before the onset of atrial contraction, the ventricles and atria are all relaxed, the mitral and tricuspid valves are open, and there is no net transvalvular flow. Hence, all forces between the atria and ventricles are balanced.
Mathematical modeling of the constant-volume attribute of the four-chambered heart predicts that the ratio of the ventricular blood volume to atrial blood volume at diastasis (V/A ratio) is related to the atrial ejection fraction (EFA) according to the equation:where C is the (constant) total volume of the four cardiac chambers, and Am is the (constant) minimal atrial volume (the atrial volume at ventricular end-diastole). This prediction can be validated in vivo using three-dimensional datasets acquired by cardiac MRI.
Purpose: To derive mathematical predictions concerning normal four-chamber heart physiology from the constant-volume hypothesis and validate them in vivo using three-dimensional datasets obtained from cardiac MRI.
Methods: Ten normal, healthy human volunteer subjects were scanned with a 1.5 T Philips Gyroscan (Release 8.1). Survey images and standard planes for ventricular short-axis and four-chamber views were obtained. Once the planes were determined, the four-chamber plane was used to plan a short-axis cine-stack of between 18–20 slices, 9 mm thick with zero gap, spanning from the ventricular apex through the superior-posterior wall of the left atrium, thereby covering the contents of the entire pericardial sack. The image slices were obtained during 10-second breathholds for one slice. Each slice cine-loop contained 20 phases triggered from the ECG R wave covering the entire cardiac cycle. Upon completion, the data was transferred to a remote Sun Microsystems Ultra Sparc 2 workstation running the Philips EasyVision image analysis software (Release 5.1). All image analysis was performed off-line using the EasyVision, Paint Shop Pro, and Scion Image. For each slice of the phases corresponding to ventricular end-diastole, end-systole, and diastasis, the endocardial contour was traced (see Figure ) and the corresponding volume determined. For each heart phase, the segmental volumes of each chamber were summed and compared to the volume sums of the other heart phases. For each subject, the V/A ratio (defined as [right+left ventricular volume at diastasis]/[right+left atrial volume at diastasis]) and EFA (defined by {[(right+left atrial volume at diastasis)−(minimal right+left atrial volume)]/[right+left atrial volume at diastasis]}) were calculated.
Results: Values obtained for each parameter are given in Table . Linear regression yields EFA=−0.26*(V/A)+0.84; r=−0.87 (see Figure. ). Similar analysis for the left and right sides of the heart individually yielded r values of −0.46 and −0.84, respectively.
Conclusions: Consistent with the prediction derived from the constant-volume hypothesis, the results demonstrate that the lumped ventricular to atrial volume ratio at diastasis decreases as EFA increases. One of the benefits of the prediction is that it is applicable to hearts that vary substantially in size (note the variability in the parameter C in . The constants in Eq. [1] are dimensionless: Am/C is the ratio of minimal atrial blood volume to total four-chamber blood volume (note the similarity of the magnitude of the slope of the regression equation to the value of Am/C in Table .
We also note that even though the parameters Am and C vary substantially over the population studied, the ratio of Am/C is remarkably fixed; again, a predicted consequence of the constant-volume attribute of the four-chambered heart. It seems likely that this ratio may serve as an important index of global heart function.
The four-chambered heart as a whole also obeys model prediction better than either the left or right sides of the heart individually. This emphasizes the importance of studying cardiac function in a global sense, which is particularly suited to the capabilities of cardiac MRI. Further studies are warranted.
We therefore conclude that the constant-volume attribute of the four-chambered heart can be used to derive relationships between the equilibrium (diastatic) state of the atria and ventricles and atrial function, and these derivations can be validated using cardiac MRI. The quest for a deeper understanding of the constant-volume hypothesis, development of novel predictions to be tested via MRI, and application to disease states is in progress.
Figure 1.
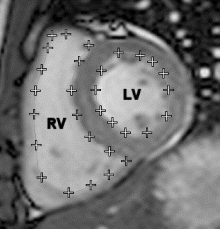
Figure 2.
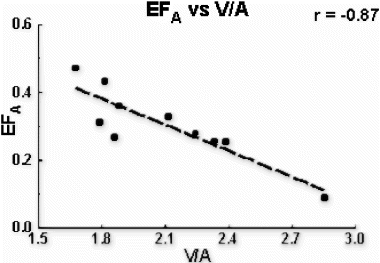
References
1). Kovacs SJ et al. Cardiol Clin 18(3):459, 2000.
2). Hamilton W, Rompf H. Am J Physiol 102:559, 1932.
3). Kovacs SJ. Int J Cardiovasc Med Sci 1(1):109, 1997.
371. MRI Guided Myocardial Injections Using a Novel Stem-Cell Delivery Catheter
Carsten Rickers, MD,1 Robert Gallegos, MD,2 Ravi Teja Seethamraju, PhD,3 Morton Bolman, ll, MD,4 Michael Jerosch-Herold, MD,5 Schoen Wang, MD,6 Norbert Wilke, MD.5
Pediatric Cardiology, University Hospital Eppendorf, Hamburg, Germany,University of Minnesota, Cardiovascular and Thoracic Surgery, MN, USA,University of Minnesota, Minneapolis, MN, USA,Cardiovascular and Thoracic Surgery, University of Minnesota, Minneapolis, MN, USA,Radiology, cardiac MRI, University of Minnesota, Minneapolis, MN, USA,Radiology, University of Minnesota, Minneapolis, MN, USA.
We sought to investigate the feasibility of catheter tracking and LV targeting for myocardial injections with a MR compatible stem-cell injection catheter (Boston Scientific) in an animal model.
Methods: In three healthy animals (two dogs, one pig) we placed a MR compatible stem-cell catheter in the left ventricle. Under real time MRI guidance (MR fluoroscopy with steady state free precession true FISP MR pulse sequence; 8–10 frames/sec) we targeted the LV apex. Gadolinium/blue dye injection was monitored by high resolution real-time imaging (flip angle 60°; 128 read-out points×100 phase encodings; 280 mm field of view) real-time imaging with a temporal resolution of 300 ms. Following the procedure gradient echo cine and spin-echo anatomical imaging was applied to rule out any vascular or cardiac damage. The extent of the Gadolinium injection in the apical myocardium was veryfied by using a 3D inversion recovery steady state free precession gradient echo sequence (true fisp) for late enhancement.
Results: Real time MRI made it possible to follow the position of the catheter within the LV. The catheter placement as well as the myocardial injections could be monitored by high resolution MRI. The extend and the depth of intramyocardial Gadolinium distribution correlated well with post mortem examination. Current limitations for passive stem-cell catheter tracking are caused by a time delay between image acquisition and image display that will be overcome with faster computer hardware.
Conclusions: These preliminary data suggest that MR guided stem-cell injections into the LV myocardium can be performed under real-time and high resolution MRI. These results are the basis for ongoing experimental trials and developments for MRI-guided stem-cell treatment including therapy control with MR perfusion and cine imaging.
372. A Triggering Approach Utilizing the Full Cardiac Cycle Better Represents True End-Diastole at the End, not the Beginning, of the Cardiac Cycle
Robert W. W. Biederman, Jane Ripple, June Yamrozik, Geetha Rayarao, Diane A. Vido, Mark Doyle.
Allegheny General Hospital, Pittsburgh, PA, USA.
Introduction: Typically, current left ventricular volumetric calculations utilizing retrospective cardiac gating algorithms employ acquisitions triggered to the QRS complex. Recognizing that there is only a small, presumably, negligible delay during the isovolumic contraction period prior to image readout, end-diastole volume is obtained at this point, despite the acknowledgment that end-diastole has occurred considerably earlier. Triggering approaches that continue to acquire data until detection of the next R wave peak can potentially more fully represent the cardiac cycle. However, inherent in this triggering approach is that any delay in sensing and responding to R wave detection serves to delay acquisition initiation of the first cardiac phase. Similarly it may prolong the apparent end of the cardiac cycle. Thus, the first represented cardiac phase potentially could occur in the isovolumic contraction period or even progress into early systole leading to erroneous detection of the end-diastole period.
Hypothesis: We tested the hypothesis that the ability to sample data retrospectively to the succeeding R wave leads to a truer representation of end-diastolic volume (EDVT) and other EDV based metrics, at the last cardiac phase as compared to the traditional first cardiac phase (EDV1).
Methods: Using a GE CV/i 1.5T scanner and standard FIESTA sequences, 20 consecutive patients without LBBB underwent imaging forstandard LV morphologic assessment. Measurement of LV EDV, SV, EF and LV mass was performed by employing short-axis cardiac gated, breathhold contiguous slices (8 mm) with retrospective gating at 20 phases per cycle. Comparisons of LV calculations using EDV measured at the first phase (1) and the last phase (20) were performed.
Results: Significant differences were present in standard LV volumetric and morphologic values: In 20 of 20 patients, EDVT was greater than EDV1. On average, EDVT as represented at phase 20 was 4.57 ml greater than at phase 1 (p<0.0001, CI=6.9 to 2.3, β=0.97). This translated into an underestimation of EF by 1.6% (CI=0.7 to 2.5) and SV by 5.2 ml (CI=2.9 to 7.5) (both p<0.0001, β=0.95). LV mass was overestimated by 7.1 g (p<0.0001, (CI=4.4 to 9.9), β=1.00). In 2/20 patients (10%), this potentially misguided correct pharmacological therapy in those whom EF was thought to be <40%. In 3 of 20 patients (15%), left ventricular function became normal, >55%, whereas they were previously deemed to be dysfunctional.
Conclusions: LV volumetric and morphologic assessments of EDV, SV, EF may be systematically underestimated while LV mass is slightly overestimated if the standard approach of utilizing the first cardiac phase to represent end-diastole is employed. As imaging sequences continue to reduce the cardiac phase duration, this underestimation will be magnified. The ability to image true end-diastole (i.e. post-atial systole or last cardiac phase) will permit more accurate calculations of clinical LV metrics and should be incorporated into standard practice.
373. Automated Quantification of Gadolinium Enhanced Myocardial Infarction Size in Rhesus Monkeys
Li-Yueh Hsu, ScD, Anthony H. Aletras, PhD, Kwabena O. Agyeman, MD, Andrew E. Arai
NHLBI, National Institutes of Health, Bethesda, MD, USA.
Introduction: Gadolinium enhanced MRI accurately depicts the size and localization of myocardial infarction when performed at high resolution and signal to noise. To use this methodology to perform serial examinations in chronic animal studies, we aimed to develop objective computer aided image analysis algorithm to measure the size of myocardial infarctions.
Purpose: To compare a new computer algorithm tuned to automatically discriminate infarcted myocardium from normal myocardium on conventional inversion recovery prepared fast gradient echo MRI.
Methods: MRI scans were performed on 15 rhesus monkeys: 12 scans before and 15 scans after myocardial infarction. Myocardial infarction was induced under anesthesia by ligating the mid left anterior descending coronary artery for 2 hours followed by reperfusion. Infarcted animals were imaged 1 week after the operation. Pathological analysis of infarct size was confirmed in 5 monkeys with triphenyltetrazolium chloride staining (TTC).
MRI scans were performed on a 1.5T scanner (General Electric) while animals were under anesthesia and on a ventilator. Imaging was performed during suspended respiration and was ECG gated. Infarct images were obtained 20–30 minutes after intravenous administration of gadolinium DTPA (0.2 mmol/kg). Typical acquisition parameters achieved a spatial resolution of 0.8×1.2×5 mm and an acquisition window of 69 ms within the cardiac cycle to avoid motion blurring at the relatively high heart rates of this model.
The infarct segmentation algorithm consists of a sequence of pre-determined steps after the user determines epicardial and endocardial borders. First, an image independent threshold is computed automatically by fitting a Rayleigh curve to the image intensity histogram. This threshold represents the best value which separates the infarct and normal tissues distribution. Our first result (simple threshold) is computed at this step. Next, we use an image morphology operation to open up connected tissue boundaries. This process also cleans up small disjoined regions after the binary threshold. Finally, a connected component labeling technique is used to analyze the candidate infarct tissues in 3D. The largest aggregated 3D region with a volume size greater than a pre-defined value (0.1 mg) is selected as the final infarct section.
Results: In the 5 animals with pathological infarct size by TTC staining, the correlation in infarct size between an expert observer and that measured on the TTC stained slices was y=0.80x+0.04, r=0.91. The simple threshold method of quantification resulted in significant overestimation of infarct size as noted in the correlation and Bland Altman analysis when compared with the expert measurement. The correlation between infarct size measured in pixels by the simple threshold and the expert reader was: y=1.36x+319, r=0.82. The full infarct segmentation algorithm improved the correlation to: y=1.15x+45, r=0.88 , reduced random errors, and decreased the systematic overestimation of infarct size considerably .
Conclusions: The use of image processing techniques (image morphology operation and connected component labeling), requirement of a minimal size for infarcted myocardium, and automatically calculated thresholding resulted in excellent correlations between computer quantification of infarct size and human expert traces. This methodology improved the correlation, decreased random errors, and reduced systematic overestimation that occurred while using a simple threshold methodology. This automated methodology appears promising for following serial infarct size in clinical and basic science studies.
Figure 1.
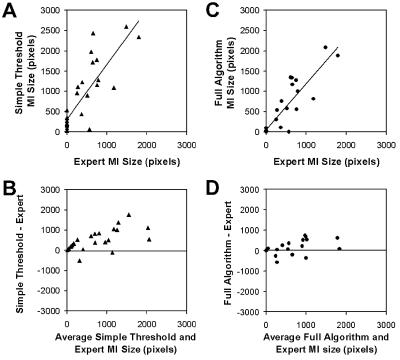
374. Factors Influencing Semiquantitaive Evaluation of Magnetic Resonance First Pass Myocardial Perfusion
Nidal Al-Saadi, Hassan Abdel-Aty, MD, Daniel Messroghli, MD, Rainer Dietz, MD, Matthias Friedrich, MD
Cardiology, Franz-Volhard-Klinik, Charite, Campus Berlin-Buch, Humboldt University, Berlin, Germany.
Introduction: Semiquantitative evaluation of myocardial perfusion using the upslope of the signal intensity time curves was shown to be feasible in the evaluation of myocardial ischemia. However, the range of data points necessary to determine the upslope is not standardized.
Purpose: We evaluated the effect of using different numbers of data points for the calculation of the upslope on the semiquantitative results.
Methods: First pass MR perfusion studies, acquired on a 1.5T cardiovascular system (Signa CV/i GE Medical Systems) of 20 patients with coronary artery disease were analyzed. Images were acquired using a GRE-EPI hybrid sequence (4 slices per heart beat) at rest and after adenosine stress (140 μg/kg/min). Signal intensity curves were acquired from 6 segments in each slice (total 960 segments). From each signal intensity curve 4 separate calculations of the upslope and the resulting perfusion reserve index were performed. The maximal slope during the wash-in was calculated from 3 consecutive data points and then repeated 3 times using 4, 5 and 6 data points for the calculation of the upslope (slope 3, 4, 5 and 6). From these results the corresponding perfusion reserve index (upslope stress divided by the upslope at rest) was calculated (MPRI 3, 4, 5 and 6). An ANOVA analysis for repeated measurements was performed.
Results: There was a significant reduction of the calculated upslope with an increasing number of data points (Slope 3: 25.0; slope 4: 24.3; slope 5: 22.6; slope 6: 21.6; p<0.001 for trend). The calculated slopes showed lower values in the inferior segments compared to anterior segments (17%), and showed significant differences between slices (p<0.01 for all). Myocardial perfusion reserve index showed no significant difference between all ranges from MPRI 3 to MPRI 6 and no significant differences between anterior and inferior segments or different slices.
Conclusion: Semiquantitative evaluation of myocardial perfusion based on the upslope demands a standardization of the range of data points. Our results indicate that a number of 4 data points seems to be appropriate. The myocardial perfusion reserve index was less susceptible than the upslope.
Figure 1.
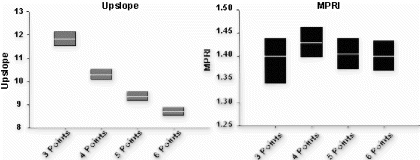
375. Identification and Characterization of Infarcted Canine Myocardium by Native Contrast MRI
Steven D. Buchthal.
Medicine, University of Alabama at Birminghamn, Birmingham, AL, USA.
Introduction: We have explored a novel approach to characterize irreversibly damaged myocardium using native contrast MRI. MTC-weighted MRI has been shown to differentiate irreversible damaged from injured yet viable tissue. T2-weighted MRI, on the other hand, highlights the territory of an infarct, but consistently overestimates the infarct size due to ediema extending into the peri-infarct.
Purpose: The goal was to correlate in vivo MTC-weighted imaging with ex vivo imaging at pathology to help establish this technique as a completely non-invasive tool for staging ischemic damage to the myocardium.
Methods: Following control MRI to screen for abnormalities, twenty-one male dogs underwent LAD occlusion. They were divided into groups and in vivo T2- and MTC-weighted images were obtained 1,3,8,14 and 21 days post-occlusion. Following sacrifice, the hearts were excised and stained by dual perfusion. Images were also obtained from the ex vivo heart.
Results: The infarct showed a higher intensity in the MTC-weighted image compared to uninvolved myocardium 8 days post-occlusion both in vivo and ex vivo. , p<0.01 and p<0.05, respectively) The MTC enhanced region corresponded with the area of the infarct and not the peri-infarct. T2-weighted images showed an increased intensity corresponding to the infarct plus the peri-infarct in the first three days, but this correlation disappeared by 8 days.
Conclusion: The combination of MTC and T2-weighted MRI is a promising technique to define the extent of irreversibly damaged myocardium as early as one week after acute MI without the use of contrast agents.
Figure 1.